Mean State
Download Data |
Period Mean (original grids) [W m-2] |
Model Period Mean (intersection) [W m-2] |
Benchmark Period Mean (intersection) [W m-2] |
Model Period Mean (complement) [W m-2] |
Benchmark Period Mean (complement) [W m-2] |
Bias [W m-2] |
RMSE [W m-2] |
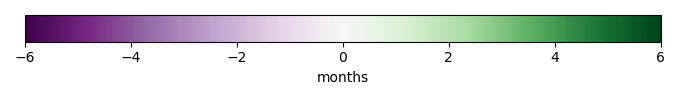
Phase Shift [months] |
Bias Score [1] |
RMSE Score [1] |
Seasonal Cycle Score [1] |
Spatial Distribution Score [1] |
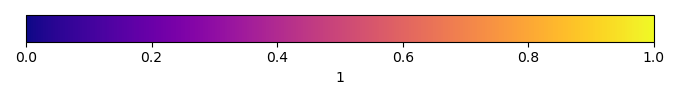
Overall Score [1] |
|||
|---|---|---|---|---|---|---|---|---|---|---|---|---|---|---|---|---|
| Benchmark | [-] | 40.1 | ||||||||||||||
| CESM3_092H | [-] | 41.5 | 41.0 | 40.1 | 40.7 | 0.993 | 14.6 | 2.15 | 0.713 | 0.498 | 0.670 | 0.989 | 0.674 | |||
| CESM3_098bH | [-] | 37.7 | 37.3 | 40.1 | 35.6 | -2.82 | 13.6 | 1.97 | 0.676 | 0.547 | 0.700 | 0.991 | 0.692 | |||
| CMIP6_001 | [-] | 47.5 | 46.6 | 40.1 | 49.8 | 41.3 | 6.67 | 16.2 | 1.95 | 0.555 | 0.513 | 0.705 | 0.989 | 0.655 | ||
| LE2_001 | [-] | 47.5 | 46.5 | 40.1 | 49.8 | 41.3 | 6.62 | 16.3 | 2.05 | 0.563 | 0.505 | 0.681 | 0.989 | 0.648 |
Download Data |
Period Mean (original grids) [W m-2] |
Model Period Mean (intersection) [W m-2] |
Benchmark Period Mean (intersection) [W m-2] |
Model Period Mean (complement) [W m-2] |
Benchmark Period Mean (complement) [W m-2] |
Bias [W m-2] |
RMSE [W m-2] |
Phase Shift [months] |
Bias Score [1] |
RMSE Score [1] |
Seasonal Cycle Score [1] |
Spatial Distribution Score [1] |
Overall Score [1] |
|||
|---|---|---|---|---|---|---|---|---|---|---|---|---|---|---|---|---|
| Benchmark | [-] | 50.4 | ||||||||||||||
| CESM3_092H | [-] | 49.5 | 49.7 | 50.4 | 55.5 | -0.607 | 16.8 | 1.66 | 0.645 | 0.408 | 0.789 | 0.944 | 0.639 | |||
| CESM3_098bH | [-] | 41.8 | 41.9 | 50.4 | 47.0 | -8.39 | 18.2 | 1.61 | 0.451 | 0.427 | 0.786 | 0.960 | 0.610 | |||
| CMIP6_001 | [-] | 53.3 | 53.5 | 50.5 | 59.6 | 30.9 | 3.08 | 17.2 | 1.44 | 0.580 | 0.431 | 0.825 | 0.935 | 0.641 | ||
| LE2_001 | [-] | 53.4 | 53.6 | 50.5 | 59.6 | 30.9 | 3.22 | 17.1 | 1.54 | 0.584 | 0.432 | 0.807 | 0.934 | 0.637 |
Download Data |
Period Mean (original grids) [W m-2] |
Model Period Mean (intersection) [W m-2] |
Benchmark Period Mean (intersection) [W m-2] |
Model Period Mean (complement) [W m-2] |
Benchmark Period Mean (complement) [W m-2] |
Bias [W m-2] |
RMSE [W m-2] |
Phase Shift [months] |
Bias Score [1] |
RMSE Score [1] |
Seasonal Cycle Score [1] |
Spatial Distribution Score [1] |
Overall Score [1] |
|||
|---|---|---|---|---|---|---|---|---|---|---|---|---|---|---|---|---|
| Benchmark | [-] | 55.9 | ||||||||||||||
| CESM3_092H | [-] | 60.5 | 60.6 | 55.9 | 60.5 | 4.93 | 16.6 | 1.03 | 0.510 | 0.488 | 0.877 | 0.921 | 0.657 | |||
| CESM3_098bH | [-] | 57.4 | 57.4 | 55.9 | 57.9 | 1.78 | 15.8 | 1.10 | 0.545 | 0.500 | 0.868 | 0.934 | 0.669 | |||
| CMIP6_001 | [-] | 58.2 | 58.3 | 55.9 | 57.7 | 63.1 | 2.58 | 17.5 | 0.910 | 0.487 | 0.468 | 0.896 | 0.892 | 0.642 | ||
| LE2_001 | [-] | 57.9 | 58.1 | 55.9 | 57.5 | 63.1 | 2.33 | 17.5 | 0.928 | 0.487 | 0.467 | 0.898 | 0.902 | 0.644 |
Download Data |
Period Mean (original grids) [W m-2] |
Model Period Mean (intersection) [W m-2] |
Benchmark Period Mean (intersection) [W m-2] |
Model Period Mean (complement) [W m-2] |
Benchmark Period Mean (complement) [W m-2] |
Bias [W m-2] |
RMSE [W m-2] |
Phase Shift [months] |
Bias Score [1] |
RMSE Score [1] |
Seasonal Cycle Score [1] |
Spatial Distribution Score [1] |
Overall Score [1] |
|||
|---|---|---|---|---|---|---|---|---|---|---|---|---|---|---|---|---|
| Benchmark | [-] | 4.01 | ||||||||||||||
| CESM3_092H | [-] | 5.74 | 5.47 | 4.01 | 7.06 | 1.55 | 11.8 | 0.612 | 0.800 | 0.554 | 0.956 | 0.805 | 0.734 | |||
| CESM3_098bH | [-] | 5.68 | 5.48 | 4.01 | 6.64 | 1.55 | 10.9 | 0.315 | 0.810 | 0.586 | 0.977 | 0.757 | 0.743 | |||
| CMIP6_001 | [-] | 8.31 | 8.70 | 4.01 | 6.57 | 4.76 | 12.9 | 0.553 | 0.696 | 0.538 | 0.954 | 0.907 | 0.726 | |||
| LE2_001 | [-] | 8.08 | 8.48 | 4.01 | 6.31 | 4.54 | 13.5 | 0.774 | 0.703 | 0.507 | 0.930 | 0.890 | 0.707 |
Download Data |
Period Mean (original grids) [W m-2] |
Model Period Mean (intersection) [W m-2] |
Benchmark Period Mean (intersection) [W m-2] |
Model Period Mean (complement) [W m-2] |
Benchmark Period Mean (complement) [W m-2] |
Bias [W m-2] |
RMSE [W m-2] |
Phase Shift [months] |
Bias Score [1] |
RMSE Score [1] |
Seasonal Cycle Score [1] |
Spatial Distribution Score [1] |
Overall Score [1] |
|||
|---|---|---|---|---|---|---|---|---|---|---|---|---|---|---|---|---|
| Benchmark | [-] | 13.9 | ||||||||||||||
| CESM3_092H | [-] | 30.5 | 28.6 | 13.9 | 32.9 | 14.9 | 17.3 | 1.90 | 0.260 | 0.671 | 0.723 | 0.905 | 0.646 | |||
| CESM3_098bH | [-] | 23.2 | 22.3 | 13.9 | 24.4 | 8.38 | 12.9 | 2.34 | 0.537 | 0.659 | 0.643 | 0.908 | 0.681 | |||
| CMIP6_001 | [-] | 33.9 | 31.9 | 13.9 | 36.5 | 16.9 | 18.1 | 20.3 | 1.72 | 0.155 | 0.658 | 0.753 | 0.953 | 0.635 | ||
| LE2_001 | [-] | 33.9 | 31.7 | 13.9 | 36.9 | 16.9 | 17.9 | 20.2 | 1.71 | 0.158 | 0.647 | 0.765 | 0.962 | 0.636 |
Download Data |
Period Mean (original grids) [W m-2] |
Model Period Mean (intersection) [W m-2] |
Benchmark Period Mean (intersection) [W m-2] |
Model Period Mean (complement) [W m-2] |
Benchmark Period Mean (complement) [W m-2] |
Bias [W m-2] |
RMSE [W m-2] |
Phase Shift [months] |
Bias Score [1] |
RMSE Score [1] |
Seasonal Cycle Score [1] |
Spatial Distribution Score [1] |
Overall Score [1] |
|||
|---|---|---|---|---|---|---|---|---|---|---|---|---|---|---|---|---|
| Benchmark | [-] | 10.5 | ||||||||||||||
| CESM3_092H | [-] | 12.4 | 12.2 | 10.5 | 15.0 | 1.74 | 11.7 | 1.17 | 0.661 | 0.558 | 0.872 | 0.913 | 0.713 | |||
| CESM3_098bH | [-] | 11.3 | 11.1 | 10.5 | 13.7 | 0.634 | 10.9 | 0.976 | 0.693 | 0.586 | 0.902 | 0.906 | 0.735 | |||
| CMIP6_001 | [-] | 19.4 | 19.4 | 10.5 | 19.5 | 9.04 | 14.6 | 0.775 | 0.415 | 0.537 | 0.931 | 0.949 | 0.674 | |||
| LE2_001 | [-] | 19.1 | 19.1 | 10.5 | 18.9 | 8.71 | 14.3 | 0.740 | 0.429 | 0.535 | 0.934 | 0.952 | 0.677 |
Download Data |
Period Mean (original grids) [W m-2] |
Model Period Mean (intersection) [W m-2] |
Benchmark Period Mean (intersection) [W m-2] |
Model Period Mean (complement) [W m-2] |
Benchmark Period Mean (complement) [W m-2] |
Bias [W m-2] |
RMSE [W m-2] |
Phase Shift [months] |
Bias Score [1] |
RMSE Score [1] |
Seasonal Cycle Score [1] |
Spatial Distribution Score [1] |
Overall Score [1] |
|||
|---|---|---|---|---|---|---|---|---|---|---|---|---|---|---|---|---|
| Benchmark | [-] | 27.7 | ||||||||||||||
| CESM3_092H | [-] | 33.2 | 33.4 | 27.7 | 28.8 | 5.65 | 13.4 | 1.15 | 0.447 | 0.533 | 0.852 | 0.932 | 0.660 | |||
| CESM3_098bH | [-] | 31.4 | 31.6 | 27.7 | 26.4 | 3.88 | 12.1 | 1.18 | 0.509 | 0.570 | 0.854 | 0.903 | 0.681 | |||
| CMIP6_001 | [-] | 35.2 | 35.3 | 27.7 | 32.3 | 15.7 | 7.59 | 15.2 | 1.11 | 0.375 | 0.479 | 0.871 | 0.906 | 0.622 | ||
| LE2_001 | [-] | 34.9 | 34.9 | 27.7 | 32.6 | 15.7 | 7.21 | 14.8 | 1.06 | 0.389 | 0.490 | 0.878 | 0.929 | 0.635 |
Download Data |
Period Mean (original grids) [W m-2] |
Model Period Mean (intersection) [W m-2] |
Benchmark Period Mean (intersection) [W m-2] |
Model Period Mean (complement) [W m-2] |
Benchmark Period Mean (complement) [W m-2] |
Bias [W m-2] |
RMSE [W m-2] |
Phase Shift [months] |
Bias Score [1] |
RMSE Score [1] |
Seasonal Cycle Score [1] |
Spatial Distribution Score [1] |
Overall Score [1] |
|||
|---|---|---|---|---|---|---|---|---|---|---|---|---|---|---|---|---|
| Benchmark | [-] | 36.8 | ||||||||||||||
| CESM3_092H | [-] | 41.5 | 41.8 | 36.8 | 39.6 | 5.11 | 18.0 | 1.70 | 0.604 | 0.396 | 0.784 | 0.988 | 0.634 | |||
| CESM3_098bH | [-] | 35.0 | 35.5 | 36.8 | 31.9 | -1.29 | 15.9 | 1.62 | 0.665 | 0.456 | 0.798 | 0.968 | 0.668 | |||
| CMIP6_001 | [-] | 43.3 | 43.2 | 36.8 | 44.3 | 31.7 | 6.58 | 19.7 | 1.81 | 0.546 | 0.362 | 0.763 | 0.984 | 0.603 | ||
| LE2_001 | [-] | 44.7 | 44.5 | 36.8 | 45.9 | 31.7 | 7.86 | 20.6 | 1.79 | 0.504 | 0.347 | 0.772 | 0.974 | 0.589 |
Download Data |
Period Mean (original grids) [W m-2] |
Model Period Mean (intersection) [W m-2] |
Benchmark Period Mean (intersection) [W m-2] |
Model Period Mean (complement) [W m-2] |
Benchmark Period Mean (complement) [W m-2] |
Bias [W m-2] |
RMSE [W m-2] |
Phase Shift [months] |
Bias Score [1] |
RMSE Score [1] |
Seasonal Cycle Score [1] |
Spatial Distribution Score [1] |
Overall Score [1] |
|||
|---|---|---|---|---|---|---|---|---|---|---|---|---|---|---|---|---|
| Benchmark | [-] | 1.17 | ||||||||||||||
| CESM3_092H | [-] | 2.99 | 3.29 | 1.17 | 2.04 | 2.13 | 10.8 | 0.567 | 0.787 | 0.595 | 0.956 | 0.612 | 0.709 | |||
| CESM3_098bH | [-] | 2.70 | 2.96 | 1.17 | 1.85 | 1.80 | 10.5 | 0.392 | 0.797 | 0.604 | 0.971 | 0.539 | 0.703 | |||
| CMIP6_001 | [-] | 3.67 | 4.61 | 1.17 | 0.0750 | 7.31 | 3.46 | 14.8 | 0.983 | 0.754 | 0.436 | 0.912 | 0.781 | 0.664 | ||
| LE2_001 | [-] | 3.76 | 4.73 | 1.17 | 0.00871 | 7.31 | 3.57 | 14.6 | 1.04 | 0.748 | 0.449 | 0.902 | 0.782 | 0.666 |
Download Data |
Period Mean (original grids) [W m-2] |
Model Period Mean (intersection) [W m-2] |
Benchmark Period Mean (intersection) [W m-2] |
Model Period Mean (complement) [W m-2] |
Benchmark Period Mean (complement) [W m-2] |
Bias [W m-2] |
RMSE [W m-2] |
Phase Shift [months] |
Bias Score [1] |
RMSE Score [1] |
Seasonal Cycle Score [1] |
Spatial Distribution Score [1] |
Overall Score [1] |
|||
|---|---|---|---|---|---|---|---|---|---|---|---|---|---|---|---|---|
| Benchmark | [-] | 65.3 | ||||||||||||||
| CESM3_092H | [-] | 64.6 | 66.7 | 65.3 | 47.3 | 1.07 | 13.4 | 0.600 | 0.559 | 0.547 | 0.948 | 0.844 | 0.689 | |||
| CESM3_098bH | [-] | 60.1 | 62.0 | 65.3 | 44.4 | -3.60 | 13.8 | 0.521 | 0.568 | 0.505 | 0.957 | 0.912 | 0.690 | |||
| CMIP6_001 | [-] | 67.6 | 69.0 | 65.4 | 55.5 | 54.2 | 3.40 | 13.1 | 0.545 | 0.603 | 0.533 | 0.948 | 0.946 | 0.713 | ||
| LE2_001 | [-] | 69.5 | 71.0 | 65.4 | 56.5 | 54.2 | 5.43 | 13.9 | 0.793 | 0.541 | 0.536 | 0.923 | 0.922 | 0.692 |
Download Data |
Period Mean (original grids) [W m-2] |
Model Period Mean (intersection) [W m-2] |
Benchmark Period Mean (intersection) [W m-2] |
Model Period Mean (complement) [W m-2] |
Benchmark Period Mean (complement) [W m-2] |
Bias [W m-2] |
RMSE [W m-2] |
Phase Shift [months] |
Bias Score [1] |
RMSE Score [1] |
Seasonal Cycle Score [1] |
Spatial Distribution Score [1] |
Overall Score [1] |
|||
|---|---|---|---|---|---|---|---|---|---|---|---|---|---|---|---|---|
| Benchmark | [-] | 11.6 | ||||||||||||||
| CESM3_092H | [-] | 23.4 | 23.1 | 11.6 | 25.0 | 11.8 | 17.8 | 0.647 | 0.269 | 0.414 | 0.953 | 0.921 | 0.594 | |||
| CESM3_098bH | [-] | 21.3 | 20.9 | 11.6 | 22.9 | 9.58 | 15.3 | 0.645 | 0.340 | 0.486 | 0.951 | 0.930 | 0.639 | |||
| CMIP6_001 | [-] | 26.3 | 26.2 | 11.6 | 26.7 | 26.2 | 15.0 | 20.1 | 0.905 | 0.140 | 0.385 | 0.912 | 0.892 | 0.543 | ||
| LE2_001 | [-] | 26.3 | 26.2 | 11.6 | 26.7 | 26.2 | 15.0 | 20.2 | 0.886 | 0.144 | 0.389 | 0.926 | 0.868 | 0.543 |
Download Data |
Period Mean (original grids) [W m-2] |
Model Period Mean (intersection) [W m-2] |
Benchmark Period Mean (intersection) [W m-2] |
Model Period Mean (complement) [W m-2] |
Benchmark Period Mean (complement) [W m-2] |
Bias [W m-2] |
RMSE [W m-2] |
Phase Shift [months] |
Bias Score [1] |
RMSE Score [1] |
Seasonal Cycle Score [1] |
Spatial Distribution Score [1] |
Overall Score [1] |
|||
|---|---|---|---|---|---|---|---|---|---|---|---|---|---|---|---|---|
| Benchmark | [-] | 34.8 | ||||||||||||||
| CESM3_092H | [-] | 32.4 | 39.6 | 34.8 | 4.49 | 4.82 | 15.1 | 1.15 | 0.505 | 0.527 | 0.863 | 0.979 | 0.680 | |||
| CESM3_098bH | [-] | 29.7 | 36.6 | 34.8 | 3.33 | 1.79 | 14.4 | 1.10 | 0.526 | 0.547 | 0.871 | 0.977 | 0.693 | |||
| CMIP6_001 | [-] | 34.3 | 42.1 | 34.8 | 4.24 | 45.3 | 7.34 | 16.4 | 1.13 | 0.437 | 0.501 | 0.866 | 0.980 | 0.657 | ||
| LE2_001 | [-] | 34.3 | 42.1 | 34.8 | 4.30 | 45.3 | 7.39 | 16.5 | 1.15 | 0.434 | 0.502 | 0.865 | 0.980 | 0.657 |
Download Data |
Period Mean (original grids) [W m-2] |
Model Period Mean (intersection) [W m-2] |
Benchmark Period Mean (intersection) [W m-2] |
Model Period Mean (complement) [W m-2] |
Benchmark Period Mean (complement) [W m-2] |
Bias [W m-2] |
RMSE [W m-2] |
Phase Shift [months] |
Bias Score [1] |
RMSE Score [1] |
Seasonal Cycle Score [1] |
Spatial Distribution Score [1] |
Overall Score [1] |
|||
|---|---|---|---|---|---|---|---|---|---|---|---|---|---|---|---|---|
| Benchmark | [-] | 51.8 | ||||||||||||||
| CESM3_092H | [-] | 50.5 | 50.0 | 51.8 | 58.8 | -1.60 | 11.8 | 1.15 | 0.487 | 0.658 | 0.869 | 0.977 | 0.730 | |||
| CESM3_098bH | [-] | 46.0 | 45.4 | 51.8 | 54.5 | -6.15 | 13.0 | 1.08 | 0.459 | 0.640 | 0.880 | 0.956 | 0.715 | |||
| CMIP6_001 | [-] | 54.5 | 53.9 | 51.8 | 64.3 | 49.2 | 2.36 | 12.6 | 1.22 | 0.445 | 0.651 | 0.854 | 0.974 | 0.715 | ||
| LE2_001 | [-] | 54.5 | 53.9 | 51.8 | 64.6 | 49.2 | 2.35 | 12.7 | 1.24 | 0.434 | 0.652 | 0.857 | 0.975 | 0.714 |
Download Data |
Period Mean (original grids) [W m-2] |
Model Period Mean (intersection) [W m-2] |
Benchmark Period Mean (intersection) [W m-2] |
Model Period Mean (complement) [W m-2] |
Benchmark Period Mean (complement) [W m-2] |
Bias [W m-2] |
RMSE [W m-2] |
Phase Shift [months] |
Bias Score [1] |
RMSE Score [1] |
Seasonal Cycle Score [1] |
Spatial Distribution Score [1] |
Overall Score [1] |
|||
|---|---|---|---|---|---|---|---|---|---|---|---|---|---|---|---|---|
| Benchmark | [-] | 7.56 | ||||||||||||||
| CESM3_092H | [-] | 6.55 | 6.73 | 7.56 | 5.88 | -0.834 | 12.4 | 0.584 | 0.804 | 0.520 | 0.952 | 0.914 | 0.742 | |||
| CESM3_098bH | [-] | 6.49 | 6.47 | 7.56 | 6.26 | -1.05 | 12.1 | 0.540 | 0.818 | 0.527 | 0.955 | 0.934 | 0.752 | |||
| CMIP6_001 | [-] | 6.76 | 7.84 | 7.56 | 4.43 | 9.55 | 0.253 | 15.6 | 1.02 | 0.766 | 0.398 | 0.890 | 0.831 | 0.657 | ||
| LE2_001 | [-] | 6.60 | 7.58 | 7.56 | 4.50 | 9.55 | -0.00205 | 15.3 | 0.931 | 0.768 | 0.408 | 0.905 | 0.833 | 0.664 |
Download Data |
Period Mean (original grids) [W m-2] |
Model Period Mean (intersection) [W m-2] |
Benchmark Period Mean (intersection) [W m-2] |
Model Period Mean (complement) [W m-2] |
Benchmark Period Mean (complement) [W m-2] |
Bias [W m-2] |
RMSE [W m-2] |
Phase Shift [months] |
Bias Score [1] |
RMSE Score [1] |
Seasonal Cycle Score [1] |
Spatial Distribution Score [1] |
Overall Score [1] |
|||
|---|---|---|---|---|---|---|---|---|---|---|---|---|---|---|---|---|
| Benchmark | [-] | 47.4 | ||||||||||||||
| CESM3_092H | [-] | 57.2 | 56.2 | 47.4 | 60.1 | 8.95 | 19.7 | 0.965 | 0.376 | 0.468 | 0.891 | 0.913 | 0.623 | |||
| CESM3_098bH | [-] | 51.9 | 50.8 | 47.4 | 55.2 | 3.56 | 18.4 | 1.02 | 0.418 | 0.484 | 0.883 | 0.860 | 0.626 | |||
| CMIP6_001 | [-] | 61.7 | 60.0 | 47.4 | 66.5 | 47.6 | 12.8 | 21.5 | 1.14 | 0.377 | 0.431 | 0.875 | 0.961 | 0.615 | ||
| LE2_001 | [-] | 60.8 | 59.0 | 47.4 | 65.8 | 47.6 | 11.7 | 21.4 | 1.25 | 0.403 | 0.413 | 0.849 | 0.956 | 0.607 |
Download Data |
Period Mean (original grids) [W m-2] |
Model Period Mean (intersection) [W m-2] |
Benchmark Period Mean (intersection) [W m-2] |
Model Period Mean (complement) [W m-2] |
Benchmark Period Mean (complement) [W m-2] |
Bias [W m-2] |
RMSE [W m-2] |
Phase Shift [months] |
Bias Score [1] |
RMSE Score [1] |
Seasonal Cycle Score [1] |
Spatial Distribution Score [1] |
Overall Score [1] |
|||
|---|---|---|---|---|---|---|---|---|---|---|---|---|---|---|---|---|
| Benchmark | [-] | 21.1 | ||||||||||||||
| CESM3_092H | [-] | 35.0 | 34.9 | 21.1 | 34.9 | 13.9 | 18.3 | 1.71 | 0.152 | 0.485 | 0.760 | 0.696 | 0.516 | |||
| CESM3_098bH | [-] | 31.9 | 31.6 | 21.1 | 32.9 | 10.7 | 14.7 | 1.38 | 0.291 | 0.565 | 0.824 | 0.817 | 0.612 | |||
| CMIP6_001 | [-] | 37.9 | 37.8 | 21.1 | 38.1 | 16.8 | 21.2 | 1.46 | 0.0554 | 0.444 | 0.813 | 0.816 | 0.515 | |||
| LE2_001 | [-] | 37.2 | 37.2 | 21.1 | 37.4 | 16.2 | 20.9 | 1.57 | 0.0740 | 0.426 | 0.796 | 0.799 | 0.504 |
Download Data |
Period Mean (original grids) [W m-2] |
Model Period Mean (intersection) [W m-2] |
Benchmark Period Mean (intersection) [W m-2] |
Model Period Mean (complement) [W m-2] |
Benchmark Period Mean (complement) [W m-2] |
Bias [W m-2] |
RMSE [W m-2] |
Phase Shift [months] |
Bias Score [1] |
RMSE Score [1] |
Seasonal Cycle Score [1] |
Spatial Distribution Score [1] |
Overall Score [1] |
|||
|---|---|---|---|---|---|---|---|---|---|---|---|---|---|---|---|---|
| Benchmark | [-] | 16.1 | ||||||||||||||
| CESM3_092H | [-] | 19.8 | 19.8 | 16.1 | 20.1 | 3.74 | 10.8 | 0.818 | 0.641 | 0.592 | 0.919 | 0.948 | 0.738 | |||
| CESM3_098bH | [-] | 19.0 | 18.9 | 16.1 | 19.6 | 2.81 | 10.5 | 1.00 | 0.674 | 0.601 | 0.894 | 0.952 | 0.744 | |||
| CMIP6_001 | [-] | 26.9 | 26.7 | 16.1 | 27.8 | 10.5 | 15.9 | 1.14 | 0.355 | 0.518 | 0.876 | 0.774 | 0.608 | |||
| LE2_001 | [-] | 26.7 | 26.4 | 16.1 | 27.6 | 10.2 | 15.5 | 0.906 | 0.377 | 0.531 | 0.901 | 0.750 | 0.618 |
Download Data |
Period Mean (original grids) [W m-2] |
Model Period Mean (intersection) [W m-2] |
Benchmark Period Mean (intersection) [W m-2] |
Model Period Mean (complement) [W m-2] |
Benchmark Period Mean (complement) [W m-2] |
Bias [W m-2] |
RMSE [W m-2] |
Phase Shift [months] |
Bias Score [1] |
RMSE Score [1] |
Seasonal Cycle Score [1] |
Spatial Distribution Score [1] |
Overall Score [1] |
|||
|---|---|---|---|---|---|---|---|---|---|---|---|---|---|---|---|---|
| Benchmark | [-] | 39.8 | ||||||||||||||
| CESM3_092H | [-] | 45.7 | 45.9 | 39.8 | 47.8 | 6.19 | 12.4 | 0.812 | 0.479 | 0.551 | 0.922 | 0.955 | 0.692 | |||
| CESM3_098bH | [-] | 42.8 | 42.8 | 39.8 | 47.2 | 3.09 | 11.1 | 0.814 | 0.556 | 0.587 | 0.924 | 0.901 | 0.711 | |||
| CMIP6_001 | [-] | 47.7 | 47.8 | 39.8 | 52.2 | 34.1 | 8.13 | 14.3 | 0.900 | 0.415 | 0.493 | 0.904 | 0.982 | 0.657 | ||
| LE2_001 | [-] | 46.7 | 46.8 | 39.8 | 51.1 | 34.1 | 7.13 | 13.7 | 0.882 | 0.464 | 0.505 | 0.910 | 0.982 | 0.673 |
Download Data |
Period Mean (original grids) [W m-2] |
Model Period Mean (intersection) [W m-2] |
Benchmark Period Mean (intersection) [W m-2] |
Model Period Mean (complement) [W m-2] |
Benchmark Period Mean (complement) [W m-2] |
Bias [W m-2] |
RMSE [W m-2] |
Phase Shift [months] |
Bias Score [1] |
RMSE Score [1] |
Seasonal Cycle Score [1] |
Spatial Distribution Score [1] |
Overall Score [1] |
|||
|---|---|---|---|---|---|---|---|---|---|---|---|---|---|---|---|---|
| Benchmark | [-] | 24.3 | ||||||||||||||
| CESM3_092H | [-] | 46.9 | 46.1 | 24.3 | 58.5 | 22.1 | 26.4 | 1.53 | 0.174 | 0.502 | 0.795 | 0.704 | 0.535 | |||
| CESM3_098bH | [-] | 43.7 | 42.9 | 24.3 | 55.1 | 18.9 | 23.3 | 1.51 | 0.242 | 0.528 | 0.802 | 0.772 | 0.574 | |||
| CMIP6_001 | [-] | 43.1 | 42.6 | 24.3 | 52.7 | 28.4 | 18.5 | 23.8 | 1.49 | 0.196 | 0.505 | 0.801 | 0.930 | 0.588 | ||
| LE2_001 | [-] | 43.6 | 43.2 | 24.3 | 52.0 | 28.4 | 19.0 | 24.4 | 1.50 | 0.180 | 0.495 | 0.793 | 0.946 | 0.582 |
Download Data |
Period Mean (original grids) [W m-2] |
Model Period Mean (intersection) [W m-2] |
Benchmark Period Mean (intersection) [W m-2] |
Model Period Mean (complement) [W m-2] |
Benchmark Period Mean (complement) [W m-2] |
Bias [W m-2] |
RMSE [W m-2] |
Phase Shift [months] |
Bias Score [1] |
RMSE Score [1] |
Seasonal Cycle Score [1] |
Spatial Distribution Score [1] |
Overall Score [1] |
|||
|---|---|---|---|---|---|---|---|---|---|---|---|---|---|---|---|---|
| Benchmark | [-] | 44.4 | ||||||||||||||
| CESM3_092H | [-] | 53.6 | 53.8 | 44.4 | 51.1 | 9.40 | 17.0 | 1.03 | 0.469 | 0.549 | 0.890 | 0.971 | 0.686 | |||
| CESM3_098bH | [-] | 54.4 | 54.5 | 44.4 | 53.7 | 10.1 | 17.0 | 0.919 | 0.453 | 0.582 | 0.907 | 0.918 | 0.688 | |||
| CMIP6_001 | [-] | 55.1 | 55.1 | 44.4 | 54.2 | 10.7 | 17.2 | 0.972 | 0.440 | 0.560 | 0.892 | 0.950 | 0.680 | |||
| LE2_001 | [-] | 55.7 | 55.8 | 44.4 | 53.8 | 11.3 | 17.9 | 1.01 | 0.401 | 0.557 | 0.887 | 0.948 | 0.670 |
Download Data |
Period Mean (original grids) [W m-2] |
Model Period Mean (intersection) [W m-2] |
Benchmark Period Mean (intersection) [W m-2] |
Model Period Mean (complement) [W m-2] |
Benchmark Period Mean (complement) [W m-2] |
Bias [W m-2] |
RMSE [W m-2] |
Phase Shift [months] |
Bias Score [1] |
RMSE Score [1] |
Seasonal Cycle Score [1] |
Spatial Distribution Score [1] |
Overall Score [1] |
|||
|---|---|---|---|---|---|---|---|---|---|---|---|---|---|---|---|---|
| Benchmark | [-] | 56.8 | ||||||||||||||
| CESM3_092H | [-] | 51.4 | 52.9 | 56.8 | 42.1 | -3.56 | 18.9 | 0.728 | 0.334 | 0.318 | 0.934 | 0.936 | 0.568 | |||
| CESM3_098bH | [-] | 49.6 | 51.1 | 56.8 | 39.4 | -5.38 | 18.9 | 0.641 | 0.341 | 0.308 | 0.943 | 0.950 | 0.570 | |||
| CMIP6_001 | [-] | 61.0 | 61.6 | 56.9 | 56.1 | 33.0 | 4.66 | 18.0 | 0.833 | 0.405 | 0.354 | 0.921 | 0.972 | 0.601 | ||
| LE2_001 | [-] | 60.1 | 60.6 | 56.9 | 55.8 | 33.0 | 3.73 | 16.8 | 0.620 | 0.421 | 0.401 | 0.941 | 0.976 | 0.628 |
Temporally integrated period mean