Mean State
Download Data |
Period Mean (original grids) [W m-2] |
Bias [W m-2] |
RMSE [W m-2] |
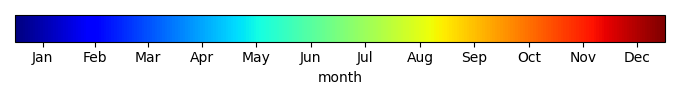
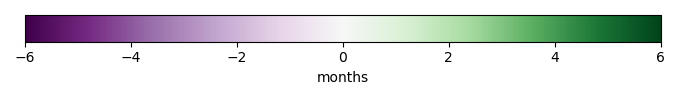
Phase Shift [months] |
Bias Score [1] |
RMSE Score [1] |
Seasonal Cycle Score [1] |
Overall Score [1] |
|||
|---|---|---|---|---|---|---|---|---|---|---|---|
| Benchmark | [-] | 32.5 | |||||||||
| CESM3_092H | [-] | 24.3 | -8.22 | 16.8 | 2.02 | 0.525 | 0.471 | 0.659 | 0.531 | ||
| CESM3_098bH | [-] | 18.9 | -13.6 | 19.1 | 2.02 | 0.252 | 0.424 | 0.659 | 0.440 | ||
| CMIP6_001 | [-] | 39.5 | 6.95 | 16.6 | 2.04 | 0.722 | 0.500 | 0.521 | 0.561 | ||
| LE2_001 | [-] | 39.3 | 6.75 | 16.7 | 2.04 | 0.732 | 0.502 | 0.521 | 0.565 |
Download Data |
Period Mean (original grids) [W m-2] |
Bias [W m-2] |
RMSE [W m-2] |
Phase Shift [months] |
Bias Score [1] |
RMSE Score [1] |
Seasonal Cycle Score [1] |
Overall Score [1] |
|||
|---|---|---|---|---|---|---|---|---|---|---|---|
| Benchmark | [-] | 50.6 | |||||||||
| CESM3_092H | [-] | 62.3 | 11.7 | 20.9 | 0.508 | 0.265 | 0.247 | 0.968 | 0.432 | ||
| CESM3_098bH | [-] | 53.5 | 2.94 | 18.0 | 0.508 | 0.821 | 0.230 | 0.968 | 0.563 | ||
| CMIP6_001 | [-] | 65.1 | 14.5 | 25.0 | 1.02 | 0.291 | 0.181 | 0.882 | 0.384 | ||
| LE2_001 | [-] | 64.4 | 13.8 | 23.2 | 1.02 | 0.304 | 0.218 | 0.882 | 0.405 |
Download Data |
Period Mean (original grids) [W m-2] |
Bias [W m-2] |
RMSE [W m-2] |
Phase Shift [months] |
Bias Score [1] |
RMSE Score [1] |
Seasonal Cycle Score [1] |
Overall Score [1] |
|||
|---|---|---|---|---|---|---|---|---|---|---|---|
| Benchmark | [-] | 47.7 | |||||||||
| CESM3_092H | [-] | 68.7 | 21.0 | 43.7 | 0.00 | 0.00 | 0.00 | 1.00 | 0.250 | ||
| CESM3_098bH | [-] | 64.7 | 16.9 | 38.9 | 0.00 | 0.131 | 0.00 | 1.00 | 0.283 | ||
| CMIP6_001 | [-] | 66.8 | 19.1 | 41.1 | 0.00 | 0.0234 | 0.00 | 1.00 | 0.256 | ||
| LE2_001 | [-] | 65.7 | 18.0 | 41.3 | 0.00 | 0.0778 | 0.00 | 1.00 | 0.269 |
Download Data |
Period Mean (original grids) [W m-2] |
Bias [W m-2] |
RMSE [W m-2] |
Phase Shift [months] |
Bias Score [1] |
RMSE Score [1] |
Seasonal Cycle Score [1] |
Overall Score [1] |
|||
|---|---|---|---|---|---|---|---|---|---|---|---|
| Benchmark | [-] | 13.8 | |||||||||
| CESM3_092H | [-] | 4.22 | -9.67 | 19.0 | 0.508 | 0.415 | 0.337 | 0.969 | 0.515 | ||
| CESM3_098bH | [-] | 2.76 | -10.8 | 17.3 | 0.508 | 0.344 | 0.414 | 0.970 | 0.535 | ||
| CMIP6_001 | [-] | 6.80 | -6.97 | 16.2 | 0.508 | 0.581 | 0.399 | 0.969 | 0.587 | ||
| LE2_001 | [-] | 5.99 | -7.78 | 17.1 | 1.02 | 0.531 | 0.378 | 0.933 | 0.555 |
Download Data |
Period Mean (original grids) [W m-2] |
Bias [W m-2] |
RMSE [W m-2] |
Phase Shift [months] |
Bias Score [1] |
RMSE Score [1] |
Seasonal Cycle Score [1] |
Overall Score [1] |
|||
|---|---|---|---|---|---|---|---|---|---|---|---|
| Benchmark | [-] | 45.2 | |||||||||
| CESM3_092H | [-] | 28.1 | -17.1 | 19.4 | 0.983 | 0.123 | 0.542 | 0.937 | 0.536 | ||
| CESM3_098bH | [-] | 24.4 | -20.8 | 23.2 | 0.983 | 0.00 | 0.561 | 0.937 | 0.514 | ||
| CMIP6_001 | [-] | 33.9 | -11.3 | 19.7 | 0.983 | 0.421 | 0.400 | 0.937 | 0.540 | ||
| LE2_001 | [-] | 34.7 | -10.5 | 20.6 | 0.983 | 0.461 | 0.399 | 0.937 | 0.549 |
Download Data |
Period Mean (original grids) [W m-2] |
Bias [W m-2] |
RMSE [W m-2] |
Phase Shift [months] |
Bias Score [1] |
RMSE Score [1] |
Seasonal Cycle Score [1] |
Overall Score [1] |
|||
|---|---|---|---|---|---|---|---|---|---|---|---|
| Benchmark | [-] | 22.3 | |||||||||
| CESM3_092H | [-] | 11.7 | -10.7 | 22.0 | 0.508 | 0.258 | 0.112 | 0.968 | 0.363 | ||
| CESM3_098bH | [-] | 11.0 | -11.1 | 22.5 | 1.02 | 0.239 | 0.0981 | 0.933 | 0.342 | ||
| CMIP6_001 | [-] | 15.0 | -7.28 | 23.5 | 1.02 | 0.509 | 0.0231 | 0.933 | 0.372 | ||
| LE2_001 | [-] | 15.5 | -6.74 | 22.8 | 0.508 | 0.540 | 0.0525 | 0.967 | 0.403 |
Download Data |
Period Mean (original grids) [W m-2] |
Bias [W m-2] |
RMSE [W m-2] |
Phase Shift [months] |
Bias Score [1] |
RMSE Score [1] |
Seasonal Cycle Score [1] |
Overall Score [1] |
|||
|---|---|---|---|---|---|---|---|---|---|---|---|
| Benchmark | [-] | 26.9 | |||||||||
| CESM3_092H | [-] | 29.8 | 2.89 | 20.5 | 1.61 | 0.456 | 0.327 | 0.760 | 0.467 | ||
| CESM3_098bH | [-] | 28.1 | 1.14 | 19.5 | 1.61 | 0.474 | 0.307 | 0.778 | 0.466 | ||
| CMIP6_001 | [-] | 35.5 | 8.51 | 21.7 | 0.844 | 0.371 | 0.326 | 0.919 | 0.486 | ||
| LE2_001 | [-] | 34.7 | 7.74 | 21.3 | 1.10 | 0.365 | 0.347 | 0.902 | 0.490 |
Download Data |
Period Mean (original grids) [W m-2] |
Bias [W m-2] |
RMSE [W m-2] |
Phase Shift [months] |
Bias Score [1] |
RMSE Score [1] |
Seasonal Cycle Score [1] |
Overall Score [1] |
|||
|---|---|---|---|---|---|---|---|---|---|---|---|
| Benchmark | [-] | 52.4 | |||||||||
| CESM3_092H | [-] | 56.4 | 4.59 | 29.1 | 0.927 | 0.384 | 0.0922 | 0.935 | 0.376 | ||
| CESM3_098bH | [-] | 52.9 | -0.216 | 28.8 | 0.880 | 0.358 | 0.141 | 0.952 | 0.398 | ||
| CMIP6_001 | [-] | 59.6 | 6.33 | 31.6 | 1.02 | 0.327 | 0.0648 | 0.904 | 0.340 | ||
| LE2_001 | [-] | 61.6 | 8.34 | 31.5 | 1.11 | 0.319 | 0.0990 | 0.897 | 0.354 |
Download Data |
Period Mean (original grids) [W m-2] |
Bias [W m-2] |
RMSE [W m-2] |
Phase Shift [months] |
Bias Score [1] |
RMSE Score [1] |
Seasonal Cycle Score [1] |
Overall Score [1] |
|||
|---|---|---|---|---|---|---|---|---|---|---|---|
| Benchmark | [-] | 22.1 | |||||||||
| CESM3_092H | [-] | 24.3 | 1.91 | 24.3 | 1.22 | 0.346 | 0.0905 | 0.888 | 0.354 | ||
| CESM3_098bH | [-] | 22.3 | -0.182 | 23.9 | 1.17 | 0.321 | 0.0876 | 0.892 | 0.347 | ||
| CMIP6_001 | [-] | 28.3 | 6.20 | 25.6 | 1.27 | 0.305 | 0.0825 | 0.878 | 0.337 | ||
| LE2_001 | [-] | 28.9 | 6.73 | 26.1 | 1.17 | 0.292 | 0.0757 | 0.881 | 0.331 |
Download Data |
Period Mean (original grids) [W m-2] |
Bias [W m-2] |
RMSE [W m-2] |
Phase Shift [months] |
Bias Score [1] |
RMSE Score [1] |
Seasonal Cycle Score [1] |
Overall Score [1] |
|||
|---|---|---|---|---|---|---|---|---|---|---|---|
| Benchmark | [-] | 30.6 | |||||||||
| CESM3_092H | [-] | 32.6 | 1.92 | 25.7 | 1.03 | 0.377 | 0.126 | 0.890 | 0.380 | ||
| CESM3_098bH | [-] | 30.3 | -0.475 | 24.9 | 1.04 | 0.364 | 0.138 | 0.895 | 0.384 | ||
| CMIP6_001 | [-] | 36.1 | 5.49 | 26.7 | 1.04 | 0.380 | 0.111 | 0.881 | 0.371 | ||
| LE2_001 | [-] | 36.3 | 5.67 | 26.6 | 0.978 | 0.378 | 0.119 | 0.887 | 0.376 |
Download Data |
Period Mean (original grids) [W m-2] |
Bias [W m-2] |
RMSE [W m-2] |
Phase Shift [months] |
Bias Score [1] |
RMSE Score [1] |
Seasonal Cycle Score [1] |
Overall Score [1] |
|||
|---|---|---|---|---|---|---|---|---|---|---|---|
| Benchmark | [-] | 4.91 | |||||||||
| CESM3_092H | [-] | 2.61 | -2.39 | 15.6 | 0.678 | 0.349 | 0.509 | 0.944 | 0.578 | ||
| CESM3_098bH | [-] | 2.01 | -2.72 | 16.0 | 0.678 | 0.366 | 0.506 | 0.945 | 0.581 | ||
| CMIP6_001 | [-] | 5.14 | 0.229 | 17.2 | 0.678 | 0.630 | 0.545 | 0.944 | 0.666 | ||
| LE2_001 | [-] | 3.82 | -1.09 | 16.5 | 0.678 | 0.575 | 0.565 | 0.944 | 0.662 |
Download Data |
Period Mean (original grids) [W m-2] |
Bias [W m-2] |
RMSE [W m-2] |
Phase Shift [months] |
Bias Score [1] |
RMSE Score [1] |
Seasonal Cycle Score [1] |
Overall Score [1] |
|||
|---|---|---|---|---|---|---|---|---|---|---|---|
| Benchmark | [-] | 32.1 | |||||||||
| CESM3_092H | [-] | 30.0 | -2.02 | 16.9 | 1.02 | 0.897 | 0.275 | 0.933 | 0.595 | ||
| CESM3_098bH | [-] | 28.3 | -3.80 | 16.7 | 1.02 | 0.807 | 0.305 | 0.933 | 0.588 | ||
| CMIP6_001 | [-] | 37.3 | 5.22 | 15.0 | 0.00 | 0.735 | 0.375 | 1.00 | 0.621 | ||
| LE2_001 | [-] | 37.7 | 5.67 | 17.3 | 0.00 | 0.713 | 0.314 | 1.00 | 0.585 |
Download Data |
Period Mean (original grids) [W m-2] |
Bias [W m-2] |
RMSE [W m-2] |
Phase Shift [months] |
Bias Score [1] |
RMSE Score [1] |
Seasonal Cycle Score [1] |
Overall Score [1] |
|||
|---|---|---|---|---|---|---|---|---|---|---|---|
| Benchmark | [-] | 30.5 | |||||||||
| CESM3_092H | [-] | 29.7 | -0.922 | 25.7 | 1.34 | 0.337 | 0.0864 | 0.772 | 0.320 | ||
| CESM3_098bH | [-] | 27.8 | -2.76 | 24.7 | 1.12 | 0.357 | 0.0960 | 0.798 | 0.337 | ||
| CMIP6_001 | [-] | 32.3 | 1.79 | 27.3 | 1.29 | 0.324 | 0.0680 | 0.759 | 0.305 | ||
| LE2_001 | [-] | 32.1 | 1.54 | 27.0 | 1.15 | 0.325 | 0.0680 | 0.783 | 0.311 |
Download Data |
Period Mean (original grids) [W m-2] |
Bias [W m-2] |
RMSE [W m-2] |
Phase Shift [months] |
Bias Score [1] |
RMSE Score [1] |
Seasonal Cycle Score [1] |
Overall Score [1] |
|||
|---|---|---|---|---|---|---|---|---|---|---|---|
| Benchmark | [-] | 31.8 | |||||||||
| CESM3_092H | [-] | 19.5 | -12.3 | 22.5 | 0.0678 | 0.256 | 0.216 | 0.995 | 0.421 | ||
| CESM3_098bH | [-] | 18.7 | -13.0 | 23.4 | 0.610 | 0.236 | 0.188 | 0.932 | 0.386 | ||
| CMIP6_001 | [-] | 28.9 | -2.90 | 20.6 | 0.678 | 0.581 | 0.165 | 0.946 | 0.464 | ||
| LE2_001 | [-] | 28.7 | -3.13 | 19.7 | 0.203 | 0.573 | 0.209 | 0.985 | 0.494 |
Download Data |
Period Mean (original grids) [W m-2] |
Bias [W m-2] |
RMSE [W m-2] |
Phase Shift [months] |
Bias Score [1] |
RMSE Score [1] |
Seasonal Cycle Score [1] |
Overall Score [1] |
|||
|---|---|---|---|---|---|---|---|---|---|---|---|
| Benchmark | [-] | 38.7 | |||||||||
| CESM3_092H | [-] | 47.9 | 8.96 | 29.3 | 0.763 | 0.529 | 0.105 | 0.944 | 0.421 | ||
| CESM3_098bH | [-] | 44.1 | 5.64 | 27.1 | 0.944 | 0.468 | 0.130 | 0.944 | 0.418 | ||
| CMIP6_001 | [-] | 50.5 | 11.8 | 30.3 | 0.764 | 0.529 | 0.0977 | 0.941 | 0.416 | ||
| LE2_001 | [-] | 50.1 | 11.4 | 29.8 | 0.837 | 0.544 | 0.0866 | 0.936 | 0.413 |
Download Data |
Period Mean (original grids) [W m-2] |
Bias [W m-2] |
RMSE [W m-2] |
Phase Shift [months] |
Bias Score [1] |
RMSE Score [1] |
Seasonal Cycle Score [1] |
Overall Score [1] |
|||
|---|---|---|---|---|---|---|---|---|---|---|---|
| Benchmark | [-] | 20.8 | |||||||||
| CESM3_092H | [-] | 61.4 | 40.6 | 51.6 | 1.02 | 0.00 | 0.00484 | 0.933 | 0.236 | ||
| CESM3_098bH | [-] | 60.6 | 39.6 | 47.5 | 1.02 | 0.00 | 0.0143 | 0.933 | 0.240 | ||
| CMIP6_001 | [-] | 57.3 | 36.5 | 43.0 | 0.339 | 0.00 | 0.172 | 0.977 | 0.330 | ||
| LE2_001 | [-] | 56.4 | 35.7 | 41.7 | 0.339 | 0.00 | 0.189 | 0.977 | 0.339 |
Download Data |
Period Mean (original grids) [W m-2] |
Bias [W m-2] |
RMSE [W m-2] |
Phase Shift [months] |
Bias Score [1] |
RMSE Score [1] |
Seasonal Cycle Score [1] |
Overall Score [1] |
|||
|---|---|---|---|---|---|---|---|---|---|---|---|
| Benchmark | [-] | -10.2 | |||||||||
| CESM3_092H | [-] | 34.7 | 45.0 | 54.4 | 1.03 | -0.00 | -0.00 | 0.930 | 0.233 | ||
| CESM3_098bH | [-] | 33.3 | 43.5 | 56.7 | 1.03 | -0.00 | -0.00 | 0.930 | 0.233 | ||
| CMIP6_001 | [-] | 34.0 | 44.2 | 55.1 | 1.03 | -0.00 | -0.00 | 0.930 | 0.233 | ||
| LE2_001 | [-] | 30.1 | 40.4 | 50.8 | 0.00 | -0.00 | -0.00 | 1.00 | 0.250 |
Download Data |
Period Mean (original grids) [W m-2] |
Bias [W m-2] |
RMSE [W m-2] |
Phase Shift [months] |
Bias Score [1] |
RMSE Score [1] |
Seasonal Cycle Score [1] |
Overall Score [1] |
|||
|---|---|---|---|---|---|---|---|---|---|---|---|
| Benchmark | [-] | 83.9 | |||||||||
| CESM3_092H | [-] | 62.2 | -21.8 | 43.0 | 1.03 | 0.00 | 0.00 | 0.930 | 0.233 | ||
| CESM3_098bH | [-] | 63.4 | -20.6 | 40.2 | 1.03 | 0.00 | 0.00 | 0.930 | 0.233 | ||
| CMIP6_001 | [-] | 57.9 | -26.0 | 39.5 | 1.03 | 0.00 | 0.00 | 0.930 | 0.233 | ||
| LE2_001 | [-] | 58.9 | -25.0 | 40.4 | 1.03 | 0.00 | 0.00 | 0.930 | 0.233 |
Temporally integrated period mean