Mean State
Download Data |
Period Mean (original grids) [1] |
Model Period Mean (intersection) [1] |
Benchmark Period Mean (intersection) [1] |
Model Period Mean (complement) [1] |
Benchmark Period Mean (complement) [1] |
Bias [1] |
RMSE [1] |
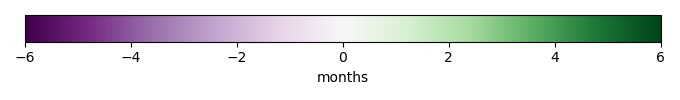
Phase Shift [months] |
Bias Score [1] |
RMSE Score [1] |
Seasonal Cycle Score [1] |
Spatial Distribution Score [1] |
Overall Score [1] |
|||
|---|---|---|---|---|---|---|---|---|---|---|---|---|---|---|---|---|
| Benchmark | [-] | 0.175 | ||||||||||||||
| CESM3_092H | [-] | 0.181 | 0.180 | 0.177 | 0.0601 | 0.00252 | 0.0348 | 3.06 | 0.478 | 0.612 | 0.501 | 0.808 | 0.602 | |||
| CESM3_098bH | [-] | 0.183 | 0.182 | 0.177 | 0.0601 | 0.00520 | 0.0352 | 3.11 | 0.477 | 0.593 | 0.486 | 0.812 | 0.592 | |||
| CMIP6_001 | [-] | 0.155 | 0.155 | 0.181 | 0.0670 | -0.0262 | 0.0439 | 3.28 | 0.273 | 0.607 | 0.470 | 0.972 | 0.586 | |||
| LE2_001 | [-] | 0.155 | 0.154 | 0.181 | 0.0670 | -0.0266 | 0.0442 | 3.28 | 0.270 | 0.604 | 0.469 | 0.969 | 0.583 |
Download Data |
Period Mean (original grids) [1] |
Model Period Mean (intersection) [1] |
Benchmark Period Mean (intersection) [1] |
Model Period Mean (complement) [1] |
Benchmark Period Mean (complement) [1] |
Bias [1] |
RMSE [1] |
Phase Shift [months] |
Bias Score [1] |
RMSE Score [1] |
Seasonal Cycle Score [1] |
Spatial Distribution Score [1] |
Overall Score [1] |
|||
|---|---|---|---|---|---|---|---|---|---|---|---|---|---|---|---|---|
| Benchmark | [-] | 0.215 | ||||||||||||||
| CESM3_092H | [-] | 0.185 | 0.186 | 0.215 | 0.0522 | -0.0292 | 0.0464 | 2.94 | 0.359 | 0.505 | 0.527 | 0.920 | 0.563 | |||
| CESM3_098bH | [-] | 0.188 | 0.189 | 0.215 | 0.0522 | -0.0267 | 0.0450 | 2.91 | 0.392 | 0.492 | 0.535 | 0.898 | 0.562 | |||
| CMIP6_001 | [-] | 0.191 | 0.193 | 0.217 | 0.0596 | -0.0242 | 0.0467 | 3.91 | 0.367 | 0.452 | 0.321 | 0.988 | 0.516 | |||
| LE2_001 | [-] | 0.191 | 0.192 | 0.217 | 0.0596 | -0.0245 | 0.0469 | 3.81 | 0.364 | 0.453 | 0.341 | 0.988 | 0.520 |
Download Data |
Period Mean (original grids) [1] |
Model Period Mean (intersection) [1] |
Benchmark Period Mean (intersection) [1] |
Model Period Mean (complement) [1] |
Benchmark Period Mean (complement) [1] |
Bias [1] |
RMSE [1] |
Phase Shift [months] |
Bias Score [1] |
RMSE Score [1] |
Seasonal Cycle Score [1] |
Spatial Distribution Score [1] |
Overall Score [1] |
|||
|---|---|---|---|---|---|---|---|---|---|---|---|---|---|---|---|---|
| Benchmark | [-] | 0.168 | ||||||||||||||
| CESM3_092H | [-] | 0.166 | 0.166 | 0.170 | 0.0593 | -0.00391 | 0.0400 | 3.45 | 0.395 | 0.495 | 0.411 | 0.633 | 0.486 | |||
| CESM3_098bH | [-] | 0.167 | 0.167 | 0.170 | 0.0593 | -0.00314 | 0.0399 | 3.43 | 0.400 | 0.500 | 0.421 | 0.637 | 0.492 | |||
| CMIP6_001 | [-] | 0.155 | 0.155 | 0.173 | 0.0703 | -0.0182 | 0.0451 | 3.70 | 0.279 | 0.485 | 0.365 | 0.811 | 0.485 | |||
| LE2_001 | [-] | 0.154 | 0.154 | 0.173 | 0.0703 | -0.0190 | 0.0455 | 3.64 | 0.273 | 0.491 | 0.372 | 0.797 | 0.485 |
Download Data |
Period Mean (original grids) [1] |
Model Period Mean (intersection) [1] |
Benchmark Period Mean (intersection) [1] |
Model Period Mean (complement) [1] |
Benchmark Period Mean (complement) [1] |
Bias [1] |
RMSE [1] |
Phase Shift [months] |
Bias Score [1] |
RMSE Score [1] |
Seasonal Cycle Score [1] |
Spatial Distribution Score [1] |
Overall Score [1] |
|||
|---|---|---|---|---|---|---|---|---|---|---|---|---|---|---|---|---|
| Benchmark | [-] | 0.281 | ||||||||||||||
| CESM3_092H | [-] | 0.368 | 0.369 | 0.280 | 0.301 | 0.0879 | 0.176 | 1.74 | 0.569 | 0.408 | 0.788 | 0.963 | 0.627 | |||
| CESM3_098bH | [-] | 0.360 | 0.360 | 0.280 | 0.301 | 0.0797 | 0.170 | 1.67 | 0.596 | 0.408 | 0.800 | 0.977 | 0.638 | |||
| CMIP6_001 | [-] | 0.400 | 0.400 | 0.281 | 0.273 | 0.117 | 0.211 | 1.50 | 0.519 | 0.380 | 0.836 | 0.643 | 0.551 | |||
| LE2_001 | [-] | 0.408 | 0.407 | 0.281 | 0.273 | 0.124 | 0.214 | 1.47 | 0.496 | 0.381 | 0.842 | 0.654 | 0.551 |
Download Data |
Period Mean (original grids) [1] |
Model Period Mean (intersection) [1] |
Benchmark Period Mean (intersection) [1] |
Model Period Mean (complement) [1] |
Benchmark Period Mean (complement) [1] |
Bias [1] |
RMSE [1] |
Phase Shift [months] |
Bias Score [1] |
RMSE Score [1] |
Seasonal Cycle Score [1] |
Spatial Distribution Score [1] |
Overall Score [1] |
|||
|---|---|---|---|---|---|---|---|---|---|---|---|---|---|---|---|---|
| Benchmark | [-] | 0.113 | ||||||||||||||
| CESM3_092H | [-] | 0.168 | 0.168 | 0.116 | 0.0617 | 0.0521 | 0.0554 | 2.88 | 0.375 | 0.679 | 0.533 | 0.0948 | 0.472 | |||
| CESM3_098bH | [-] | 0.168 | 0.168 | 0.116 | 0.0617 | 0.0523 | 0.0556 | 2.90 | 0.374 | 0.677 | 0.532 | 0.0917 | 0.470 | |||
| CMIP6_001 | [-] | 0.136 | 0.136 | 0.126 | 0.0694 | 0.00997 | 0.0421 | 2.87 | 0.354 | 0.709 | 0.533 | 0.0170 | 0.464 | |||
| LE2_001 | [-] | 0.136 | 0.136 | 0.126 | 0.0694 | 0.0101 | 0.0422 | 2.88 | 0.354 | 0.707 | 0.534 | 0.0194 | 0.465 |
Download Data |
Period Mean (original grids) [1] |
Model Period Mean (intersection) [1] |
Benchmark Period Mean (intersection) [1] |
Model Period Mean (complement) [1] |
Benchmark Period Mean (complement) [1] |
Bias [1] |
RMSE [1] |
Phase Shift [months] |
Bias Score [1] |
RMSE Score [1] |
Seasonal Cycle Score [1] |
Spatial Distribution Score [1] |
Overall Score [1] |
|||
|---|---|---|---|---|---|---|---|---|---|---|---|---|---|---|---|---|
| Benchmark | [-] | 0.170 | ||||||||||||||
| CESM3_092H | [-] | 0.212 | 0.211 | 0.170 | 0.141 | 0.0413 | 0.0927 | 1.25 | 0.575 | 0.424 | 0.866 | 0.994 | 0.656 | |||
| CESM3_098bH | [-] | 0.209 | 0.209 | 0.170 | 0.141 | 0.0385 | 0.0913 | 1.27 | 0.595 | 0.425 | 0.860 | 0.994 | 0.660 | |||
| CMIP6_001 | [-] | 0.196 | 0.195 | 0.170 | 0.125 | 0.0240 | 0.104 | 1.21 | 0.673 | 0.350 | 0.870 | 0.703 | 0.589 | |||
| LE2_001 | [-] | 0.194 | 0.193 | 0.170 | 0.125 | 0.0217 | 0.103 | 1.18 | 0.680 | 0.352 | 0.874 | 0.720 | 0.596 |
Download Data |
Period Mean (original grids) [1] |
Model Period Mean (intersection) [1] |
Benchmark Period Mean (intersection) [1] |
Model Period Mean (complement) [1] |
Benchmark Period Mean (complement) [1] |
Bias [1] |
RMSE [1] |
Phase Shift [months] |
Bias Score [1] |
RMSE Score [1] |
Seasonal Cycle Score [1] |
Spatial Distribution Score [1] |
Overall Score [1] |
|||
|---|---|---|---|---|---|---|---|---|---|---|---|---|---|---|---|---|
| Benchmark | [-] | 0.176 | ||||||||||||||
| CESM3_092H | [-] | 0.206 | 0.206 | 0.176 | 0.0553 | 0.0292 | 0.0598 | 1.47 | 0.613 | 0.583 | 0.785 | 0.980 | 0.709 | |||
| CESM3_098bH | [-] | 0.205 | 0.205 | 0.176 | 0.0553 | 0.0281 | 0.0607 | 1.45 | 0.615 | 0.580 | 0.793 | 0.975 | 0.709 | |||
| CMIP6_001 | [-] | 0.207 | 0.208 | 0.178 | 0.0613 | 0.0293 | 0.0693 | 1.42 | 0.624 | 0.518 | 0.789 | 0.911 | 0.672 | |||
| LE2_001 | [-] | 0.207 | 0.208 | 0.178 | 0.0613 | 0.0294 | 0.0706 | 1.44 | 0.623 | 0.513 | 0.787 | 0.902 | 0.667 |
Download Data |
Period Mean (original grids) [1] |
Model Period Mean (intersection) [1] |
Benchmark Period Mean (intersection) [1] |
Model Period Mean (complement) [1] |
Benchmark Period Mean (complement) [1] |
Bias [1] |
RMSE [1] |
Phase Shift [months] |
Bias Score [1] |
RMSE Score [1] |
Seasonal Cycle Score [1] |
Spatial Distribution Score [1] |
Overall Score [1] |
|||
|---|---|---|---|---|---|---|---|---|---|---|---|---|---|---|---|---|
| Benchmark | [-] | 0.142 | ||||||||||||||
| CESM3_092H | [-] | 0.180 | 0.179 | 0.143 | 0.0584 | 0.0360 | 0.0492 | 3.36 | 0.502 | 0.565 | 0.437 | 0.950 | 0.604 | |||
| CESM3_098bH | [-] | 0.180 | 0.179 | 0.143 | 0.0584 | 0.0360 | 0.0490 | 3.24 | 0.500 | 0.564 | 0.465 | 0.939 | 0.607 | |||
| CMIP6_001 | [-] | 0.163 | 0.163 | 0.148 | 0.0636 | 0.0150 | 0.0463 | 3.71 | 0.526 | 0.573 | 0.363 | 0.908 | 0.588 | |||
| LE2_001 | [-] | 0.164 | 0.164 | 0.148 | 0.0636 | 0.0157 | 0.0470 | 3.70 | 0.526 | 0.573 | 0.366 | 0.891 | 0.586 |
Download Data |
Period Mean (original grids) [1] |
Model Period Mean (intersection) [1] |
Benchmark Period Mean (intersection) [1] |
Model Period Mean (complement) [1] |
Benchmark Period Mean (complement) [1] |
Bias [1] |
RMSE [1] |
Phase Shift [months] |
Bias Score [1] |
RMSE Score [1] |
Seasonal Cycle Score [1] |
Spatial Distribution Score [1] |
Overall Score [1] |
|||
|---|---|---|---|---|---|---|---|---|---|---|---|---|---|---|---|---|
| Benchmark | [-] | 0.307 | ||||||||||||||
| CESM3_092H | [-] | 0.342 | 0.338 | 0.307 | 0.260 | 0.0304 | 0.149 | 2.23 | 0.752 | 0.431 | 0.690 | 0.993 | 0.659 | |||
| CESM3_098bH | [-] | 0.337 | 0.333 | 0.307 | 0.260 | 0.0258 | 0.149 | 2.22 | 0.749 | 0.430 | 0.691 | 0.989 | 0.658 | |||
| CMIP6_001 | [-] | 0.476 | 0.472 | 0.306 | 0.330 | 0.164 | 0.233 | 1.89 | 0.410 | 0.391 | 0.760 | 0.736 | 0.538 | |||
| LE2_001 | [-] | 0.464 | 0.460 | 0.306 | 0.330 | 0.153 | 0.225 | 1.91 | 0.434 | 0.391 | 0.758 | 0.725 | 0.540 |
Download Data |
Period Mean (original grids) [1] |
Model Period Mean (intersection) [1] |
Benchmark Period Mean (intersection) [1] |
Model Period Mean (complement) [1] |
Benchmark Period Mean (complement) [1] |
Bias [1] |
RMSE [1] |
Phase Shift [months] |
Bias Score [1] |
RMSE Score [1] |
Seasonal Cycle Score [1] |
Spatial Distribution Score [1] |
Overall Score [1] |
|||
|---|---|---|---|---|---|---|---|---|---|---|---|---|---|---|---|---|
| Benchmark | [-] | 0.152 | ||||||||||||||
| CESM3_092H | [-] | 0.174 | 0.174 | 0.153 | 0.0596 | 0.0203 | 0.0430 | 2.61 | 0.399 | 0.634 | 0.585 | 0.416 | 0.534 | |||
| CESM3_098bH | [-] | 0.175 | 0.175 | 0.153 | 0.0596 | 0.0212 | 0.0432 | 2.59 | 0.400 | 0.635 | 0.589 | 0.412 | 0.534 | |||
| CMIP6_001 | [-] | 0.165 | 0.165 | 0.159 | 0.0651 | 0.00653 | 0.0373 | 2.53 | 0.416 | 0.621 | 0.597 | 0.729 | 0.597 | |||
| LE2_001 | [-] | 0.166 | 0.166 | 0.159 | 0.0651 | 0.00753 | 0.0377 | 2.73 | 0.420 | 0.601 | 0.560 | 0.752 | 0.587 |
Download Data |
Period Mean (original grids) [1] |
Model Period Mean (intersection) [1] |
Benchmark Period Mean (intersection) [1] |
Model Period Mean (complement) [1] |
Benchmark Period Mean (complement) [1] |
Bias [1] |
RMSE [1] |
Phase Shift [months] |
Bias Score [1] |
RMSE Score [1] |
Seasonal Cycle Score [1] |
Spatial Distribution Score [1] |
Overall Score [1] |
|||
|---|---|---|---|---|---|---|---|---|---|---|---|---|---|---|---|---|
| Benchmark | [-] | 0.146 | ||||||||||||||
| CESM3_092H | [-] | 0.177 | 0.177 | 0.147 | 0.0654 | 0.0299 | 0.0671 | 2.09 | 0.569 | 0.523 | 0.679 | 0.842 | 0.627 | |||
| CESM3_098bH | [-] | 0.175 | 0.176 | 0.147 | 0.0654 | 0.0286 | 0.0653 | 2.04 | 0.574 | 0.529 | 0.683 | 0.791 | 0.621 | |||
| CMIP6_001 | [-] | 0.166 | 0.166 | 0.154 | 0.0654 | 0.0129 | 0.0620 | 2.00 | 0.594 | 0.500 | 0.695 | 0.904 | 0.639 | |||
| LE2_001 | [-] | 0.165 | 0.166 | 0.154 | 0.0654 | 0.0126 | 0.0622 | 1.97 | 0.593 | 0.498 | 0.700 | 0.910 | 0.640 |
Download Data |
Period Mean (original grids) [1] |
Model Period Mean (intersection) [1] |
Benchmark Period Mean (intersection) [1] |
Model Period Mean (complement) [1] |
Benchmark Period Mean (complement) [1] |
Bias [1] |
RMSE [1] |
Phase Shift [months] |
Bias Score [1] |
RMSE Score [1] |
Seasonal Cycle Score [1] |
Spatial Distribution Score [1] |
Overall Score [1] |
|||
|---|---|---|---|---|---|---|---|---|---|---|---|---|---|---|---|---|
| Benchmark | [-] | 0.235 | ||||||||||||||
| CESM3_092H | [-] | 0.278 | 0.278 | 0.236 | 0.0864 | 0.0418 | 0.0758 | 2.26 | 0.462 | 0.556 | 0.645 | 0.982 | 0.640 | |||
| CESM3_098bH | [-] | 0.277 | 0.277 | 0.236 | 0.0864 | 0.0405 | 0.0749 | 2.19 | 0.469 | 0.556 | 0.658 | 0.982 | 0.644 | |||
| CMIP6_001 | [-] | 0.280 | 0.280 | 0.241 | 0.106 | 0.0389 | 0.0796 | 2.35 | 0.475 | 0.536 | 0.626 | 0.965 | 0.628 | |||
| LE2_001 | [-] | 0.279 | 0.280 | 0.241 | 0.106 | 0.0385 | 0.0798 | 2.33 | 0.475 | 0.533 | 0.628 | 0.965 | 0.627 |
Download Data |
Period Mean (original grids) [1] |
Model Period Mean (intersection) [1] |
Benchmark Period Mean (intersection) [1] |
Model Period Mean (complement) [1] |
Benchmark Period Mean (complement) [1] |
Bias [1] |
RMSE [1] |
Phase Shift [months] |
Bias Score [1] |
RMSE Score [1] |
Seasonal Cycle Score [1] |
Spatial Distribution Score [1] |
Overall Score [1] |
|||
|---|---|---|---|---|---|---|---|---|---|---|---|---|---|---|---|---|
| Benchmark | [-] | 0.263 | ||||||||||||||
| CESM3_092H | [-] | 0.306 | 0.306 | 0.264 | 0.0531 | 0.0407 | 0.0647 | 2.30 | 0.377 | 0.570 | 0.648 | 0.962 | 0.625 | |||
| CESM3_098bH | [-] | 0.305 | 0.304 | 0.264 | 0.0531 | 0.0392 | 0.0639 | 2.13 | 0.382 | 0.571 | 0.679 | 0.958 | 0.633 | |||
| CMIP6_001 | [-] | 0.314 | 0.314 | 0.271 | 0.0681 | 0.0431 | 0.0665 | 2.38 | 0.346 | 0.572 | 0.629 | 0.987 | 0.621 | |||
| LE2_001 | [-] | 0.314 | 0.314 | 0.271 | 0.0681 | 0.0425 | 0.0663 | 2.31 | 0.345 | 0.575 | 0.643 | 0.986 | 0.625 |
Download Data |
Period Mean (original grids) [1] |
Model Period Mean (intersection) [1] |
Benchmark Period Mean (intersection) [1] |
Model Period Mean (complement) [1] |
Benchmark Period Mean (complement) [1] |
Bias [1] |
RMSE [1] |
Phase Shift [months] |
Bias Score [1] |
RMSE Score [1] |
Seasonal Cycle Score [1] |
Spatial Distribution Score [1] |
Overall Score [1] |
|||
|---|---|---|---|---|---|---|---|---|---|---|---|---|---|---|---|---|
| Benchmark | [-] | 0.300 | ||||||||||||||
| CESM3_092H | [-] | 0.397 | 0.397 | 0.300 | 0.357 | 0.0978 | 0.189 | 1.97 | 0.547 | 0.415 | 0.741 | 0.975 | 0.619 | |||
| CESM3_098bH | [-] | 0.385 | 0.385 | 0.300 | 0.357 | 0.0859 | 0.183 | 1.93 | 0.580 | 0.413 | 0.749 | 0.986 | 0.628 | |||
| CMIP6_001 | [-] | 0.470 | 0.470 | 0.301 | 0.293 | 0.169 | 0.235 | 1.79 | 0.415 | 0.420 | 0.768 | 0.719 | 0.548 | |||
| LE2_001 | [-] | 0.464 | 0.464 | 0.301 | 0.293 | 0.163 | 0.230 | 1.78 | 0.431 | 0.422 | 0.772 | 0.715 | 0.553 |
Download Data |
Period Mean (original grids) [1] |
Model Period Mean (intersection) [1] |
Benchmark Period Mean (intersection) [1] |
Model Period Mean (complement) [1] |
Benchmark Period Mean (complement) [1] |
Bias [1] |
RMSE [1] |
Phase Shift [months] |
Bias Score [1] |
RMSE Score [1] |
Seasonal Cycle Score [1] |
Spatial Distribution Score [1] |
Overall Score [1] |
|||
|---|---|---|---|---|---|---|---|---|---|---|---|---|---|---|---|---|
| Benchmark | [-] | 0.110 | ||||||||||||||
| CESM3_092H | [-] | 0.165 | 0.165 | 0.112 | 0.0560 | 0.0526 | 0.0555 | 2.76 | 0.271 | 0.640 | 0.558 | 0.525 | 0.527 | |||
| CESM3_098bH | [-] | 0.165 | 0.165 | 0.112 | 0.0560 | 0.0531 | 0.0558 | 2.42 | 0.268 | 0.639 | 0.619 | 0.507 | 0.535 | |||
| CMIP6_001 | [-] | 0.147 | 0.146 | 0.120 | 0.0597 | 0.0262 | 0.0381 | 3.51 | 0.451 | 0.645 | 0.416 | 0.702 | 0.572 | |||
| LE2_001 | [-] | 0.146 | 0.146 | 0.120 | 0.0597 | 0.0260 | 0.0381 | 3.47 | 0.449 | 0.645 | 0.421 | 0.699 | 0.572 |
Download Data |
Period Mean (original grids) [1] |
Model Period Mean (intersection) [1] |
Benchmark Period Mean (intersection) [1] |
Model Period Mean (complement) [1] |
Benchmark Period Mean (complement) [1] |
Bias [1] |
RMSE [1] |
Phase Shift [months] |
Bias Score [1] |
RMSE Score [1] |
Seasonal Cycle Score [1] |
Spatial Distribution Score [1] |
Overall Score [1] |
|||
|---|---|---|---|---|---|---|---|---|---|---|---|---|---|---|---|---|
| Benchmark | [-] | 0.121 | ||||||||||||||
| CESM3_092H | [-] | 0.183 | 0.183 | 0.122 | 0.0546 | 0.0607 | 0.0753 | 2.28 | 0.305 | 0.569 | 0.647 | 0.987 | 0.616 | |||
| CESM3_098bH | [-] | 0.178 | 0.178 | 0.122 | 0.0546 | 0.0564 | 0.0673 | 2.22 | 0.328 | 0.619 | 0.649 | 0.993 | 0.641 | |||
| CMIP6_001 | [-] | 0.166 | 0.166 | 0.124 | 0.0591 | 0.0416 | 0.0600 | 2.13 | 0.476 | 0.559 | 0.672 | 0.859 | 0.625 | |||
| LE2_001 | [-] | 0.169 | 0.169 | 0.124 | 0.0591 | 0.0447 | 0.0673 | 2.13 | 0.457 | 0.523 | 0.671 | 0.808 | 0.597 |
Download Data |
Period Mean (original grids) [1] |
Model Period Mean (intersection) [1] |
Benchmark Period Mean (intersection) [1] |
Model Period Mean (complement) [1] |
Benchmark Period Mean (complement) [1] |
Bias [1] |
RMSE [1] |
Phase Shift [months] |
Bias Score [1] |
RMSE Score [1] |
Seasonal Cycle Score [1] |
Spatial Distribution Score [1] |
Overall Score [1] |
|||
|---|---|---|---|---|---|---|---|---|---|---|---|---|---|---|---|---|
| Benchmark | [-] | 0.151 | ||||||||||||||
| CESM3_092H | [-] | 0.210 | 0.210 | 0.151 | 0.0563 | 0.0592 | 0.0975 | 0.980 | 0.512 | 0.559 | 0.904 | 0.983 | 0.703 | |||
| CESM3_098bH | [-] | 0.206 | 0.206 | 0.151 | 0.0563 | 0.0552 | 0.0937 | 0.987 | 0.531 | 0.561 | 0.902 | 0.983 | 0.708 | |||
| CMIP6_001 | [-] | 0.177 | 0.179 | 0.154 | 0.0803 | 0.0264 | 0.0794 | 0.967 | 0.673 | 0.565 | 0.906 | 0.813 | 0.704 | |||
| LE2_001 | [-] | 0.177 | 0.178 | 0.154 | 0.0803 | 0.0260 | 0.0805 | 0.911 | 0.673 | 0.557 | 0.916 | 0.820 | 0.705 |
Download Data |
Period Mean (original grids) [1] |
Model Period Mean (intersection) [1] |
Benchmark Period Mean (intersection) [1] |
Model Period Mean (complement) [1] |
Benchmark Period Mean (complement) [1] |
Bias [1] |
RMSE [1] |
Phase Shift [months] |
Bias Score [1] |
RMSE Score [1] |
Seasonal Cycle Score [1] |
Spatial Distribution Score [1] |
Overall Score [1] |
|||
|---|---|---|---|---|---|---|---|---|---|---|---|---|---|---|---|---|
| Benchmark | [-] | 0.159 | ||||||||||||||
| CESM3_092H | [-] | 0.198 | 0.198 | 0.159 | 0.0565 | 0.0377 | 0.0570 | 1.02 | 0.536 | 0.626 | 0.857 | 0.984 | 0.726 | |||
| CESM3_098bH | [-] | 0.194 | 0.194 | 0.159 | 0.0565 | 0.0339 | 0.0502 | 0.977 | 0.564 | 0.661 | 0.853 | 0.968 | 0.741 | |||
| CMIP6_001 | [-] | 0.190 | 0.190 | 0.161 | 0.0596 | 0.0284 | 0.0554 | 0.930 | 0.585 | 0.613 | 0.869 | 0.927 | 0.721 | |||
| LE2_001 | [-] | 0.193 | 0.193 | 0.161 | 0.0596 | 0.0315 | 0.0629 | 0.898 | 0.565 | 0.577 | 0.875 | 0.888 | 0.696 |
Download Data |
Period Mean (original grids) [1] |
Model Period Mean (intersection) [1] |
Benchmark Period Mean (intersection) [1] |
Model Period Mean (complement) [1] |
Benchmark Period Mean (complement) [1] |
Bias [1] |
RMSE [1] |
Phase Shift [months] |
Bias Score [1] |
RMSE Score [1] |
Seasonal Cycle Score [1] |
Spatial Distribution Score [1] |
Overall Score [1] |
|||
|---|---|---|---|---|---|---|---|---|---|---|---|---|---|---|---|---|
| Benchmark | [-] | 0.133 | ||||||||||||||
| CESM3_092H | [-] | 0.169 | 0.169 | 0.134 | 0.0576 | 0.0351 | 0.0389 | 2.88 | 0.437 | 0.715 | 0.515 | 0.456 | 0.568 | |||
| CESM3_098bH | [-] | 0.171 | 0.171 | 0.134 | 0.0576 | 0.0369 | 0.0404 | 2.79 | 0.422 | 0.707 | 0.539 | 0.462 | 0.567 | |||
| CMIP6_001 | [-] | 0.135 | 0.135 | 0.135 | 0.0638 | -0.000288 | 0.0197 | 3.01 | 0.735 | 0.730 | 0.497 | 0.391 | 0.617 | |||
| LE2_001 | [-] | 0.135 | 0.135 | 0.135 | 0.0638 | -0.000357 | 0.0197 | 2.86 | 0.736 | 0.730 | 0.527 | 0.381 | 0.620 |
Download Data |
Period Mean (original grids) [1] |
Model Period Mean (intersection) [1] |
Benchmark Period Mean (intersection) [1] |
Model Period Mean (complement) [1] |
Benchmark Period Mean (complement) [1] |
Bias [1] |
RMSE [1] |
Phase Shift [months] |
Bias Score [1] |
RMSE Score [1] |
Seasonal Cycle Score [1] |
Spatial Distribution Score [1] |
Overall Score [1] |
|||
|---|---|---|---|---|---|---|---|---|---|---|---|---|---|---|---|---|
| Benchmark | [-] | 0.139 | ||||||||||||||
| CESM3_092H | [-] | 0.164 | 0.164 | 0.140 | 0.0725 | 0.0247 | 0.0375 | 4.03 | 0.503 | 0.567 | 0.303 | 0.578 | 0.503 | |||
| CESM3_098bH | [-] | 0.167 | 0.167 | 0.140 | 0.0725 | 0.0269 | 0.0380 | 3.92 | 0.493 | 0.565 | 0.324 | 0.599 | 0.509 | |||
| CMIP6_001 | [-] | 0.152 | 0.152 | 0.141 | 0.0683 | 0.0109 | 0.0312 | 4.33 | 0.647 | 0.537 | 0.244 | 0.850 | 0.563 | |||
| LE2_001 | [-] | 0.153 | 0.153 | 0.141 | 0.0683 | 0.0117 | 0.0318 | 4.33 | 0.636 | 0.532 | 0.242 | 0.862 | 0.560 |
Download Data |
Period Mean (original grids) [1] |
Model Period Mean (intersection) [1] |
Benchmark Period Mean (intersection) [1] |
Model Period Mean (complement) [1] |
Benchmark Period Mean (complement) [1] |
Bias [1] |
RMSE [1] |
Phase Shift [months] |
Bias Score [1] |
RMSE Score [1] |
Seasonal Cycle Score [1] |
Spatial Distribution Score [1] |
Overall Score [1] |
|||
|---|---|---|---|---|---|---|---|---|---|---|---|---|---|---|---|---|
| Benchmark | [-] | 0.133 | ||||||||||||||
| CESM3_092H | [-] | 0.170 | 0.171 | 0.134 | 0.0575 | 0.0368 | 0.0607 | 3.11 | 0.363 | 0.571 | 0.488 | 0.615 | 0.522 | |||
| CESM3_098bH | [-] | 0.170 | 0.171 | 0.134 | 0.0575 | 0.0368 | 0.0618 | 2.95 | 0.361 | 0.561 | 0.517 | 0.626 | 0.525 | |||
| CMIP6_001 | [-] | 0.159 | 0.159 | 0.140 | 0.0680 | 0.0184 | 0.0546 | 3.45 | 0.448 | 0.545 | 0.417 | 0.934 | 0.578 | |||
| LE2_001 | [-] | 0.159 | 0.159 | 0.140 | 0.0680 | 0.0182 | 0.0548 | 3.42 | 0.448 | 0.541 | 0.421 | 0.933 | 0.577 |
Temporally integrated period mean