Mean State
Download Data |
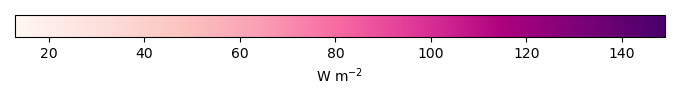
Period Mean (original grids) [W m-2] |
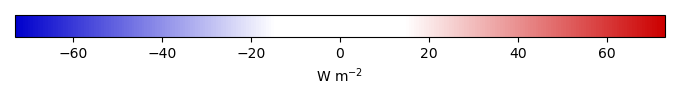
Bias [W m-2] |
RMSE [W m-2] |
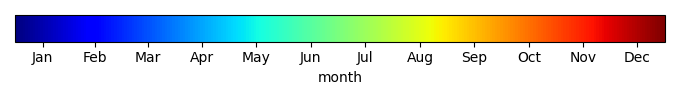
Phase Shift [months] |
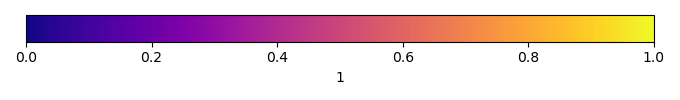
Bias Score [1] |
RMSE Score [1] |
Seasonal Cycle Score [1] |
Overall Score [1] |
|||
|---|---|---|---|---|---|---|---|---|---|---|---|
| Benchmark | [-] | 92.3 | |||||||||
| CESM3_092H | [-] | 100. | 8.77 | 24.7 | 1.00 | 0.284 | 0.181 | 0.935 | 0.395 | ||
| CESM3_098bH | [-] | 95.6 | 5.78 | 24.1 | 1.00 | 0.195 | 0.319 | 0.935 | 0.442 | ||
| CMIP6_001 | [-] | 133. | 40.3 | 47.5 | 0.00 | 0.0171 | 0.277 | 1.00 | 0.393 | ||
| LE2_001 | [-] | 132. | 39.7 | 44.3 | 0.508 | 0.0169 | 0.283 | 0.966 | 0.387 |
Download Data |
Period Mean (original grids) [W m-2] |
Bias [W m-2] |
RMSE [W m-2] |
Phase Shift [months] |
Bias Score [1] |
RMSE Score [1] |
Seasonal Cycle Score [1] |
Overall Score [1] |
|||
|---|---|---|---|---|---|---|---|---|---|---|---|
| Benchmark | [-] | 82.3 | |||||||||
| CESM3_092H | [-] | 95.9 | 13.6 | 21.5 | 0.508 | 0.355 | 0.406 | 0.966 | 0.533 | ||
| CESM3_098bH | [-] | 88.6 | 6.29 | 14.7 | 0.508 | 0.702 | 0.476 | 0.966 | 0.655 | ||
| CMIP6_001 | [-] | 82.9 | 0.652 | 23.6 | 1.53 | 0.578 | 0.201 | 0.839 | 0.454 | ||
| LE2_001 | [-] | 84.2 | 1.89 | 20.7 | 1.53 | 0.627 | 0.306 | 0.839 | 0.519 |
Download Data |
Period Mean (original grids) [W m-2] |
Bias [W m-2] |
RMSE [W m-2] |
Phase Shift [months] |
Bias Score [1] |
RMSE Score [1] |
Seasonal Cycle Score [1] |
Overall Score [1] |
|||
|---|---|---|---|---|---|---|---|---|---|---|---|
| Benchmark | [-] | 128. | |||||||||
| CESM3_092H | [-] | 121. | -7.41 | 16.3 | 0.983 | 0.605 | 0.407 | 0.937 | 0.589 | ||
| CESM3_098bH | [-] | 117. | -11.2 | 17.4 | 0.983 | 0.403 | 0.364 | 0.937 | 0.517 | ||
| CMIP6_001 | [-] | 113. | -15.0 | 20.6 | 0.983 | 0.199 | 0.395 | 0.937 | 0.482 | ||
| LE2_001 | [-] | 112. | -16.1 | 20.1 | 0.983 | 0.142 | 0.376 | 0.937 | 0.457 |
Download Data |
Period Mean (original grids) [W m-2] |
Bias [W m-2] |
RMSE [W m-2] |
Phase Shift [months] |
Bias Score [1] |
RMSE Score [1] |
Seasonal Cycle Score [1] |
Overall Score [1] |
|||
|---|---|---|---|---|---|---|---|---|---|---|---|
| Benchmark | [-] | 49.5 | |||||||||
| CESM3_092H | [-] | 22.2 | -27.3 | 21.4 | 0.00 | 0.0876 | 0.260 | 1.00 | 0.402 | ||
| CESM3_098bH | [-] | 20.2 | -29.2 | 21.1 | 0.00 | 0.0413 | 0.191 | 1.00 | 0.356 | ||
| CMIP6_001 | [-] | 25.7 | -23.8 | 21.3 | 0.00 | 0.225 | 0.168 | 1.00 | 0.390 | ||
| LE2_001 | [-] | 24.4 | -25.1 | 20.5 | 0.00 | 0.160 | 0.156 | 1.00 | 0.368 |
Download Data |
Period Mean (original grids) [W m-2] |
Bias [W m-2] |
RMSE [W m-2] |
Phase Shift [months] |
Bias Score [1] |
RMSE Score [1] |
Seasonal Cycle Score [1] |
Overall Score [1] |
|||
|---|---|---|---|---|---|---|---|---|---|---|---|
| Benchmark | [-] | 144. | |||||||||
| CESM3_092H | [-] | 122. | -22.0 | 25.3 | 1.02 | 0.00 | 0.437 | 0.933 | 0.452 | ||
| CESM3_098bH | [-] | 118. | -26.1 | 28.9 | 1.02 | 0.00 | 0.413 | 0.933 | 0.440 | ||
| CMIP6_001 | [-] | 126. | -18.4 | 27.5 | 1.02 | 0.0202 | 0.148 | 0.933 | 0.312 | ||
| LE2_001 | [-] | 126. | -18.4 | 29.7 | 1.02 | 0.0193 | 0.103 | 0.933 | 0.289 |
Download Data |
Period Mean (original grids) [W m-2] |
Bias [W m-2] |
RMSE [W m-2] |
Phase Shift [months] |
Bias Score [1] |
RMSE Score [1] |
Seasonal Cycle Score [1] |
Overall Score [1] |
|||
|---|---|---|---|---|---|---|---|---|---|---|---|
| Benchmark | [-] | 66.8 | |||||||||
| CESM3_092H | [-] | 53.1 | -13.8 | 17.5 | 1.02 | 0.222 | 0.152 | 0.933 | 0.365 | ||
| CESM3_098bH | [-] | 52.2 | -15.3 | 17.0 | 1.02 | 0.157 | 0.112 | 0.933 | 0.329 | ||
| CMIP6_001 | [-] | 48.7 | -18.1 | 17.1 | 1.02 | 0.272 | 0.101 | 0.933 | 0.352 | ||
| LE2_001 | [-] | 49.3 | -17.5 | 15.7 | 0.508 | 0.300 | 0.151 | 0.966 | 0.392 |
Download Data |
Period Mean (original grids) [W m-2] |
Bias [W m-2] |
RMSE [W m-2] |
Phase Shift [months] |
Bias Score [1] |
RMSE Score [1] |
Seasonal Cycle Score [1] |
Overall Score [1] |
|||
|---|---|---|---|---|---|---|---|---|---|---|---|
| Benchmark | [-] | 73.7 | |||||||||
| CESM3_092H | [-] | 82.0 | 8.36 | 18.7 | 0.612 | 0.436 | 0.269 | 0.948 | 0.481 | ||
| CESM3_098bH | [-] | 80.4 | 6.72 | 18.0 | 0.612 | 0.487 | 0.239 | 0.948 | 0.478 | ||
| CMIP6_001 | [-] | 83.4 | 9.76 | 18.0 | 0.510 | 0.520 | 0.265 | 0.954 | 0.501 | ||
| LE2_001 | [-] | 83.5 | 9.87 | 19.5 | 0.510 | 0.512 | 0.228 | 0.954 | 0.480 |
Download Data |
Period Mean (original grids) [W m-2] |
Bias [W m-2] |
RMSE [W m-2] |
Phase Shift [months] |
Bias Score [1] |
RMSE Score [1] |
Seasonal Cycle Score [1] |
Overall Score [1] |
|||
|---|---|---|---|---|---|---|---|---|---|---|---|
| Benchmark | [-] | 122. | |||||||||
| CESM3_092H | [-] | 112. | -8.33 | 23.0 | 1.07 | 0.415 | 0.279 | 0.875 | 0.462 | ||
| CESM3_098bH | [-] | 108. | -12.1 | 22.5 | 1.16 | 0.321 | 0.283 | 0.864 | 0.438 | ||
| CMIP6_001 | [-] | 111. | -9.61 | 21.9 | 1.02 | 0.402 | 0.289 | 0.885 | 0.466 | ||
| LE2_001 | [-] | 110. | -10.5 | 22.0 | 1.01 | 0.406 | 0.272 | 0.887 | 0.459 |
Download Data |
Period Mean (original grids) [W m-2] |
Bias [W m-2] |
RMSE [W m-2] |
Phase Shift [months] |
Bias Score [1] |
RMSE Score [1] |
Seasonal Cycle Score [1] |
Overall Score [1] |
|||
|---|---|---|---|---|---|---|---|---|---|---|---|
| Benchmark | [-] | 69.7 | |||||||||
| CESM3_092H | [-] | 66.9 | -3.47 | 21.6 | 0.403 | 0.397 | 0.190 | 0.973 | 0.438 | ||
| CESM3_098bH | [-] | 65.0 | -4.70 | 21.8 | 0.420 | 0.395 | 0.203 | 0.972 | 0.443 | ||
| CMIP6_001 | [-] | 66.9 | -2.83 | 20.6 | 0.387 | 0.430 | 0.226 | 0.974 | 0.464 | ||
| LE2_001 | [-] | 67.0 | -2.69 | 20.7 | 0.355 | 0.431 | 0.211 | 0.976 | 0.457 |
Download Data |
Period Mean (original grids) [W m-2] |
Bias [W m-2] |
RMSE [W m-2] |
Phase Shift [months] |
Bias Score [1] |
RMSE Score [1] |
Seasonal Cycle Score [1] |
Overall Score [1] |
|||
|---|---|---|---|---|---|---|---|---|---|---|---|
| Benchmark | [-] | 87.4 | |||||||||
| CESM3_092H | [-] | 80.2 | -7.32 | 22.1 | 0.638 | 0.380 | 0.213 | 0.940 | 0.437 | ||
| CESM3_098bH | [-] | 78.0 | -8.56 | 22.0 | 0.622 | 0.357 | 0.224 | 0.942 | 0.437 | ||
| CMIP6_001 | [-] | 79.0 | -8.04 | 22.5 | 0.529 | 0.359 | 0.225 | 0.951 | 0.440 | ||
| LE2_001 | [-] | 79.0 | -8.02 | 22.6 | 0.555 | 0.356 | 0.220 | 0.949 | 0.436 |
Download Data |
Period Mean (original grids) [W m-2] |
Bias [W m-2] |
RMSE [W m-2] |
Phase Shift [months] |
Bias Score [1] |
RMSE Score [1] |
Seasonal Cycle Score [1] |
Overall Score [1] |
|||
|---|---|---|---|---|---|---|---|---|---|---|---|
| Benchmark | [-] | 34.7 | |||||||||
| CESM3_092H | [-] | 24.7 | -10.3 | 21.9 | 0.339 | 0.395 | 0.222 | 0.978 | 0.454 | ||
| CESM3_098bH | [-] | 24.5 | -10.7 | 22.7 | 0.339 | 0.375 | 0.182 | 0.978 | 0.429 | ||
| CMIP6_001 | [-] | 24.0 | -10.7 | 24.6 | 0.678 | 0.375 | 0.0963 | 0.955 | 0.381 | ||
| LE2_001 | [-] | 23.8 | -10.8 | 25.0 | 0.339 | 0.370 | 0.108 | 0.978 | 0.391 |
Download Data |
Period Mean (original grids) [W m-2] |
Bias [W m-2] |
RMSE [W m-2] |
Phase Shift [months] |
Bias Score [1] |
RMSE Score [1] |
Seasonal Cycle Score [1] |
Overall Score [1] |
|||
|---|---|---|---|---|---|---|---|---|---|---|---|
| Benchmark | [-] | 117. | |||||||||
| CESM3_092H | [-] | 121. | 4.01 | 24.8 | 1.51 | 0.773 | 0.223 | 0.844 | 0.516 | ||
| CESM3_098bH | [-] | 119. | 1.93 | 20.5 | 0.492 | 0.773 | 0.341 | 0.968 | 0.606 | ||
| CMIP6_001 | [-] | 131. | 13.9 | 27.3 | 0.492 | 0.450 | 0.203 | 0.968 | 0.456 | ||
| LE2_001 | [-] | 132. | 15.1 | 29.0 | 0.492 | 0.405 | 0.248 | 0.968 | 0.467 |
Download Data |
Period Mean (original grids) [W m-2] |
Bias [W m-2] |
RMSE [W m-2] |
Phase Shift [months] |
Bias Score [1] |
RMSE Score [1] |
Seasonal Cycle Score [1] |
Overall Score [1] |
|||
|---|---|---|---|---|---|---|---|---|---|---|---|
| Benchmark | [-] | 104. | |||||||||
| CESM3_092H | [-] | 85.5 | -18.6 | 24.6 | 0.876 | 0.385 | 0.112 | 0.922 | 0.383 | ||
| CESM3_098bH | [-] | 83.7 | -19.9 | 24.6 | 0.679 | 0.359 | 0.141 | 0.938 | 0.395 | ||
| CMIP6_001 | [-] | 83.4 | -20.4 | 24.1 | 0.622 | 0.328 | 0.142 | 0.937 | 0.387 | ||
| LE2_001 | [-] | 83.5 | -20.4 | 24.9 | 0.763 | 0.312 | 0.128 | 0.922 | 0.372 |
Download Data |
Period Mean (original grids) [W m-2] |
Bias [W m-2] |
RMSE [W m-2] |
Phase Shift [months] |
Bias Score [1] |
RMSE Score [1] |
Seasonal Cycle Score [1] |
Overall Score [1] |
|||
|---|---|---|---|---|---|---|---|---|---|---|---|
| Benchmark | [-] | 69.4 | |||||||||
| CESM3_092H | [-] | 60.1 | -9.26 | 18.1 | 0.271 | 0.430 | 0.337 | 0.982 | 0.522 | ||
| CESM3_098bH | [-] | 58.9 | -10.5 | 19.1 | 0.474 | 0.394 | 0.314 | 0.969 | 0.498 | ||
| CMIP6_001 | [-] | 61.3 | -8.07 | 19.6 | 0.0678 | 0.401 | 0.286 | 0.996 | 0.492 | ||
| LE2_001 | [-] | 61.6 | -7.79 | 18.5 | 0.136 | 0.403 | 0.323 | 0.991 | 0.510 |
Download Data |
Period Mean (original grids) [W m-2] |
Bias [W m-2] |
RMSE [W m-2] |
Phase Shift [months] |
Bias Score [1] |
RMSE Score [1] |
Seasonal Cycle Score [1] |
Overall Score [1] |
|||
|---|---|---|---|---|---|---|---|---|---|---|---|
| Benchmark | [-] | 97.8 | |||||||||
| CESM3_092H | [-] | 89.3 | -9.40 | 24.0 | 0.752 | 0.278 | 0.227 | 0.908 | 0.410 | ||
| CESM3_098bH | [-] | 86.8 | -7.51 | 23.8 | 0.752 | 0.229 | 0.233 | 0.908 | 0.401 | ||
| CMIP6_001 | [-] | 83.0 | -14.7 | 26.2 | 0.565 | 0.191 | 0.254 | 0.943 | 0.410 | ||
| LE2_001 | [-] | 83.2 | -14.5 | 26.3 | 0.565 | 0.188 | 0.251 | 0.943 | 0.408 |
Download Data |
Period Mean (original grids) [W m-2] |
Bias [W m-2] |
RMSE [W m-2] |
Phase Shift [months] |
Bias Score [1] |
RMSE Score [1] |
Seasonal Cycle Score [1] |
Overall Score [1] |
|||
|---|---|---|---|---|---|---|---|---|---|---|---|
| Benchmark | [-] | 133. | |||||||||
| CESM3_092H | [-] | 146. | 13.1 | 21.3 | 0.339 | 0.302 | 0.367 | 0.978 | 0.504 | ||
| CESM3_098bH | [-] | 144. | 10.3 | 20.4 | 0.339 | 0.430 | 0.351 | 0.978 | 0.527 | ||
| CMIP6_001 | [-] | 156. | 22.6 | 28.7 | 0.339 | 0.00 | 0.351 | 0.978 | 0.420 | ||
| LE2_001 | [-] | 156. | 23.1 | 29.1 | 0.678 | 0.00 | 0.330 | 0.955 | 0.404 |
Download Data |
Period Mean (original grids) [W m-2] |
Bias [W m-2] |
RMSE [W m-2] |
Phase Shift [months] |
Bias Score [1] |
RMSE Score [1] |
Seasonal Cycle Score [1] |
Overall Score [1] |
|||
|---|---|---|---|---|---|---|---|---|---|---|---|
| Benchmark | [-] | 125. | |||||||||
| CESM3_092H | [-] | 115. | -10.5 | 23.9 | 0.00 | 0.439 | 0.0261 | 1.00 | 0.373 | ||
| CESM3_098bH | [-] | 112. | -13.6 | 25.0 | 0.00 | 0.276 | 0.0734 | 1.00 | 0.356 | ||
| CMIP6_001 | [-] | 111. | -14.8 | 25.2 | 0.00 | 0.208 | 0.0413 | 1.00 | 0.323 | ||
| LE2_001 | [-] | 110. | -15.0 | 22.2 | 1.03 | 0.197 | 0.159 | 0.930 | 0.362 |
Download Data |
Period Mean (original grids) [W m-2] |
Bias [W m-2] |
RMSE [W m-2] |
Phase Shift [months] |
Bias Score [1] |
RMSE Score [1] |
Seasonal Cycle Score [1] |
Overall Score [1] |
|||
|---|---|---|---|---|---|---|---|---|---|---|---|
| Benchmark | [-] | 117. | |||||||||
| CESM3_092H | [-] | 99.1 | -18.1 | 13.6 | 0.00 | 0.00 | 0.389 | 1.00 | 0.444 | ||
| CESM3_098bH | [-] | 96.0 | -21.3 | 16.3 | 0.00 | 0.00 | 0.400 | 1.00 | 0.450 | ||
| CMIP6_001 | [-] | 95.8 | -21.5 | 13.9 | 0.00 | 0.00 | 0.377 | 1.00 | 0.438 | ||
| LE2_001 | [-] | 96.1 | -21.2 | 14.8 | 0.00 | 0.00 | 0.387 | 1.00 | 0.443 |
Temporally integrated period mean