Mean State
Download Data |
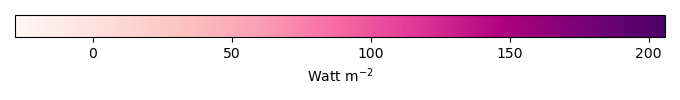
Period Mean (original grids) [Watt m-2] |
Model Period Mean (intersection) [Watt m-2] |
Benchmark Period Mean (intersection) [Watt m-2] |
Model Period Mean (complement) [Watt m-2] |
Benchmark Period Mean (complement) [Watt m-2] |
Bias [Watt m-2] |
RMSE [Watt m-2] |
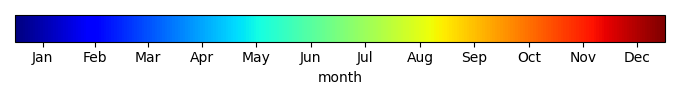
Phase Shift [months] |
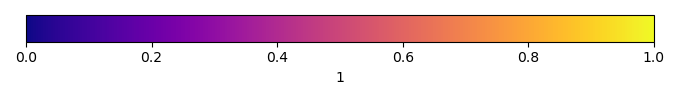
Bias Score [1] |
RMSE Score [1] |
Seasonal Cycle Score [1] |
Spatial Distribution Score [1] |
Overall Score [1] |
|||
|---|---|---|---|---|---|---|---|---|---|---|---|---|---|---|---|---|
| Benchmark | [-] | 122. | ||||||||||||||
| CESM3_092H | [-] | 118. | 118. | 121. | 167. | -4.41 | 18.3 | 1.30 | 0.463 | 0.649 | 0.825 | 0.472 | 0.612 | |||
| CESM3_098bH | [-] | 113. | 113. | 121. | 167. | -9.25 | 19.1 | 1.49 | 0.429 | 0.632 | 0.794 | 0.565 | 0.610 | |||
| CMIP6_001 | [-] | 123. | 122. | 120. | 164. | 2.66 | 18.9 | 2.10 | 0.505 | 0.554 | 0.677 | 0.519 | 0.562 | |||
| LE2_001 | [-] | 122. | 122. | 120. | 164. | 2.40 | 19.3 | 2.12 | 0.491 | 0.547 | 0.672 | 0.519 | 0.555 |
Download Data |
Period Mean (original grids) [Watt m-2] |
Model Period Mean (intersection) [Watt m-2] |
Benchmark Period Mean (intersection) [Watt m-2] |
Model Period Mean (complement) [Watt m-2] |
Benchmark Period Mean (complement) [Watt m-2] |
Bias [Watt m-2] |
RMSE [Watt m-2] |
Phase Shift [months] |
Bias Score [1] |
RMSE Score [1] |
Seasonal Cycle Score [1] |
Spatial Distribution Score [1] |
Overall Score [1] |
|||
|---|---|---|---|---|---|---|---|---|---|---|---|---|---|---|---|---|
| Benchmark | [-] | 102. | ||||||||||||||
| CESM3_092H | [-] | 109. | 109. | 102. | 158. | 7.89 | 21.0 | 1.55 | 0.358 | 0.526 | 0.774 | 0.609 | 0.559 | |||
| CESM3_098bH | [-] | 102. | 102. | 102. | 158. | 0.866 | 20.6 | 1.64 | 0.349 | 0.519 | 0.759 | 0.605 | 0.550 | |||
| CMIP6_001 | [-] | 104. | 103. | 101. | 165. | 2.99 | 16.4 | 1.33 | 0.488 | 0.551 | 0.810 | 0.820 | 0.644 | |||
| LE2_001 | [-] | 104. | 103. | 101. | 165. | 3.04 | 16.7 | 1.30 | 0.476 | 0.551 | 0.814 | 0.805 | 0.639 |
Download Data |
Period Mean (original grids) [Watt m-2] |
Model Period Mean (intersection) [Watt m-2] |
Benchmark Period Mean (intersection) [Watt m-2] |
Model Period Mean (complement) [Watt m-2] |
Benchmark Period Mean (complement) [Watt m-2] |
Bias [Watt m-2] |
RMSE [Watt m-2] |
Phase Shift [months] |
Bias Score [1] |
RMSE Score [1] |
Seasonal Cycle Score [1] |
Spatial Distribution Score [1] |
Overall Score [1] |
|||
|---|---|---|---|---|---|---|---|---|---|---|---|---|---|---|---|---|
| Benchmark | [-] | 112. | ||||||||||||||
| CESM3_092H | [-] | 117. | 117. | 112. | 162. | 5.70 | 18.7 | 1.65 | 0.420 | 0.656 | 0.753 | 0.697 | 0.636 | |||
| CESM3_098bH | [-] | 112. | 112. | 112. | 162. | 1.48 | 17.0 | 1.80 | 0.534 | 0.672 | 0.722 | 0.695 | 0.659 | |||
| CMIP6_001 | [-] | 118. | 118. | 110. | 159. | 8.63 | 20.0 | 2.01 | 0.384 | 0.570 | 0.686 | 0.871 | 0.616 | |||
| LE2_001 | [-] | 118. | 118. | 110. | 159. | 8.71 | 19.9 | 2.08 | 0.386 | 0.574 | 0.675 | 0.866 | 0.615 |
Download Data |
Period Mean (original grids) [Watt m-2] |
Model Period Mean (intersection) [Watt m-2] |
Benchmark Period Mean (intersection) [Watt m-2] |
Model Period Mean (complement) [Watt m-2] |
Benchmark Period Mean (complement) [Watt m-2] |
Bias [Watt m-2] |
RMSE [Watt m-2] |
Phase Shift [months] |
Bias Score [1] |
RMSE Score [1] |
Seasonal Cycle Score [1] |
Spatial Distribution Score [1] |
Overall Score [1] |
|||
|---|---|---|---|---|---|---|---|---|---|---|---|---|---|---|---|---|
| Benchmark | [-] | 43.3 | ||||||||||||||
| CESM3_092H | [-] | 26.7 | 26.7 | 43.3 | 44.7 | -16.6 | 19.0 | 0.148 | 0.185 | 0.528 | 0.990 | 0.954 | 0.637 | |||
| CESM3_098bH | [-] | 26.2 | 26.3 | 43.3 | 44.7 | -17.1 | 19.4 | 0.132 | 0.166 | 0.529 | 0.991 | 0.965 | 0.636 | |||
| CMIP6_001 | [-] | 25.3 | 25.3 | 43.2 | 44.3 | -18.3 | 22.2 | 0.269 | 0.137 | 0.436 | 0.982 | 0.909 | 0.580 | |||
| LE2_001 | [-] | 25.0 | 25.1 | 43.2 | 44.3 | -18.5 | 22.4 | 0.303 | 0.129 | 0.438 | 0.980 | 0.920 | 0.581 |
Download Data |
Period Mean (original grids) [Watt m-2] |
Model Period Mean (intersection) [Watt m-2] |
Benchmark Period Mean (intersection) [Watt m-2] |
Model Period Mean (complement) [Watt m-2] |
Benchmark Period Mean (complement) [Watt m-2] |
Bias [Watt m-2] |
RMSE [Watt m-2] |
Phase Shift [months] |
Bias Score [1] |
RMSE Score [1] |
Seasonal Cycle Score [1] |
Spatial Distribution Score [1] |
Overall Score [1] |
|||
|---|---|---|---|---|---|---|---|---|---|---|---|---|---|---|---|---|
| Benchmark | [-] | 144. | ||||||||||||||
| CESM3_092H | [-] | 128. | 128. | 143. | 165. | -10.9 | 18.7 | 1.33 | 0.575 | 0.664 | 0.832 | 0.527 | 0.653 | |||
| CESM3_098bH | [-] | 125. | 124. | 143. | 165. | -15.0 | 20.9 | 1.43 | 0.521 | 0.655 | 0.819 | 0.482 | 0.626 | |||
| CMIP6_001 | [-] | 130. | 130. | 140. | 160. | -4.75 | 16.7 | 1.55 | 0.576 | 0.626 | 0.794 | 0.805 | 0.685 | |||
| LE2_001 | [-] | 130. | 130. | 140. | 160. | -4.87 | 16.8 | 1.59 | 0.573 | 0.626 | 0.783 | 0.797 | 0.681 |
Download Data |
Period Mean (original grids) [Watt m-2] |
Model Period Mean (intersection) [Watt m-2] |
Benchmark Period Mean (intersection) [Watt m-2] |
Model Period Mean (complement) [Watt m-2] |
Benchmark Period Mean (complement) [Watt m-2] |
Bias [Watt m-2] |
RMSE [Watt m-2] |
Phase Shift [months] |
Bias Score [1] |
RMSE Score [1] |
Seasonal Cycle Score [1] |
Spatial Distribution Score [1] |
Overall Score [1] |
|||
|---|---|---|---|---|---|---|---|---|---|---|---|---|---|---|---|---|
| Benchmark | [-] | 62.5 | ||||||||||||||
| CESM3_092H | [-] | 47.5 | 47.4 | 62.5 | 75.9 | -14.6 | 20.5 | 0.565 | 0.193 | 0.427 | 0.959 | 0.975 | 0.596 | |||
| CESM3_098bH | [-] | 47.0 | 46.9 | 62.5 | 75.9 | -15.2 | 20.4 | 0.599 | 0.177 | 0.451 | 0.957 | 0.986 | 0.604 | |||
| CMIP6_001 | [-] | 48.3 | 48.3 | 62.3 | 75.7 | -13.7 | 19.9 | 0.273 | 0.228 | 0.422 | 0.982 | 0.943 | 0.599 | |||
| LE2_001 | [-] | 49.1 | 49.1 | 62.3 | 75.7 | -12.9 | 19.2 | 0.223 | 0.260 | 0.428 | 0.985 | 0.959 | 0.612 |
Download Data |
Period Mean (original grids) [Watt m-2] |
Model Period Mean (intersection) [Watt m-2] |
Benchmark Period Mean (intersection) [Watt m-2] |
Model Period Mean (complement) [Watt m-2] |
Benchmark Period Mean (complement) [Watt m-2] |
Bias [Watt m-2] |
RMSE [Watt m-2] |
Phase Shift [months] |
Bias Score [1] |
RMSE Score [1] |
Seasonal Cycle Score [1] |
Spatial Distribution Score [1] |
Overall Score [1] |
|||
|---|---|---|---|---|---|---|---|---|---|---|---|---|---|---|---|---|
| Benchmark | [-] | 72.7 | ||||||||||||||
| CESM3_092H | [-] | 70.8 | 70.6 | 72.6 | 112. | -0.688 | 22.9 | 0.712 | 0.482 | 0.186 | 0.934 | 0.992 | 0.556 | |||
| CESM3_098bH | [-] | 68.8 | 68.6 | 72.6 | 112. | -2.72 | 21.8 | 0.726 | 0.486 | 0.223 | 0.935 | 0.992 | 0.572 | |||
| CMIP6_001 | [-] | 70.4 | 70.2 | 72.2 | 105. | -0.786 | 22.5 | 0.524 | 0.449 | 0.207 | 0.958 | 0.985 | 0.561 | |||
| LE2_001 | [-] | 70.3 | 70.1 | 72.2 | 105. | -0.902 | 22.7 | 0.539 | 0.447 | 0.206 | 0.958 | 0.985 | 0.560 |
Download Data |
Period Mean (original grids) [Watt m-2] |
Model Period Mean (intersection) [Watt m-2] |
Benchmark Period Mean (intersection) [Watt m-2] |
Model Period Mean (complement) [Watt m-2] |
Benchmark Period Mean (complement) [Watt m-2] |
Bias [Watt m-2] |
RMSE [Watt m-2] |
Phase Shift [months] |
Bias Score [1] |
RMSE Score [1] |
Seasonal Cycle Score [1] |
Spatial Distribution Score [1] |
Overall Score [1] |
|||
|---|---|---|---|---|---|---|---|---|---|---|---|---|---|---|---|---|
| Benchmark | [-] | 109. | ||||||||||||||
| CESM3_092H | [-] | 100. | 100. | 108. | 163. | -3.49 | 19.9 | 0.567 | 0.520 | 0.492 | 0.955 | 0.836 | 0.659 | |||
| CESM3_098bH | [-] | 96.0 | 96.0 | 108. | 163. | -7.82 | 20.5 | 0.634 | 0.548 | 0.486 | 0.946 | 0.815 | 0.656 | |||
| CMIP6_001 | [-] | 103. | 103. | 105. | 157. | 2.30 | 19.8 | 0.710 | 0.463 | 0.464 | 0.936 | 0.961 | 0.657 | |||
| LE2_001 | [-] | 103. | 103. | 105. | 157. | 2.03 | 19.8 | 0.705 | 0.471 | 0.459 | 0.938 | 0.962 | 0.658 |
Download Data |
Period Mean (original grids) [Watt m-2] |
Model Period Mean (intersection) [Watt m-2] |
Benchmark Period Mean (intersection) [Watt m-2] |
Model Period Mean (complement) [Watt m-2] |
Benchmark Period Mean (complement) [Watt m-2] |
Bias [Watt m-2] |
RMSE [Watt m-2] |
Phase Shift [months] |
Bias Score [1] |
RMSE Score [1] |
Seasonal Cycle Score [1] |
Spatial Distribution Score [1] |
Overall Score [1] |
|||
|---|---|---|---|---|---|---|---|---|---|---|---|---|---|---|---|---|
| Benchmark | [-] | 41.8 | ||||||||||||||
| CESM3_092H | [-] | 24.5 | 24.8 | 41.8 | 45.2 | -18.1 | 18.0 | 0.496 | 0.138 | 0.456 | 0.967 | 0.982 | 0.600 | |||
| CESM3_098bH | [-] | 24.3 | 24.6 | 41.8 | 45.2 | -18.2 | 18.0 | 0.562 | 0.142 | 0.462 | 0.963 | 0.980 | 0.602 | |||
| CMIP6_001 | [-] | 18.0 | 18.3 | 41.9 | 41.5 | -24.3 | 26.9 | 0.352 | 0.0367 | 0.290 | 0.977 | 0.955 | 0.510 | |||
| LE2_001 | [-] | 18.7 | 19.0 | 41.9 | 41.5 | -23.6 | 25.7 | 0.338 | 0.0413 | 0.330 | 0.977 | 0.955 | 0.527 |
Download Data |
Period Mean (original grids) [Watt m-2] |
Model Period Mean (intersection) [Watt m-2] |
Benchmark Period Mean (intersection) [Watt m-2] |
Model Period Mean (complement) [Watt m-2] |
Benchmark Period Mean (complement) [Watt m-2] |
Bias [Watt m-2] |
RMSE [Watt m-2] |
Phase Shift [months] |
Bias Score [1] |
RMSE Score [1] |
Seasonal Cycle Score [1] |
Spatial Distribution Score [1] |
Overall Score [1] |
|||
|---|---|---|---|---|---|---|---|---|---|---|---|---|---|---|---|---|
| Benchmark | [-] | 96.5 | ||||||||||||||
| CESM3_092H | [-] | 106. | 106. | 95.5 | 153. | 9.83 | 26.6 | 0.532 | 0.219 | 0.511 | 0.959 | 0.789 | 0.598 | |||
| CESM3_098bH | [-] | 101. | 101. | 95.5 | 153. | 5.06 | 23.8 | 0.485 | 0.298 | 0.556 | 0.961 | 0.758 | 0.626 | |||
| CMIP6_001 | [-] | 105. | 105. | 93.2 | 138. | 12.4 | 24.6 | 0.515 | 0.222 | 0.500 | 0.962 | 0.794 | 0.595 | |||
| LE2_001 | [-] | 105. | 105. | 93.2 | 138. | 12.0 | 24.3 | 0.483 | 0.228 | 0.501 | 0.963 | 0.786 | 0.596 |
Download Data |
Period Mean (original grids) [Watt m-2] |
Model Period Mean (intersection) [Watt m-2] |
Benchmark Period Mean (intersection) [Watt m-2] |
Model Period Mean (complement) [Watt m-2] |
Benchmark Period Mean (complement) [Watt m-2] |
Bias [Watt m-2] |
RMSE [Watt m-2] |
Phase Shift [months] |
Bias Score [1] |
RMSE Score [1] |
Seasonal Cycle Score [1] |
Spatial Distribution Score [1] |
Overall Score [1] |
|||
|---|---|---|---|---|---|---|---|---|---|---|---|---|---|---|---|---|
| Benchmark | [-] | 64.4 | ||||||||||||||
| CESM3_092H | [-] | 62.1 | 62.0 | 63.9 | 94.3 | -0.668 | 17.7 | 0.339 | 0.433 | 0.406 | 0.978 | 0.986 | 0.642 | |||
| CESM3_098bH | [-] | 60.2 | 60.2 | 63.9 | 94.3 | -2.52 | 16.8 | 0.357 | 0.511 | 0.440 | 0.976 | 0.974 | 0.668 | |||
| CMIP6_001 | [-] | 61.1 | 61.1 | 61.9 | 90.5 | 0.693 | 15.7 | 0.324 | 0.479 | 0.473 | 0.979 | 0.980 | 0.677 | |||
| LE2_001 | [-] | 61.3 | 61.3 | 61.9 | 90.5 | 0.827 | 15.6 | 0.338 | 0.474 | 0.478 | 0.978 | 0.980 | 0.677 |
Download Data |
Period Mean (original grids) [Watt m-2] |
Model Period Mean (intersection) [Watt m-2] |
Benchmark Period Mean (intersection) [Watt m-2] |
Model Period Mean (complement) [Watt m-2] |
Benchmark Period Mean (complement) [Watt m-2] |
Bias [Watt m-2] |
RMSE [Watt m-2] |
Phase Shift [months] |
Bias Score [1] |
RMSE Score [1] |
Seasonal Cycle Score [1] |
Spatial Distribution Score [1] |
Overall Score [1] |
|||
|---|---|---|---|---|---|---|---|---|---|---|---|---|---|---|---|---|
| Benchmark | [-] | 79.1 | ||||||||||||||
| CESM3_092H | [-] | 72.6 | 72.6 | 78.5 | 142. | -4.14 | 21.3 | 0.838 | 0.381 | 0.470 | 0.905 | 0.914 | 0.628 | |||
| CESM3_098bH | [-] | 70.1 | 70.1 | 78.5 | 142. | -6.62 | 20.6 | 0.856 | 0.407 | 0.491 | 0.902 | 0.927 | 0.644 | |||
| CMIP6_001 | [-] | 71.8 | 71.8 | 76.7 | 126. | -3.19 | 21.5 | 0.839 | 0.360 | 0.458 | 0.899 | 0.883 | 0.612 | |||
| LE2_001 | [-] | 71.8 | 71.8 | 76.7 | 126. | -3.14 | 21.5 | 0.842 | 0.360 | 0.457 | 0.900 | 0.884 | 0.611 |
Download Data |
Period Mean (original grids) [Watt m-2] |
Model Period Mean (intersection) [Watt m-2] |
Benchmark Period Mean (intersection) [Watt m-2] |
Model Period Mean (complement) [Watt m-2] |
Benchmark Period Mean (complement) [Watt m-2] |
Bias [Watt m-2] |
RMSE [Watt m-2] |
Phase Shift [months] |
Bias Score [1] |
RMSE Score [1] |
Seasonal Cycle Score [1] |
Spatial Distribution Score [1] |
Overall Score [1] |
|||
|---|---|---|---|---|---|---|---|---|---|---|---|---|---|---|---|---|
| Benchmark | [-] | 54.9 | ||||||||||||||
| CESM3_092H | [-] | 63.2 | 63.4 | 54.3 | 157. | 10.9 | 27.9 | 1.20 | 0.199 | 0.467 | 0.854 | 0.570 | 0.512 | |||
| CESM3_098bH | [-] | 59.7 | 59.8 | 54.3 | 157. | 7.39 | 25.6 | 1.20 | 0.284 | 0.490 | 0.853 | 0.543 | 0.532 | |||
| CMIP6_001 | [-] | 64.7 | 64.8 | 51.4 | 144. | 15.0 | 27.7 | 1.29 | 0.203 | 0.446 | 0.848 | 0.759 | 0.540 | |||
| LE2_001 | [-] | 65.0 | 65.1 | 51.4 | 144. | 15.3 | 27.9 | 1.27 | 0.196 | 0.447 | 0.849 | 0.756 | 0.539 |
Download Data |
Period Mean (original grids) [Watt m-2] |
Model Period Mean (intersection) [Watt m-2] |
Benchmark Period Mean (intersection) [Watt m-2] |
Model Period Mean (complement) [Watt m-2] |
Benchmark Period Mean (complement) [Watt m-2] |
Bias [Watt m-2] |
RMSE [Watt m-2] |
Phase Shift [months] |
Bias Score [1] |
RMSE Score [1] |
Seasonal Cycle Score [1] |
Spatial Distribution Score [1] |
Overall Score [1] |
|||
|---|---|---|---|---|---|---|---|---|---|---|---|---|---|---|---|---|
| Benchmark | [-] | 44.9 | ||||||||||||||
| CESM3_092H | [-] | 28.3 | 28.1 | 44.9 | 44.6 | -17.9 | 20.5 | 0.221 | 0.129 | 0.463 | 0.985 | 0.975 | 0.603 | |||
| CESM3_098bH | [-] | 28.9 | 28.7 | 44.9 | 44.6 | -17.3 | 20.1 | 0.224 | 0.145 | 0.462 | 0.985 | 0.980 | 0.607 | |||
| CMIP6_001 | [-] | 23.6 | 23.6 | 44.8 | 45.6 | -22.4 | 26.7 | 0.262 | 0.0709 | 0.331 | 0.983 | 0.927 | 0.529 | |||
| LE2_001 | [-] | 23.9 | 23.8 | 44.8 | 45.6 | -22.1 | 26.6 | 0.271 | 0.0748 | 0.329 | 0.982 | 0.924 | 0.528 |
Download Data |
Period Mean (original grids) [Watt m-2] |
Model Period Mean (intersection) [Watt m-2] |
Benchmark Period Mean (intersection) [Watt m-2] |
Model Period Mean (complement) [Watt m-2] |
Benchmark Period Mean (complement) [Watt m-2] |
Bias [Watt m-2] |
RMSE [Watt m-2] |
Phase Shift [months] |
Bias Score [1] |
RMSE Score [1] |
Seasonal Cycle Score [1] |
Spatial Distribution Score [1] |
Overall Score [1] |
|||
|---|---|---|---|---|---|---|---|---|---|---|---|---|---|---|---|---|
| Benchmark | [-] | 134. | ||||||||||||||
| CESM3_092H | [-] | 121. | 121. | 133. | 172. | -8.14 | 22.2 | 1.03 | 0.438 | 0.610 | 0.875 | 0.641 | 0.635 | |||
| CESM3_098bH | [-] | 117. | 118. | 133. | 172. | -11.6 | 23.2 | 1.10 | 0.450 | 0.608 | 0.865 | 0.611 | 0.629 | |||
| CMIP6_001 | [-] | 122. | 123. | 127. | 169. | -0.434 | 20.3 | 1.11 | 0.405 | 0.561 | 0.870 | 0.841 | 0.647 | |||
| LE2_001 | [-] | 122. | 123. | 127. | 169. | -0.534 | 20.2 | 1.12 | 0.408 | 0.562 | 0.866 | 0.839 | 0.647 |
Download Data |
Period Mean (original grids) [Watt m-2] |
Model Period Mean (intersection) [Watt m-2] |
Benchmark Period Mean (intersection) [Watt m-2] |
Model Period Mean (complement) [Watt m-2] |
Benchmark Period Mean (complement) [Watt m-2] |
Bias [Watt m-2] |
RMSE [Watt m-2] |
Phase Shift [months] |
Bias Score [1] |
RMSE Score [1] |
Seasonal Cycle Score [1] |
Spatial Distribution Score [1] |
Overall Score [1] |
|||
|---|---|---|---|---|---|---|---|---|---|---|---|---|---|---|---|---|
| Benchmark | [-] | 99.6 | ||||||||||||||
| CESM3_092H | [-] | 91.6 | 91.8 | 99.1 | 142. | -5.12 | 16.2 | 0.694 | 0.627 | 0.382 | 0.949 | 0.999 | 0.668 | |||
| CESM3_098bH | [-] | 89.7 | 89.9 | 99.1 | 142. | -7.11 | 15.4 | 0.646 | 0.561 | 0.457 | 0.955 | 0.996 | 0.685 | |||
| CMIP6_001 | [-] | 88.7 | 88.9 | 97.8 | 136. | -7.21 | 14.9 | 0.409 | 0.498 | 0.494 | 0.971 | 0.989 | 0.689 | |||
| LE2_001 | [-] | 88.7 | 88.8 | 97.8 | 136. | -7.27 | 15.6 | 0.540 | 0.491 | 0.460 | 0.964 | 0.989 | 0.673 |
Download Data |
Period Mean (original grids) [Watt m-2] |
Model Period Mean (intersection) [Watt m-2] |
Benchmark Period Mean (intersection) [Watt m-2] |
Model Period Mean (complement) [Watt m-2] |
Benchmark Period Mean (complement) [Watt m-2] |
Bias [Watt m-2] |
RMSE [Watt m-2] |
Phase Shift [months] |
Bias Score [1] |
RMSE Score [1] |
Seasonal Cycle Score [1] |
Spatial Distribution Score [1] |
Overall Score [1] |
|||
|---|---|---|---|---|---|---|---|---|---|---|---|---|---|---|---|---|
| Benchmark | [-] | 72.2 | ||||||||||||||
| CESM3_092H | [-] | 60.7 | 60.9 | 72.2 | 96.6 | -10.9 | 18.1 | 0.490 | 0.317 | 0.424 | 0.966 | 0.995 | 0.625 | |||
| CESM3_098bH | [-] | 60.0 | 60.2 | 72.2 | 96.6 | -11.5 | 17.8 | 0.467 | 0.284 | 0.461 | 0.967 | 0.998 | 0.634 | |||
| CMIP6_001 | [-] | 61.0 | 61.0 | 72.0 | 77.2 | -10.7 | 17.3 | 0.293 | 0.338 | 0.483 | 0.980 | 0.991 | 0.655 | |||
| LE2_001 | [-] | 61.1 | 61.1 | 72.0 | 77.2 | -10.6 | 17.3 | 0.337 | 0.343 | 0.476 | 0.976 | 0.989 | 0.652 |
Download Data |
Period Mean (original grids) [Watt m-2] |
Model Period Mean (intersection) [Watt m-2] |
Benchmark Period Mean (intersection) [Watt m-2] |
Model Period Mean (complement) [Watt m-2] |
Benchmark Period Mean (complement) [Watt m-2] |
Bias [Watt m-2] |
RMSE [Watt m-2] |
Phase Shift [months] |
Bias Score [1] |
RMSE Score [1] |
Seasonal Cycle Score [1] |
Spatial Distribution Score [1] |
Overall Score [1] |
|||
|---|---|---|---|---|---|---|---|---|---|---|---|---|---|---|---|---|
| Benchmark | [-] | 81.6 | ||||||||||||||
| CESM3_092H | [-] | 81.1 | 81.5 | 81.6 | 124. | 0.563 | 17.9 | 0.423 | 0.563 | 0.341 | 0.968 | 0.946 | 0.632 | |||
| CESM3_098bH | [-] | 79.9 | 80.2 | 81.6 | 124. | -0.739 | 16.8 | 0.440 | 0.550 | 0.398 | 0.967 | 0.928 | 0.648 | |||
| CMIP6_001 | [-] | 77.8 | 78.1 | 81.1 | 116. | -2.25 | 17.7 | 0.562 | 0.426 | 0.409 | 0.959 | 0.977 | 0.636 | |||
| LE2_001 | [-] | 77.6 | 78.0 | 81.1 | 116. | -2.35 | 18.1 | 0.477 | 0.417 | 0.395 | 0.965 | 0.985 | 0.631 |
Download Data |
Period Mean (original grids) [Watt m-2] |
Model Period Mean (intersection) [Watt m-2] |
Benchmark Period Mean (intersection) [Watt m-2] |
Model Period Mean (complement) [Watt m-2] |
Benchmark Period Mean (complement) [Watt m-2] |
Bias [Watt m-2] |
RMSE [Watt m-2] |
Phase Shift [months] |
Bias Score [1] |
RMSE Score [1] |
Seasonal Cycle Score [1] |
Spatial Distribution Score [1] |
Overall Score [1] |
|||
|---|---|---|---|---|---|---|---|---|---|---|---|---|---|---|---|---|
| Benchmark | [-] | 132. | ||||||||||||||
| CESM3_092H | [-] | 134. | 134. | 132. | 185. | 2.79 | 14.0 | 1.57 | 0.655 | 0.652 | 0.767 | 0.643 | 0.674 | |||
| CESM3_098bH | [-] | 132. | 132. | 132. | 185. | 0.271 | 13.7 | 1.49 | 0.670 | 0.664 | 0.783 | 0.617 | 0.680 | |||
| CMIP6_001 | [-] | 138. | 138. | 131. | 178. | 7.87 | 15.3 | 1.47 | 0.527 | 0.649 | 0.783 | 0.895 | 0.701 | |||
| LE2_001 | [-] | 138. | 138. | 131. | 178. | 7.79 | 15.5 | 1.42 | 0.528 | 0.638 | 0.794 | 0.895 | 0.698 |
Download Data |
Period Mean (original grids) [Watt m-2] |
Model Period Mean (intersection) [Watt m-2] |
Benchmark Period Mean (intersection) [Watt m-2] |
Model Period Mean (complement) [Watt m-2] |
Benchmark Period Mean (complement) [Watt m-2] |
Bias [Watt m-2] |
RMSE [Watt m-2] |
Phase Shift [months] |
Bias Score [1] |
RMSE Score [1] |
Seasonal Cycle Score [1] |
Spatial Distribution Score [1] |
Overall Score [1] |
|||
|---|---|---|---|---|---|---|---|---|---|---|---|---|---|---|---|---|
| Benchmark | [-] | 117. | ||||||||||||||
| CESM3_092H | [-] | 119. | 119. | 117. | 149. | 2.19 | 13.8 | 0.992 | 0.604 | 0.584 | 0.880 | 0.997 | 0.730 | |||
| CESM3_098bH | [-] | 115. | 115. | 117. | 149. | -2.26 | 12.4 | 0.836 | 0.664 | 0.636 | 0.897 | 0.985 | 0.764 | |||
| CMIP6_001 | [-] | 116. | 116. | 117. | 145. | -0.576 | 12.4 | 1.26 | 0.633 | 0.641 | 0.827 | 0.982 | 0.745 | |||
| LE2_001 | [-] | 116. | 116. | 117. | 145. | -0.587 | 12.7 | 1.21 | 0.622 | 0.636 | 0.840 | 0.977 | 0.742 |
Download Data |
Period Mean (original grids) [Watt m-2] |
Model Period Mean (intersection) [Watt m-2] |
Benchmark Period Mean (intersection) [Watt m-2] |
Model Period Mean (complement) [Watt m-2] |
Benchmark Period Mean (complement) [Watt m-2] |
Bias [Watt m-2] |
RMSE [Watt m-2] |
Phase Shift [months] |
Bias Score [1] |
RMSE Score [1] |
Seasonal Cycle Score [1] |
Spatial Distribution Score [1] |
Overall Score [1] |
|||
|---|---|---|---|---|---|---|---|---|---|---|---|---|---|---|---|---|
| Benchmark | [-] | 95.7 | ||||||||||||||
| CESM3_092H | [-] | 95.0 | 94.4 | 95.0 | 143. | -0.895 | 21.1 | 0.623 | 0.408 | 0.547 | 0.931 | 0.981 | 0.683 | |||
| CESM3_098bH | [-] | 92.7 | 92.1 | 95.0 | 143. | -3.23 | 20.9 | 0.624 | 0.429 | 0.555 | 0.933 | 0.972 | 0.689 | |||
| CMIP6_001 | [-] | 98.5 | 98.0 | 92.5 | 124. | 4.36 | 21.2 | 0.760 | 0.354 | 0.493 | 0.905 | 0.956 | 0.640 | |||
| LE2_001 | [-] | 98.3 | 97.8 | 92.5 | 124. | 4.20 | 21.1 | 0.663 | 0.360 | 0.498 | 0.921 | 0.956 | 0.647 |
Temporally integrated period mean