Mean State
Download Data |
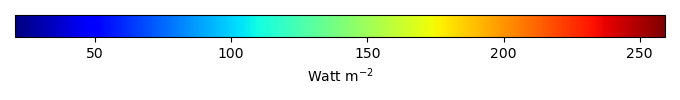
Period Mean (original grids) [Watt m-2] |
Model Period Mean (intersection) [Watt m-2] |
Benchmark Period Mean (intersection) [Watt m-2] |
Model Period Mean (complement) [Watt m-2] |
Benchmark Period Mean (complement) [Watt m-2] |
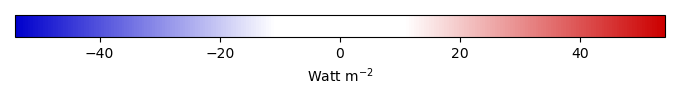
Bias [Watt m-2] |
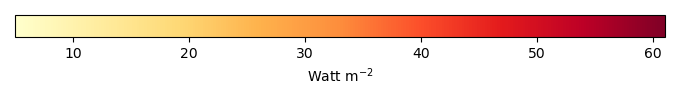
RMSE [Watt m-2] |
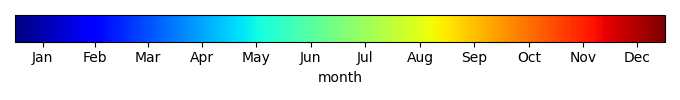
Phase Shift [months] |
Bias Score [1] |
RMSE Score [1] |
Seasonal Cycle Score [1] |
Spatial Distribution Score [1] |
Overall Score [1] |
|||
|---|---|---|---|---|---|---|---|---|---|---|---|---|---|---|---|---|
| Benchmark | [-] | 179. | ||||||||||||||
| CESM3_092H | [-] | 179. | 178. | 178. | 218. | -0.807 | 19.7 | 0.808 | 0.485 | 0.583 | 0.907 | 0.914 | 0.694 | |||
| CESM3_098bH | [-] | 173. | 173. | 178. | 218. | -6.50 | 21.6 | 0.846 | 0.346 | 0.591 | 0.907 | 0.891 | 0.665 | |||
| CMIP6_001 | [-] | 176. | 176. | 177. | 216. | -0.676 | 18.1 | 1.20 | 0.518 | 0.536 | 0.833 | 0.980 | 0.680 | |||
| LE2_001 | [-] | 176. | 175. | 177. | 216. | -1.21 | 18.7 | 1.29 | 0.500 | 0.519 | 0.827 | 0.975 | 0.668 |
Download Data |
Period Mean (original grids) [Watt m-2] |
Model Period Mean (intersection) [Watt m-2] |
Benchmark Period Mean (intersection) [Watt m-2] |
Model Period Mean (complement) [Watt m-2] |
Benchmark Period Mean (complement) [Watt m-2] |
Bias [Watt m-2] |
RMSE [Watt m-2] |
Phase Shift [months] |
Bias Score [1] |
RMSE Score [1] |
Seasonal Cycle Score [1] |
Spatial Distribution Score [1] |
Overall Score [1] |
|||
|---|---|---|---|---|---|---|---|---|---|---|---|---|---|---|---|---|
| Benchmark | [-] | 189. | ||||||||||||||
| CESM3_092H | [-] | 196. | 196. | 189. | 210. | 7.57 | 17.7 | 0.505 | 0.437 | 0.550 | 0.964 | 0.968 | 0.694 | |||
| CESM3_098bH | [-] | 184. | 185. | 189. | 210. | -3.98 | 16.5 | 0.692 | 0.482 | 0.583 | 0.939 | 0.894 | 0.696 | |||
| CMIP6_001 | [-] | 188. | 188. | 188. | 224. | 0.205 | 14.3 | 0.652 | 0.552 | 0.598 | 0.930 | 0.999 | 0.735 | |||
| LE2_001 | [-] | 187. | 188. | 188. | 224. | -0.337 | 14.7 | 0.609 | 0.536 | 0.588 | 0.937 | 0.999 | 0.730 |
Download Data |
Period Mean (original grids) [Watt m-2] |
Model Period Mean (intersection) [Watt m-2] |
Benchmark Period Mean (intersection) [Watt m-2] |
Model Period Mean (complement) [Watt m-2] |
Benchmark Period Mean (complement) [Watt m-2] |
Bias [Watt m-2] |
RMSE [Watt m-2] |
Phase Shift [months] |
Bias Score [1] |
RMSE Score [1] |
Seasonal Cycle Score [1] |
Spatial Distribution Score [1] |
Overall Score [1] |
|||
|---|---|---|---|---|---|---|---|---|---|---|---|---|---|---|---|---|
| Benchmark | [-] | 194. | ||||||||||||||
| CESM3_092H | [-] | 204. | 204. | 193. | 223. | 9.64 | 23.0 | 0.995 | 0.299 | 0.462 | 0.882 | 0.998 | 0.621 | |||
| CESM3_098bH | [-] | 202. | 202. | 193. | 223. | 7.69 | 22.0 | 0.937 | 0.344 | 0.477 | 0.899 | 0.998 | 0.639 | |||
| CMIP6_001 | [-] | 195. | 195. | 192. | 221. | 2.23 | 20.9 | 0.898 | 0.507 | 0.444 | 0.901 | 0.986 | 0.656 | |||
| LE2_001 | [-] | 194. | 194. | 192. | 221. | 1.69 | 20.8 | 0.966 | 0.522 | 0.442 | 0.896 | 0.987 | 0.657 |
Download Data |
Period Mean (original grids) [Watt m-2] |
Model Period Mean (intersection) [Watt m-2] |
Benchmark Period Mean (intersection) [Watt m-2] |
Model Period Mean (complement) [Watt m-2] |
Benchmark Period Mean (complement) [Watt m-2] |
Bias [Watt m-2] |
RMSE [Watt m-2] |
Phase Shift [months] |
Bias Score [1] |
RMSE Score [1] |
Seasonal Cycle Score [1] |
Spatial Distribution Score [1] |
Overall Score [1] |
|||
|---|---|---|---|---|---|---|---|---|---|---|---|---|---|---|---|---|
| Benchmark | [-] | 81.3 | ||||||||||||||
| CESM3_092H | [-] | 64.6 | 64.7 | 81.3 | 84.8 | -16.7 | 21.4 | 0.219 | 0.219 | 0.385 | 0.986 | 0.886 | 0.572 | |||
| CESM3_098bH | [-] | 64.4 | 64.5 | 81.3 | 84.8 | -17.0 | 22.4 | 0.216 | 0.204 | 0.350 | 0.986 | 0.915 | 0.561 | |||
| CMIP6_001 | [-] | 60.0 | 60.1 | 80.9 | 86.2 | -21.8 | 27.6 | 0.357 | 0.113 | 0.307 | 0.976 | 0.782 | 0.497 | |||
| LE2_001 | [-] | 58.8 | 59.0 | 80.9 | 86.2 | -22.8 | 28.3 | 0.386 | 0.0914 | 0.303 | 0.974 | 0.787 | 0.492 |
Download Data |
Period Mean (original grids) [Watt m-2] |
Model Period Mean (intersection) [Watt m-2] |
Benchmark Period Mean (intersection) [Watt m-2] |
Model Period Mean (complement) [Watt m-2] |
Benchmark Period Mean (complement) [Watt m-2] |
Bias [Watt m-2] |
RMSE [Watt m-2] |
Phase Shift [months] |
Bias Score [1] |
RMSE Score [1] |
Seasonal Cycle Score [1] |
Spatial Distribution Score [1] |
Overall Score [1] |
|||
|---|---|---|---|---|---|---|---|---|---|---|---|---|---|---|---|---|
| Benchmark | [-] | 189. | ||||||||||||||
| CESM3_092H | [-] | 167. | 166. | 188. | 215. | -15.7 | 22.3 | 1.21 | 0.540 | 0.668 | 0.850 | 0.687 | 0.683 | |||
| CESM3_098bH | [-] | 161. | 161. | 188. | 215. | -20.7 | 25.8 | 1.46 | 0.438 | 0.658 | 0.805 | 0.713 | 0.655 | |||
| CMIP6_001 | [-] | 164. | 164. | 183. | 210. | -12.9 | 22.1 | 1.58 | 0.512 | 0.585 | 0.783 | 0.914 | 0.676 | |||
| LE2_001 | [-] | 165. | 164. | 183. | 210. | -12.5 | 22.2 | 1.48 | 0.508 | 0.582 | 0.800 | 0.928 | 0.680 |
Download Data |
Period Mean (original grids) [Watt m-2] |
Model Period Mean (intersection) [Watt m-2] |
Benchmark Period Mean (intersection) [Watt m-2] |
Model Period Mean (complement) [Watt m-2] |
Benchmark Period Mean (complement) [Watt m-2] |
Bias [Watt m-2] |
RMSE [Watt m-2] |
Phase Shift [months] |
Bias Score [1] |
RMSE Score [1] |
Seasonal Cycle Score [1] |
Spatial Distribution Score [1] |
Overall Score [1] |
|||
|---|---|---|---|---|---|---|---|---|---|---|---|---|---|---|---|---|
| Benchmark | [-] | 105. | ||||||||||||||
| CESM3_092H | [-] | 102. | 102. | 105. | 130. | -2.30 | 13.1 | 0.553 | 0.600 | 0.557 | 0.961 | 0.898 | 0.715 | |||
| CESM3_098bH | [-] | 100. | 99.9 | 105. | 130. | -4.16 | 13.4 | 0.512 | 0.585 | 0.553 | 0.965 | 0.921 | 0.715 | |||
| CMIP6_001 | [-] | 96.3 | 96.2 | 104. | 127. | -7.66 | 14.9 | 0.388 | 0.482 | 0.542 | 0.974 | 0.838 | 0.676 | |||
| LE2_001 | [-] | 97.8 | 97.7 | 104. | 127. | -6.17 | 13.4 | 0.345 | 0.547 | 0.582 | 0.977 | 0.862 | 0.710 |
Download Data |
Period Mean (original grids) [Watt m-2] |
Model Period Mean (intersection) [Watt m-2] |
Benchmark Period Mean (intersection) [Watt m-2] |
Model Period Mean (complement) [Watt m-2] |
Benchmark Period Mean (complement) [Watt m-2] |
Bias [Watt m-2] |
RMSE [Watt m-2] |
Phase Shift [months] |
Bias Score [1] |
RMSE Score [1] |
Seasonal Cycle Score [1] |
Spatial Distribution Score [1] |
Overall Score [1] |
|||
|---|---|---|---|---|---|---|---|---|---|---|---|---|---|---|---|---|
| Benchmark | [-] | 140. | ||||||||||||||
| CESM3_092H | [-] | 153. | 153. | 140. | 166. | 13.1 | 23.5 | 0.621 | 0.184 | 0.352 | 0.942 | 0.959 | 0.558 | |||
| CESM3_098bH | [-] | 150. | 150. | 140. | 166. | 10.3 | 21.5 | 0.655 | 0.242 | 0.373 | 0.937 | 0.945 | 0.574 | |||
| CMIP6_001 | [-] | 148. | 148. | 139. | 162. | 8.72 | 20.4 | 0.553 | 0.299 | 0.382 | 0.953 | 0.996 | 0.603 | |||
| LE2_001 | [-] | 148. | 147. | 139. | 162. | 8.00 | 20.2 | 0.570 | 0.317 | 0.381 | 0.952 | 0.994 | 0.605 |
Download Data |
Period Mean (original grids) [Watt m-2] |
Model Period Mean (intersection) [Watt m-2] |
Benchmark Period Mean (intersection) [Watt m-2] |
Model Period Mean (complement) [Watt m-2] |
Benchmark Period Mean (complement) [Watt m-2] |
Bias [Watt m-2] |
RMSE [Watt m-2] |
Phase Shift [months] |
Bias Score [1] |
RMSE Score [1] |
Seasonal Cycle Score [1] |
Spatial Distribution Score [1] |
Overall Score [1] |
|||
|---|---|---|---|---|---|---|---|---|---|---|---|---|---|---|---|---|
| Benchmark | [-] | 180. | ||||||||||||||
| CESM3_092H | [-] | 183. | 183. | 180. | 216. | 3.32 | 23.3 | 0.575 | 0.402 | 0.430 | 0.956 | 0.969 | 0.637 | |||
| CESM3_098bH | [-] | 178. | 178. | 180. | 216. | -1.89 | 21.7 | 0.493 | 0.481 | 0.479 | 0.962 | 0.928 | 0.666 | |||
| CMIP6_001 | [-] | 180. | 180. | 178. | 210. | 3.31 | 23.1 | 0.569 | 0.430 | 0.386 | 0.955 | 0.990 | 0.630 | |||
| LE2_001 | [-] | 180. | 180. | 178. | 210. | 3.10 | 23.3 | 0.549 | 0.432 | 0.380 | 0.958 | 0.993 | 0.629 |
Download Data |
Period Mean (original grids) [Watt m-2] |
Model Period Mean (intersection) [Watt m-2] |
Benchmark Period Mean (intersection) [Watt m-2] |
Model Period Mean (complement) [Watt m-2] |
Benchmark Period Mean (complement) [Watt m-2] |
Bias [Watt m-2] |
RMSE [Watt m-2] |
Phase Shift [months] |
Bias Score [1] |
RMSE Score [1] |
Seasonal Cycle Score [1] |
Spatial Distribution Score [1] |
Overall Score [1] |
|||
|---|---|---|---|---|---|---|---|---|---|---|---|---|---|---|---|---|
| Benchmark | [-] | 74.6 | ||||||||||||||
| CESM3_092H | [-] | 60.2 | 60.6 | 74.5 | 81.8 | -15.4 | 18.3 | 0.444 | 0.274 | 0.359 | 0.971 | 0.951 | 0.583 | |||
| CESM3_098bH | [-] | 58.9 | 59.4 | 74.5 | 81.8 | -16.5 | 19.8 | 0.492 | 0.239 | 0.326 | 0.967 | 0.950 | 0.562 | |||
| CMIP6_001 | [-] | 46.6 | 47.0 | 74.6 | 74.8 | -28.7 | 33.8 | 0.361 | 0.0428 | 0.174 | 0.976 | 0.827 | 0.439 | |||
| LE2_001 | [-] | 47.9 | 48.3 | 74.6 | 74.8 | -27.4 | 31.6 | 0.363 | 0.0487 | 0.208 | 0.976 | 0.819 | 0.452 |
Download Data |
Period Mean (original grids) [Watt m-2] |
Model Period Mean (intersection) [Watt m-2] |
Benchmark Period Mean (intersection) [Watt m-2] |
Model Period Mean (complement) [Watt m-2] |
Benchmark Period Mean (complement) [Watt m-2] |
Bias [Watt m-2] |
RMSE [Watt m-2] |
Phase Shift [months] |
Bias Score [1] |
RMSE Score [1] |
Seasonal Cycle Score [1] |
Spatial Distribution Score [1] |
Overall Score [1] |
|||
|---|---|---|---|---|---|---|---|---|---|---|---|---|---|---|---|---|
| Benchmark | [-] | 193. | ||||||||||||||
| CESM3_092H | [-] | 202. | 202. | 193. | 219. | 4.80 | 20.3 | 0.415 | 0.313 | 0.509 | 0.971 | 0.961 | 0.653 | |||
| CESM3_098bH | [-] | 201. | 201. | 193. | 219. | 3.32 | 20.1 | 0.422 | 0.335 | 0.514 | 0.971 | 0.961 | 0.659 | |||
| CMIP6_001 | [-] | 197. | 197. | 193. | 202. | 2.00 | 17.5 | 0.580 | 0.439 | 0.517 | 0.961 | 0.981 | 0.683 | |||
| LE2_001 | [-] | 198. | 198. | 193. | 202. | 2.72 | 17.7 | 0.512 | 0.422 | 0.513 | 0.966 | 0.977 | 0.678 |
Download Data |
Period Mean (original grids) [Watt m-2] |
Model Period Mean (intersection) [Watt m-2] |
Benchmark Period Mean (intersection) [Watt m-2] |
Model Period Mean (complement) [Watt m-2] |
Benchmark Period Mean (complement) [Watt m-2] |
Bias [Watt m-2] |
RMSE [Watt m-2] |
Phase Shift [months] |
Bias Score [1] |
RMSE Score [1] |
Seasonal Cycle Score [1] |
Spatial Distribution Score [1] |
Overall Score [1] |
|||
|---|---|---|---|---|---|---|---|---|---|---|---|---|---|---|---|---|
| Benchmark | [-] | 120. | ||||||||||||||
| CESM3_092H | [-] | 124. | 124. | 120. | 157. | 7.57 | 20.4 | 0.256 | 0.260 | 0.382 | 0.982 | 0.982 | 0.598 | |||
| CESM3_098bH | [-] | 122. | 122. | 120. | 157. | 5.50 | 18.9 | 0.279 | 0.292 | 0.418 | 0.978 | 0.989 | 0.619 | |||
| CMIP6_001 | [-] | 119. | 119. | 117. | 151. | 4.27 | 17.7 | 0.364 | 0.313 | 0.475 | 0.976 | 0.944 | 0.637 | |||
| LE2_001 | [-] | 120. | 120. | 117. | 151. | 5.05 | 17.7 | 0.321 | 0.293 | 0.490 | 0.979 | 0.942 | 0.639 |
Download Data |
Period Mean (original grids) [Watt m-2] |
Model Period Mean (intersection) [Watt m-2] |
Benchmark Period Mean (intersection) [Watt m-2] |
Model Period Mean (complement) [Watt m-2] |
Benchmark Period Mean (complement) [Watt m-2] |
Bias [Watt m-2] |
RMSE [Watt m-2] |
Phase Shift [months] |
Bias Score [1] |
RMSE Score [1] |
Seasonal Cycle Score [1] |
Spatial Distribution Score [1] |
Overall Score [1] |
|||
|---|---|---|---|---|---|---|---|---|---|---|---|---|---|---|---|---|
| Benchmark | [-] | 145. | ||||||||||||||
| CESM3_092H | [-] | 146. | 146. | 144. | 197. | 1.98 | 19.9 | 0.572 | 0.339 | 0.502 | 0.944 | 0.947 | 0.647 | |||
| CESM3_098bH | [-] | 143. | 143. | 144. | 197. | -0.650 | 19.3 | 0.583 | 0.363 | 0.514 | 0.942 | 0.955 | 0.657 | |||
| CMIP6_001 | [-] | 140. | 140. | 143. | 181. | -2.13 | 19.8 | 0.608 | 0.382 | 0.487 | 0.939 | 0.942 | 0.647 | |||
| LE2_001 | [-] | 140. | 140. | 143. | 181. | -2.11 | 19.8 | 0.599 | 0.388 | 0.485 | 0.940 | 0.942 | 0.648 |
Download Data |
Period Mean (original grids) [Watt m-2] |
Model Period Mean (intersection) [Watt m-2] |
Benchmark Period Mean (intersection) [Watt m-2] |
Model Period Mean (complement) [Watt m-2] |
Benchmark Period Mean (complement) [Watt m-2] |
Bias [Watt m-2] |
RMSE [Watt m-2] |
Phase Shift [months] |
Bias Score [1] |
RMSE Score [1] |
Seasonal Cycle Score [1] |
Spatial Distribution Score [1] |
Overall Score [1] |
|||
|---|---|---|---|---|---|---|---|---|---|---|---|---|---|---|---|---|
| Benchmark | [-] | 175. | ||||||||||||||
| CESM3_092H | [-] | 182. | 182. | 175. | 233. | 7.85 | 18.8 | 0.374 | 0.339 | 0.656 | 0.971 | 0.987 | 0.722 | |||
| CESM3_098bH | [-] | 177. | 177. | 175. | 233. | 2.88 | 18.0 | 0.494 | 0.382 | 0.633 | 0.954 | 0.989 | 0.718 | |||
| CMIP6_001 | [-] | 176. | 176. | 173. | 226. | 3.26 | 17.6 | 0.659 | 0.371 | 0.633 | 0.933 | 0.996 | 0.713 | |||
| LE2_001 | [-] | 176. | 176. | 173. | 226. | 3.10 | 17.6 | 0.645 | 0.372 | 0.630 | 0.934 | 0.996 | 0.712 |
Download Data |
Period Mean (original grids) [Watt m-2] |
Model Period Mean (intersection) [Watt m-2] |
Benchmark Period Mean (intersection) [Watt m-2] |
Model Period Mean (complement) [Watt m-2] |
Benchmark Period Mean (complement) [Watt m-2] |
Bias [Watt m-2] |
RMSE [Watt m-2] |
Phase Shift [months] |
Bias Score [1] |
RMSE Score [1] |
Seasonal Cycle Score [1] |
Spatial Distribution Score [1] |
Overall Score [1] |
|||
|---|---|---|---|---|---|---|---|---|---|---|---|---|---|---|---|---|
| Benchmark | [-] | 80.0 | ||||||||||||||
| CESM3_092H | [-] | 66.9 | 66.6 | 80.0 | 78.6 | -15.1 | 20.8 | 0.262 | 0.302 | 0.375 | 0.983 | 0.919 | 0.591 | |||
| CESM3_098bH | [-] | 67.2 | 67.0 | 80.0 | 78.6 | -14.7 | 20.7 | 0.228 | 0.309 | 0.376 | 0.985 | 0.937 | 0.596 | |||
| CMIP6_001 | [-] | 53.7 | 53.6 | 79.8 | 82.9 | -27.8 | 35.4 | 0.341 | 0.0611 | 0.155 | 0.977 | 0.858 | 0.441 | |||
| LE2_001 | [-] | 54.2 | 54.1 | 79.8 | 82.9 | -27.3 | 35.3 | 0.342 | 0.0685 | 0.150 | 0.977 | 0.850 | 0.439 |
Download Data |
Period Mean (original grids) [Watt m-2] |
Model Period Mean (intersection) [Watt m-2] |
Benchmark Period Mean (intersection) [Watt m-2] |
Model Period Mean (complement) [Watt m-2] |
Benchmark Period Mean (complement) [Watt m-2] |
Bias [Watt m-2] |
RMSE [Watt m-2] |
Phase Shift [months] |
Bias Score [1] |
RMSE Score [1] |
Seasonal Cycle Score [1] |
Spatial Distribution Score [1] |
Overall Score [1] |
|||
|---|---|---|---|---|---|---|---|---|---|---|---|---|---|---|---|---|
| Benchmark | [-] | 205. | ||||||||||||||
| CESM3_092H | [-] | 202. | 202. | 204. | 226. | -1.27 | 20.4 | 0.526 | 0.381 | 0.598 | 0.942 | 0.760 | 0.656 | |||
| CESM3_098bH | [-] | 200. | 200. | 204. | 226. | -3.38 | 20.6 | 0.595 | 0.415 | 0.573 | 0.937 | 0.715 | 0.643 | |||
| CMIP6_001 | [-] | 200. | 200. | 200. | 227. | 1.08 | 21.2 | 0.646 | 0.360 | 0.503 | 0.943 | 0.839 | 0.629 | |||
| LE2_001 | [-] | 199. | 199. | 200. | 227. | 0.250 | 21.0 | 0.588 | 0.366 | 0.507 | 0.946 | 0.847 | 0.635 |
Download Data |
Period Mean (original grids) [Watt m-2] |
Model Period Mean (intersection) [Watt m-2] |
Benchmark Period Mean (intersection) [Watt m-2] |
Model Period Mean (complement) [Watt m-2] |
Benchmark Period Mean (complement) [Watt m-2] |
Bias [Watt m-2] |
RMSE [Watt m-2] |
Phase Shift [months] |
Bias Score [1] |
RMSE Score [1] |
Seasonal Cycle Score [1] |
Spatial Distribution Score [1] |
Overall Score [1] |
|||
|---|---|---|---|---|---|---|---|---|---|---|---|---|---|---|---|---|
| Benchmark | [-] | 153. | ||||||||||||||
| CESM3_092H | [-] | 166. | 166. | 152. | 202. | 15.1 | 20.3 | 0.421 | 0.112 | 0.560 | 0.971 | 0.978 | 0.636 | |||
| CESM3_098bH | [-] | 164. | 164. | 152. | 202. | 13.1 | 17.9 | 0.358 | 0.152 | 0.617 | 0.974 | 0.970 | 0.666 | |||
| CMIP6_001 | [-] | 157. | 157. | 151. | 194. | 7.54 | 13.7 | 0.256 | 0.428 | 0.625 | 0.983 | 0.998 | 0.732 | |||
| LE2_001 | [-] | 157. | 157. | 151. | 194. | 7.35 | 14.5 | 0.285 | 0.436 | 0.574 | 0.981 | 0.996 | 0.712 |
Download Data |
Period Mean (original grids) [Watt m-2] |
Model Period Mean (intersection) [Watt m-2] |
Benchmark Period Mean (intersection) [Watt m-2] |
Model Period Mean (complement) [Watt m-2] |
Benchmark Period Mean (complement) [Watt m-2] |
Bias [Watt m-2] |
RMSE [Watt m-2] |
Phase Shift [months] |
Bias Score [1] |
RMSE Score [1] |
Seasonal Cycle Score [1] |
Spatial Distribution Score [1] |
Overall Score [1] |
|||
|---|---|---|---|---|---|---|---|---|---|---|---|---|---|---|---|---|
| Benchmark | [-] | 115. | ||||||||||||||
| CESM3_092H | [-] | 117. | 118. | 115. | 142. | 2.83 | 12.1 | 0.436 | 0.569 | 0.594 | 0.971 | 0.908 | 0.727 | |||
| CESM3_098bH | [-] | 116. | 116. | 115. | 142. | 1.66 | 11.3 | 0.381 | 0.597 | 0.621 | 0.975 | 0.919 | 0.747 | |||
| CMIP6_001 | [-] | 112. | 112. | 114. | 123. | -2.49 | 13.0 | 0.457 | 0.577 | 0.575 | 0.967 | 0.882 | 0.715 | |||
| LE2_001 | [-] | 113. | 113. | 114. | 123. | -1.81 | 13.5 | 0.493 | 0.582 | 0.541 | 0.966 | 0.885 | 0.703 |
Download Data |
Period Mean (original grids) [Watt m-2] |
Model Period Mean (intersection) [Watt m-2] |
Benchmark Period Mean (intersection) [Watt m-2] |
Model Period Mean (complement) [Watt m-2] |
Benchmark Period Mean (complement) [Watt m-2] |
Bias [Watt m-2] |
RMSE [Watt m-2] |
Phase Shift [months] |
Bias Score [1] |
RMSE Score [1] |
Seasonal Cycle Score [1] |
Spatial Distribution Score [1] |
Overall Score [1] |
|||
|---|---|---|---|---|---|---|---|---|---|---|---|---|---|---|---|---|
| Benchmark | [-] | 162. | ||||||||||||||
| CESM3_092H | [-] | 175. | 175. | 162. | 181. | 13.6 | 19.4 | 0.244 | 0.210 | 0.479 | 0.984 | 0.998 | 0.630 | |||
| CESM3_098bH | [-] | 174. | 174. | 162. | 181. | 11.9 | 17.0 | 0.326 | 0.258 | 0.547 | 0.978 | 0.999 | 0.666 | |||
| CMIP6_001 | [-] | 171. | 171. | 162. | 171. | 9.55 | 15.7 | 0.283 | 0.405 | 0.526 | 0.981 | 0.988 | 0.685 | |||
| LE2_001 | [-] | 170. | 170. | 162. | 171. | 8.09 | 15.3 | 0.243 | 0.469 | 0.507 | 0.983 | 0.990 | 0.691 |
Download Data |
Period Mean (original grids) [Watt m-2] |
Model Period Mean (intersection) [Watt m-2] |
Benchmark Period Mean (intersection) [Watt m-2] |
Model Period Mean (complement) [Watt m-2] |
Benchmark Period Mean (complement) [Watt m-2] |
Bias [Watt m-2] |
RMSE [Watt m-2] |
Phase Shift [months] |
Bias Score [1] |
RMSE Score [1] |
Seasonal Cycle Score [1] |
Spatial Distribution Score [1] |
Overall Score [1] |
|||
|---|---|---|---|---|---|---|---|---|---|---|---|---|---|---|---|---|
| Benchmark | [-] | 176. | ||||||||||||||
| CESM3_092H | [-] | 185. | 185. | 175. | 232. | 10.5 | 20.3 | 1.47 | 0.422 | 0.587 | 0.802 | 0.998 | 0.679 | |||
| CESM3_098bH | [-] | 183. | 183. | 175. | 232. | 8.02 | 19.1 | 1.37 | 0.478 | 0.596 | 0.817 | 0.998 | 0.697 | |||
| CMIP6_001 | [-] | 185. | 185. | 174. | 226. | 11.2 | 21.4 | 1.40 | 0.383 | 0.546 | 0.808 | 0.999 | 0.657 | |||
| LE2_001 | [-] | 185. | 185. | 174. | 226. | 11.2 | 21.7 | 1.38 | 0.376 | 0.536 | 0.810 | 0.999 | 0.651 |
Download Data |
Period Mean (original grids) [Watt m-2] |
Model Period Mean (intersection) [Watt m-2] |
Benchmark Period Mean (intersection) [Watt m-2] |
Model Period Mean (complement) [Watt m-2] |
Benchmark Period Mean (complement) [Watt m-2] |
Bias [Watt m-2] |
RMSE [Watt m-2] |
Phase Shift [months] |
Bias Score [1] |
RMSE Score [1] |
Seasonal Cycle Score [1] |
Spatial Distribution Score [1] |
Overall Score [1] |
|||
|---|---|---|---|---|---|---|---|---|---|---|---|---|---|---|---|---|
| Benchmark | [-] | 182. | ||||||||||||||
| CESM3_092H | [-] | 197. | 197. | 182. | 207. | 14.7 | 22.1 | 0.942 | 0.232 | 0.535 | 0.899 | 0.999 | 0.640 | |||
| CESM3_098bH | [-] | 197. | 197. | 182. | 207. | 14.5 | 21.2 | 0.829 | 0.237 | 0.573 | 0.902 | 0.997 | 0.657 | |||
| CMIP6_001 | [-] | 189. | 189. | 181. | 201. | 7.18 | 16.1 | 0.864 | 0.507 | 0.614 | 0.909 | 0.974 | 0.724 | |||
| LE2_001 | [-] | 190. | 190. | 181. | 201. | 8.43 | 16.4 | 0.807 | 0.489 | 0.609 | 0.920 | 0.978 | 0.721 |
Download Data |
Period Mean (original grids) [Watt m-2] |
Model Period Mean (intersection) [Watt m-2] |
Benchmark Period Mean (intersection) [Watt m-2] |
Model Period Mean (complement) [Watt m-2] |
Benchmark Period Mean (complement) [Watt m-2] |
Bias [Watt m-2] |
RMSE [Watt m-2] |
Phase Shift [months] |
Bias Score [1] |
RMSE Score [1] |
Seasonal Cycle Score [1] |
Spatial Distribution Score [1] |
Overall Score [1] |
|||
|---|---|---|---|---|---|---|---|---|---|---|---|---|---|---|---|---|
| Benchmark | [-] | 176. | ||||||||||||||
| CESM3_092H | [-] | 181. | 180. | 175. | 198. | 3.20 | 25.7 | 0.820 | 0.240 | 0.462 | 0.892 | 0.924 | 0.596 | |||
| CESM3_098bH | [-] | 180. | 180. | 175. | 198. | 2.37 | 25.7 | 0.842 | 0.241 | 0.465 | 0.893 | 0.923 | 0.597 | |||
| CMIP6_001 | [-] | 185. | 184. | 176. | 178. | 4.23 | 26.1 | 0.954 | 0.211 | 0.471 | 0.884 | 0.963 | 0.600 | |||
| LE2_001 | [-] | 184. | 184. | 176. | 178. | 3.91 | 26.1 | 0.939 | 0.211 | 0.477 | 0.882 | 0.964 | 0.602 |
Temporally integrated period mean