Mean State
Download Data |
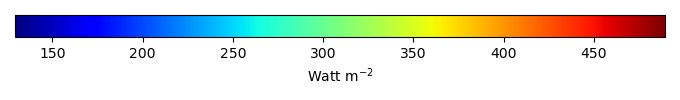
Period Mean (original grids) [Watt m-2] |
Model Period Mean (intersection) [Watt m-2] |
Benchmark Period Mean (intersection) [Watt m-2] |
Model Period Mean (complement) [Watt m-2] |
Benchmark Period Mean (complement) [Watt m-2] |
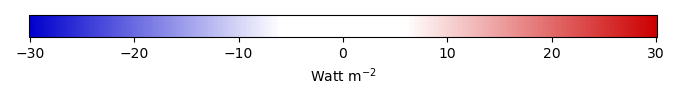
Bias [Watt m-2] |
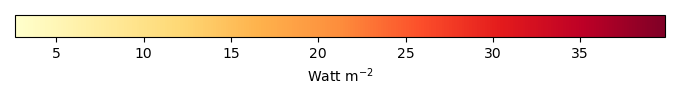
RMSE [Watt m-2] |
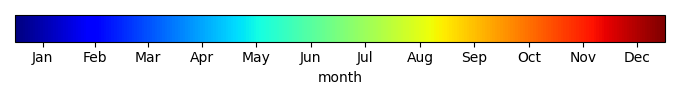
Phase Shift [months] |
Bias Score [1] |
RMSE Score [1] |
Seasonal Cycle Score [1] |
Spatial Distribution Score [1] |
Overall Score [1] |
|||
|---|---|---|---|---|---|---|---|---|---|---|---|---|---|---|---|---|
| Benchmark | [-] | 453. | ||||||||||||||
| CESM3_092H | [-] | 460. | 460. | 453. | 461. | 8.28 | 12.8 | 1.91 | 0.480 | 0.666 | 0.723 | 0.996 | 0.706 | |||
| CESM3_098bH | [-] | 459. | 459. | 453. | 461. | 7.77 | 12.2 | 1.89 | 0.491 | 0.682 | 0.726 | 0.998 | 0.716 | |||
| CMIP6_001 | [-] | 458. | 458. | 453. | 460. | 6.40 | 11.8 | 1.97 | 0.496 | 0.675 | 0.710 | 0.990 | 0.709 | |||
| LE2_001 | [-] | 458. | 458. | 453. | 460. | 6.43 | 11.9 | 1.99 | 0.499 | 0.673 | 0.707 | 0.991 | 0.709 |
Download Data |
Period Mean (original grids) [Watt m-2] |
Model Period Mean (intersection) [Watt m-2] |
Benchmark Period Mean (intersection) [Watt m-2] |
Model Period Mean (complement) [Watt m-2] |
Benchmark Period Mean (complement) [Watt m-2] |
Bias [Watt m-2] |
RMSE [Watt m-2] |
Phase Shift [months] |
Bias Score [1] |
RMSE Score [1] |
Seasonal Cycle Score [1] |
Spatial Distribution Score [1] |
Overall Score [1] |
|||
|---|---|---|---|---|---|---|---|---|---|---|---|---|---|---|---|---|
| Benchmark | [-] | 471. | ||||||||||||||
| CESM3_092H | [-] | 475. | 475. | 471. | 461. | 3.80 | 19.6 | 0.907 | 0.416 | 0.318 | 0.921 | 0.940 | 0.583 | |||
| CESM3_098bH | [-] | 474. | 474. | 471. | 461. | 2.70 | 17.8 | 0.780 | 0.431 | 0.396 | 0.934 | 0.930 | 0.617 | |||
| CMIP6_001 | [-] | 477. | 477. | 471. | 456. | 5.38 | 21.1 | 0.896 | 0.399 | 0.258 | 0.921 | 0.965 | 0.560 | |||
| LE2_001 | [-] | 476. | 477. | 471. | 456. | 5.08 | 21.3 | 0.932 | 0.402 | 0.250 | 0.916 | 0.963 | 0.556 |
Download Data |
Period Mean (original grids) [Watt m-2] |
Model Period Mean (intersection) [Watt m-2] |
Benchmark Period Mean (intersection) [Watt m-2] |
Model Period Mean (complement) [Watt m-2] |
Benchmark Period Mean (complement) [Watt m-2] |
Bias [Watt m-2] |
RMSE [Watt m-2] |
Phase Shift [months] |
Bias Score [1] |
RMSE Score [1] |
Seasonal Cycle Score [1] |
Spatial Distribution Score [1] |
Overall Score [1] |
|||
|---|---|---|---|---|---|---|---|---|---|---|---|---|---|---|---|---|
| Benchmark | [-] | 443. | ||||||||||||||
| CESM3_092H | [-] | 452. | 452. | 443. | 443. | 10.1 | 17.1 | 1.37 | 0.331 | 0.468 | 0.819 | 0.969 | 0.611 | |||
| CESM3_098bH | [-] | 452. | 452. | 443. | 443. | 9.39 | 16.8 | 1.36 | 0.347 | 0.462 | 0.822 | 0.970 | 0.613 | |||
| CMIP6_001 | [-] | 448. | 448. | 443. | 444. | 5.19 | 15.8 | 1.37 | 0.407 | 0.454 | 0.829 | 0.917 | 0.612 | |||
| LE2_001 | [-] | 448. | 448. | 443. | 444. | 5.64 | 15.9 | 1.28 | 0.403 | 0.463 | 0.844 | 0.918 | 0.618 |
Download Data |
Period Mean (original grids) [Watt m-2] |
Model Period Mean (intersection) [Watt m-2] |
Benchmark Period Mean (intersection) [Watt m-2] |
Model Period Mean (complement) [Watt m-2] |
Benchmark Period Mean (complement) [Watt m-2] |
Bias [Watt m-2] |
RMSE [Watt m-2] |
Phase Shift [months] |
Bias Score [1] |
RMSE Score [1] |
Seasonal Cycle Score [1] |
Spatial Distribution Score [1] |
Overall Score [1] |
|||
|---|---|---|---|---|---|---|---|---|---|---|---|---|---|---|---|---|
| Benchmark | [-] | 276. | ||||||||||||||
| CESM3_092H | [-] | 281. | 281. | 276. | 287. | 8.10 | 18.1 | 0.0999 | 0.342 | 0.209 | 0.993 | 0.998 | 0.550 | |||
| CESM3_098bH | [-] | 284. | 284. | 276. | 287. | 10.6 | 19.9 | 0.0887 | 0.182 | 0.168 | 0.994 | 1.00 | 0.502 | |||
| CMIP6_001 | [-] | 284. | 284. | 275. | 292. | 11.2 | 18.9 | 0.262 | 0.145 | 0.206 | 0.982 | 0.959 | 0.500 | |||
| LE2_001 | [-] | 285. | 285. | 275. | 292. | 11.9 | 19.5 | 0.248 | 0.113 | 0.197 | 0.983 | 0.965 | 0.491 |
Download Data |
Period Mean (original grids) [Watt m-2] |
Model Period Mean (intersection) [Watt m-2] |
Benchmark Period Mean (intersection) [Watt m-2] |
Model Period Mean (complement) [Watt m-2] |
Benchmark Period Mean (complement) [Watt m-2] |
Bias [Watt m-2] |
RMSE [Watt m-2] |
Phase Shift [months] |
Bias Score [1] |
RMSE Score [1] |
Seasonal Cycle Score [1] |
Spatial Distribution Score [1] |
Overall Score [1] |
|||
|---|---|---|---|---|---|---|---|---|---|---|---|---|---|---|---|---|
| Benchmark | [-] | 456. | ||||||||||||||
| CESM3_092H | [-] | 460. | 460. | 455. | 466. | 9.35 | 10.8 | 2.13 | 0.311 | 0.839 | 0.679 | 0.984 | 0.730 | |||
| CESM3_098bH | [-] | 460. | 460. | 455. | 466. | 8.60 | 10.3 | 2.26 | 0.336 | 0.834 | 0.643 | 0.984 | 0.726 | |||
| CMIP6_001 | [-] | 456. | 456. | 453. | 465. | 5.46 | 7.98 | 2.04 | 0.461 | 0.840 | 0.701 | 0.996 | 0.768 | |||
| LE2_001 | [-] | 456. | 456. | 453. | 465. | 5.73 | 8.20 | 1.87 | 0.451 | 0.839 | 0.736 | 0.993 | 0.772 |
Download Data |
Period Mean (original grids) [Watt m-2] |
Model Period Mean (intersection) [Watt m-2] |
Benchmark Period Mean (intersection) [Watt m-2] |
Model Period Mean (complement) [Watt m-2] |
Benchmark Period Mean (complement) [Watt m-2] |
Bias [Watt m-2] |
RMSE [Watt m-2] |
Phase Shift [months] |
Bias Score [1] |
RMSE Score [1] |
Seasonal Cycle Score [1] |
Spatial Distribution Score [1] |
Overall Score [1] |
|||
|---|---|---|---|---|---|---|---|---|---|---|---|---|---|---|---|---|
| Benchmark | [-] | 306. | ||||||||||||||
| CESM3_092H | [-] | 324. | 323. | 306. | 333. | 18.2 | 22.4 | 0.0800 | 0.0270 | 0.339 | 0.995 | 0.958 | 0.531 | |||
| CESM3_098bH | [-] | 326. | 326. | 306. | 333. | 20.9 | 24.6 | 0.0983 | 0.0110 | 0.348 | 0.993 | 0.950 | 0.530 | |||
| CMIP6_001 | [-] | 318. | 318. | 306. | 329. | 12.8 | 19.9 | 0.0379 | 0.0936 | 0.186 | 0.997 | 0.998 | 0.492 | |||
| LE2_001 | [-] | 320. | 320. | 306. | 329. | 14.4 | 20.5 | 0.0346 | 0.0621 | 0.213 | 0.998 | 0.999 | 0.497 |
Download Data |
Period Mean (original grids) [Watt m-2] |
Model Period Mean (intersection) [Watt m-2] |
Benchmark Period Mean (intersection) [Watt m-2] |
Model Period Mean (complement) [Watt m-2] |
Benchmark Period Mean (complement) [Watt m-2] |
Bias [Watt m-2] |
RMSE [Watt m-2] |
Phase Shift [months] |
Bias Score [1] |
RMSE Score [1] |
Seasonal Cycle Score [1] |
Spatial Distribution Score [1] |
Overall Score [1] |
|||
|---|---|---|---|---|---|---|---|---|---|---|---|---|---|---|---|---|
| Benchmark | [-] | 362. | ||||||||||||||
| CESM3_092H | [-] | 372. | 372. | 361. | 416. | 13.2 | 19.0 | 0.289 | 0.231 | 0.504 | 0.979 | 0.998 | 0.644 | |||
| CESM3_098bH | [-] | 374. | 373. | 361. | 416. | 14.7 | 20.0 | 0.333 | 0.217 | 0.504 | 0.976 | 0.999 | 0.640 | |||
| CMIP6_001 | [-] | 367. | 366. | 361. | 406. | 7.34 | 15.3 | 0.205 | 0.376 | 0.472 | 0.985 | 1.00 | 0.661 | |||
| LE2_001 | [-] | 367. | 366. | 361. | 406. | 7.64 | 15.4 | 0.209 | 0.362 | 0.484 | 0.985 | 1.00 | 0.663 |
Download Data |
Period Mean (original grids) [Watt m-2] |
Model Period Mean (intersection) [Watt m-2] |
Benchmark Period Mean (intersection) [Watt m-2] |
Model Period Mean (complement) [Watt m-2] |
Benchmark Period Mean (complement) [Watt m-2] |
Bias [Watt m-2] |
RMSE [Watt m-2] |
Phase Shift [months] |
Bias Score [1] |
RMSE Score [1] |
Seasonal Cycle Score [1] |
Spatial Distribution Score [1] |
Overall Score [1] |
|||
|---|---|---|---|---|---|---|---|---|---|---|---|---|---|---|---|---|
| Benchmark | [-] | 450. | ||||||||||||||
| CESM3_092H | [-] | 457. | 458. | 450. | 462. | 10.7 | 21.1 | 1.05 | 0.265 | 0.268 | 0.898 | 0.982 | 0.536 | |||
| CESM3_098bH | [-] | 456. | 456. | 450. | 462. | 9.27 | 19.3 | 0.915 | 0.312 | 0.307 | 0.911 | 0.988 | 0.565 | |||
| CMIP6_001 | [-] | 454. | 454. | 450. | 463. | 6.50 | 17.7 | 1.02 | 0.396 | 0.309 | 0.909 | 0.988 | 0.582 | |||
| LE2_001 | [-] | 454. | 455. | 450. | 463. | 6.88 | 18.0 | 1.01 | 0.383 | 0.303 | 0.913 | 0.986 | 0.578 |
Download Data |
Period Mean (original grids) [Watt m-2] |
Model Period Mean (intersection) [Watt m-2] |
Benchmark Period Mean (intersection) [Watt m-2] |
Model Period Mean (complement) [Watt m-2] |
Benchmark Period Mean (complement) [Watt m-2] |
Bias [Watt m-2] |
RMSE [Watt m-2] |
Phase Shift [months] |
Bias Score [1] |
RMSE Score [1] |
Seasonal Cycle Score [1] |
Spatial Distribution Score [1] |
Overall Score [1] |
|||
|---|---|---|---|---|---|---|---|---|---|---|---|---|---|---|---|---|
| Benchmark | [-] | 275. | ||||||||||||||
| CESM3_092H | [-] | 288. | 288. | 275. | 289. | 13.9 | 21.9 | 0.0655 | 0.0623 | 0.112 | 0.996 | 0.998 | 0.456 | |||
| CESM3_098bH | [-] | 290. | 291. | 275. | 289. | 16.6 | 23.4 | 0.0407 | 0.0184 | 0.133 | 0.997 | 0.996 | 0.456 | |||
| CMIP6_001 | [-] | 288. | 288. | 275. | 280. | 13.3 | 22.3 | 0.398 | 0.104 | 0.112 | 0.973 | 0.950 | 0.450 | |||
| LE2_001 | [-] | 290. | 290. | 275. | 280. | 15.6 | 23.6 | 0.332 | 0.0508 | 0.0996 | 0.978 | 0.968 | 0.439 |
Download Data |
Period Mean (original grids) [Watt m-2] |
Model Period Mean (intersection) [Watt m-2] |
Benchmark Period Mean (intersection) [Watt m-2] |
Model Period Mean (complement) [Watt m-2] |
Benchmark Period Mean (complement) [Watt m-2] |
Bias [Watt m-2] |
RMSE [Watt m-2] |
Phase Shift [months] |
Bias Score [1] |
RMSE Score [1] |
Seasonal Cycle Score [1] |
Spatial Distribution Score [1] |
Overall Score [1] |
|||
|---|---|---|---|---|---|---|---|---|---|---|---|---|---|---|---|---|
| Benchmark | [-] | 448. | ||||||||||||||
| CESM3_092H | [-] | 451. | 451. | 448. | 437. | -0.537 | 12.9 | 0.536 | 0.584 | 0.601 | 0.954 | 0.998 | 0.748 | |||
| CESM3_098bH | [-] | 449. | 449. | 448. | 437. | -1.98 | 13.0 | 0.500 | 0.569 | 0.605 | 0.961 | 0.998 | 0.747 | |||
| CMIP6_001 | [-] | 448. | 448. | 450. | 423. | -4.61 | 13.8 | 0.553 | 0.524 | 0.593 | 0.953 | 0.998 | 0.732 | |||
| LE2_001 | [-] | 448. | 448. | 450. | 423. | -4.76 | 13.6 | 0.442 | 0.523 | 0.610 | 0.963 | 0.998 | 0.741 |
Download Data |
Period Mean (original grids) [Watt m-2] |
Model Period Mean (intersection) [Watt m-2] |
Benchmark Period Mean (intersection) [Watt m-2] |
Model Period Mean (complement) [Watt m-2] |
Benchmark Period Mean (complement) [Watt m-2] |
Bias [Watt m-2] |
RMSE [Watt m-2] |
Phase Shift [months] |
Bias Score [1] |
RMSE Score [1] |
Seasonal Cycle Score [1] |
Spatial Distribution Score [1] |
Overall Score [1] |
|||
|---|---|---|---|---|---|---|---|---|---|---|---|---|---|---|---|---|
| Benchmark | [-] | 364. | ||||||||||||||
| CESM3_092H | [-] | 380. | 380. | 363. | 390. | 20.7 | 23.9 | 0.597 | 0.0504 | 0.496 | 0.960 | 0.998 | 0.600 | |||
| CESM3_098bH | [-] | 382. | 382. | 363. | 390. | 22.2 | 25.3 | 0.598 | 0.0406 | 0.489 | 0.960 | 1.00 | 0.596 | |||
| CMIP6_001 | [-] | 371. | 371. | 362. | 385. | 11.8 | 15.8 | 0.552 | 0.191 | 0.523 | 0.963 | 1.00 | 0.640 | |||
| LE2_001 | [-] | 372. | 372. | 362. | 385. | 12.7 | 16.4 | 0.453 | 0.165 | 0.519 | 0.969 | 1.00 | 0.634 |
Download Data |
Period Mean (original grids) [Watt m-2] |
Model Period Mean (intersection) [Watt m-2] |
Benchmark Period Mean (intersection) [Watt m-2] |
Model Period Mean (complement) [Watt m-2] |
Benchmark Period Mean (complement) [Watt m-2] |
Bias [Watt m-2] |
RMSE [Watt m-2] |
Phase Shift [months] |
Bias Score [1] |
RMSE Score [1] |
Seasonal Cycle Score [1] |
Spatial Distribution Score [1] |
Overall Score [1] |
|||
|---|---|---|---|---|---|---|---|---|---|---|---|---|---|---|---|---|
| Benchmark | [-] | 378. | ||||||||||||||
| CESM3_092H | [-] | 384. | 384. | 378. | 426. | 8.74 | 17.9 | 0.655 | 0.271 | 0.473 | 0.930 | 0.999 | 0.629 | |||
| CESM3_098bH | [-] | 384. | 384. | 378. | 426. | 9.56 | 18.3 | 0.658 | 0.259 | 0.485 | 0.929 | 0.999 | 0.632 | |||
| CMIP6_001 | [-] | 380. | 380. | 377. | 409. | 5.08 | 16.8 | 0.654 | 0.307 | 0.470 | 0.931 | 0.999 | 0.635 | |||
| LE2_001 | [-] | 380. | 380. | 377. | 409. | 5.44 | 17.1 | 0.618 | 0.295 | 0.472 | 0.936 | 0.999 | 0.635 |
Download Data |
Period Mean (original grids) [Watt m-2] |
Model Period Mean (intersection) [Watt m-2] |
Benchmark Period Mean (intersection) [Watt m-2] |
Model Period Mean (complement) [Watt m-2] |
Benchmark Period Mean (complement) [Watt m-2] |
Bias [Watt m-2] |
RMSE [Watt m-2] |
Phase Shift [months] |
Bias Score [1] |
RMSE Score [1] |
Seasonal Cycle Score [1] |
Spatial Distribution Score [1] |
Overall Score [1] |
|||
|---|---|---|---|---|---|---|---|---|---|---|---|---|---|---|---|---|
| Benchmark | [-] | 464. | ||||||||||||||
| CESM3_092H | [-] | 457. | 457. | 464. | 442. | -6.20 | 19.4 | 0.573 | 0.371 | 0.612 | 0.956 | 0.964 | 0.703 | |||
| CESM3_098bH | [-] | 458. | 458. | 464. | 442. | -5.44 | 18.6 | 0.573 | 0.387 | 0.627 | 0.958 | 0.957 | 0.711 | |||
| CMIP6_001 | [-] | 446. | 446. | 465. | 443. | -18.3 | 25.3 | 0.451 | 0.196 | 0.566 | 0.965 | 0.961 | 0.651 | |||
| LE2_001 | [-] | 445. | 445. | 465. | 443. | -18.9 | 25.8 | 0.460 | 0.189 | 0.561 | 0.964 | 0.962 | 0.647 |
Download Data |
Period Mean (original grids) [Watt m-2] |
Model Period Mean (intersection) [Watt m-2] |
Benchmark Period Mean (intersection) [Watt m-2] |
Model Period Mean (complement) [Watt m-2] |
Benchmark Period Mean (complement) [Watt m-2] |
Bias [Watt m-2] |
RMSE [Watt m-2] |
Phase Shift [months] |
Bias Score [1] |
RMSE Score [1] |
Seasonal Cycle Score [1] |
Spatial Distribution Score [1] |
Overall Score [1] |
|||
|---|---|---|---|---|---|---|---|---|---|---|---|---|---|---|---|---|
| Benchmark | [-] | 278. | ||||||||||||||
| CESM3_092H | [-] | 290. | 290. | 278. | 280. | 11.3 | 20.2 | 0.168 | 0.196 | 0.174 | 0.989 | 0.999 | 0.506 | |||
| CESM3_098bH | [-] | 295. | 294. | 278. | 280. | 15.7 | 23.1 | 0.167 | 0.0929 | 0.175 | 0.989 | 1.00 | 0.486 | |||
| CMIP6_001 | [-] | 289. | 289. | 277. | 289. | 10.7 | 19.1 | 0.427 | 0.214 | 0.210 | 0.971 | 0.982 | 0.518 | |||
| LE2_001 | [-] | 291. | 290. | 277. | 289. | 12.6 | 20.4 | 0.457 | 0.161 | 0.197 | 0.969 | 0.979 | 0.501 |
Download Data |
Period Mean (original grids) [Watt m-2] |
Model Period Mean (intersection) [Watt m-2] |
Benchmark Period Mean (intersection) [Watt m-2] |
Model Period Mean (complement) [Watt m-2] |
Benchmark Period Mean (complement) [Watt m-2] |
Bias [Watt m-2] |
RMSE [Watt m-2] |
Phase Shift [months] |
Bias Score [1] |
RMSE Score [1] |
Seasonal Cycle Score [1] |
Spatial Distribution Score [1] |
Overall Score [1] |
|||
|---|---|---|---|---|---|---|---|---|---|---|---|---|---|---|---|---|
| Benchmark | [-] | 444. | ||||||||||||||
| CESM3_092H | [-] | 450. | 449. | 444. | 456. | 13.7 | 19.0 | 1.10 | 0.263 | 0.531 | 0.859 | 0.864 | 0.610 | |||
| CESM3_098bH | [-] | 450. | 450. | 444. | 456. | 14.4 | 20.1 | 1.13 | 0.257 | 0.496 | 0.854 | 0.841 | 0.589 | |||
| CMIP6_001 | [-] | 447. | 446. | 442. | 455. | 9.17 | 16.7 | 1.28 | 0.325 | 0.530 | 0.849 | 0.863 | 0.620 | |||
| LE2_001 | [-] | 447. | 447. | 442. | 455. | 9.55 | 16.6 | 1.26 | 0.322 | 0.543 | 0.845 | 0.865 | 0.624 |
Download Data |
Period Mean (original grids) [Watt m-2] |
Model Period Mean (intersection) [Watt m-2] |
Benchmark Period Mean (intersection) [Watt m-2] |
Model Period Mean (complement) [Watt m-2] |
Benchmark Period Mean (complement) [Watt m-2] |
Bias [Watt m-2] |
RMSE [Watt m-2] |
Phase Shift [months] |
Bias Score [1] |
RMSE Score [1] |
Seasonal Cycle Score [1] |
Spatial Distribution Score [1] |
Overall Score [1] |
|||
|---|---|---|---|---|---|---|---|---|---|---|---|---|---|---|---|---|
| Benchmark | [-] | 386. | ||||||||||||||
| CESM3_092H | [-] | 404. | 404. | 385. | 440. | 22.3 | 26.3 | 0.742 | 0.0129 | 0.317 | 0.950 | 0.998 | 0.519 | |||
| CESM3_098bH | [-] | 406. | 406. | 385. | 440. | 24.7 | 27.5 | 0.707 | 0.00684 | 0.397 | 0.952 | 0.998 | 0.550 | |||
| CMIP6_001 | [-] | 399. | 399. | 384. | 429. | 17.2 | 20.0 | 0.501 | 0.0793 | 0.478 | 0.966 | 0.999 | 0.600 | |||
| LE2_001 | [-] | 398. | 398. | 384. | 429. | 17.0 | 19.9 | 0.521 | 0.0825 | 0.469 | 0.965 | 0.998 | 0.597 |
Download Data |
Period Mean (original grids) [Watt m-2] |
Model Period Mean (intersection) [Watt m-2] |
Benchmark Period Mean (intersection) [Watt m-2] |
Model Period Mean (complement) [Watt m-2] |
Benchmark Period Mean (complement) [Watt m-2] |
Bias [Watt m-2] |
RMSE [Watt m-2] |
Phase Shift [months] |
Bias Score [1] |
RMSE Score [1] |
Seasonal Cycle Score [1] |
Spatial Distribution Score [1] |
Overall Score [1] |
|||
|---|---|---|---|---|---|---|---|---|---|---|---|---|---|---|---|---|
| Benchmark | [-] | 319. | ||||||||||||||
| CESM3_092H | [-] | 336. | 336. | 319. | 353. | 18.5 | 22.6 | 0.273 | 0.0413 | 0.362 | 0.982 | 0.999 | 0.549 | |||
| CESM3_098bH | [-] | 339. | 339. | 319. | 353. | 21.9 | 25.1 | 0.429 | 0.0225 | 0.397 | 0.971 | 0.999 | 0.557 | |||
| CMIP6_001 | [-] | 333. | 333. | 318. | 343. | 15.3 | 19.6 | 0.245 | 0.0595 | 0.377 | 0.984 | 0.997 | 0.559 | |||
| LE2_001 | [-] | 332. | 332. | 318. | 343. | 14.9 | 19.3 | 0.232 | 0.0719 | 0.375 | 0.984 | 0.994 | 0.560 |
Download Data |
Period Mean (original grids) [Watt m-2] |
Model Period Mean (intersection) [Watt m-2] |
Benchmark Period Mean (intersection) [Watt m-2] |
Model Period Mean (complement) [Watt m-2] |
Benchmark Period Mean (complement) [Watt m-2] |
Bias [Watt m-2] |
RMSE [Watt m-2] |
Phase Shift [months] |
Bias Score [1] |
RMSE Score [1] |
Seasonal Cycle Score [1] |
Spatial Distribution Score [1] |
Overall Score [1] |
|||
|---|---|---|---|---|---|---|---|---|---|---|---|---|---|---|---|---|
| Benchmark | [-] | 376. | ||||||||||||||
| CESM3_092H | [-] | 388. | 389. | 376. | 381. | 13.1 | 17.9 | 0.490 | 0.246 | 0.562 | 0.966 | 0.984 | 0.664 | |||
| CESM3_098bH | [-] | 388. | 389. | 376. | 381. | 13.8 | 18.6 | 0.519 | 0.228 | 0.563 | 0.965 | 0.979 | 0.659 | |||
| CMIP6_001 | [-] | 388. | 389. | 376. | 379. | 13.3 | 17.7 | 0.365 | 0.243 | 0.578 | 0.975 | 0.976 | 0.670 | |||
| LE2_001 | [-] | 388. | 389. | 376. | 379. | 12.8 | 17.2 | 0.402 | 0.254 | 0.570 | 0.973 | 0.982 | 0.670 |
Download Data |
Period Mean (original grids) [Watt m-2] |
Model Period Mean (intersection) [Watt m-2] |
Benchmark Period Mean (intersection) [Watt m-2] |
Model Period Mean (complement) [Watt m-2] |
Benchmark Period Mean (complement) [Watt m-2] |
Bias [Watt m-2] |
RMSE [Watt m-2] |
Phase Shift [months] |
Bias Score [1] |
RMSE Score [1] |
Seasonal Cycle Score [1] |
Spatial Distribution Score [1] |
Overall Score [1] |
|||
|---|---|---|---|---|---|---|---|---|---|---|---|---|---|---|---|---|
| Benchmark | [-] | 449. | ||||||||||||||
| CESM3_092H | [-] | 460. | 460. | 449. | 458. | 11.5 | 14.1 | 1.08 | 0.280 | 0.719 | 0.867 | 0.830 | 0.683 | |||
| CESM3_098bH | [-] | 460. | 460. | 449. | 458. | 11.8 | 14.4 | 0.991 | 0.278 | 0.719 | 0.882 | 0.814 | 0.683 | |||
| CMIP6_001 | [-] | 457. | 457. | 449. | 458. | 7.94 | 11.1 | 1.31 | 0.419 | 0.728 | 0.825 | 0.901 | 0.720 | |||
| LE2_001 | [-] | 457. | 457. | 449. | 458. | 8.00 | 11.0 | 1.25 | 0.413 | 0.736 | 0.839 | 0.901 | 0.725 |
Download Data |
Period Mean (original grids) [Watt m-2] |
Model Period Mean (intersection) [Watt m-2] |
Benchmark Period Mean (intersection) [Watt m-2] |
Model Period Mean (complement) [Watt m-2] |
Benchmark Period Mean (complement) [Watt m-2] |
Bias [Watt m-2] |
RMSE [Watt m-2] |
Phase Shift [months] |
Bias Score [1] |
RMSE Score [1] |
Seasonal Cycle Score [1] |
Spatial Distribution Score [1] |
Overall Score [1] |
|||
|---|---|---|---|---|---|---|---|---|---|---|---|---|---|---|---|---|
| Benchmark | [-] | 440. | ||||||||||||||
| CESM3_092H | [-] | 453. | 452. | 440. | 430. | 11.5 | 16.5 | 1.03 | 0.277 | 0.464 | 0.872 | 0.995 | 0.615 | |||
| CESM3_098bH | [-] | 454. | 453. | 440. | 430. | 12.6 | 17.2 | 1.13 | 0.244 | 0.470 | 0.851 | 0.994 | 0.606 | |||
| CMIP6_001 | [-] | 450. | 450. | 440. | 430. | 8.77 | 14.4 | 1.15 | 0.425 | 0.546 | 0.867 | 0.980 | 0.673 | |||
| LE2_001 | [-] | 451. | 451. | 440. | 430. | 9.91 | 15.1 | 0.844 | 0.389 | 0.547 | 0.912 | 0.978 | 0.675 |
Download Data |
Period Mean (original grids) [Watt m-2] |
Model Period Mean (intersection) [Watt m-2] |
Benchmark Period Mean (intersection) [Watt m-2] |
Model Period Mean (complement) [Watt m-2] |
Benchmark Period Mean (complement) [Watt m-2] |
Bias [Watt m-2] |
RMSE [Watt m-2] |
Phase Shift [months] |
Bias Score [1] |
RMSE Score [1] |
Seasonal Cycle Score [1] |
Spatial Distribution Score [1] |
Overall Score [1] |
|||
|---|---|---|---|---|---|---|---|---|---|---|---|---|---|---|---|---|
| Benchmark | [-] | 387. | ||||||||||||||
| CESM3_092H | [-] | 387. | 386. | 387. | 401. | 4.25 | 14.1 | 0.650 | 0.483 | 0.669 | 0.922 | 0.990 | 0.747 | |||
| CESM3_098bH | [-] | 387. | 386. | 387. | 401. | 4.26 | 13.9 | 0.684 | 0.479 | 0.691 | 0.920 | 0.990 | 0.754 | |||
| CMIP6_001 | [-] | 387. | 386. | 386. | 394. | 1.34 | 11.9 | 0.629 | 0.500 | 0.695 | 0.925 | 0.998 | 0.763 | |||
| LE2_001 | [-] | 387. | 386. | 386. | 394. | 1.43 | 11.9 | 0.571 | 0.499 | 0.697 | 0.937 | 0.998 | 0.766 |
Temporally integrated period mean