Mean State
Download Data |
Period Mean (original grids) [Pg] |
Model Period Mean (intersection) [Pg] |
Benchmark Period Mean (intersection) [Pg] |
Model Period Mean (complement) [Pg] |
Benchmark Period Mean (complement) [Pg] |
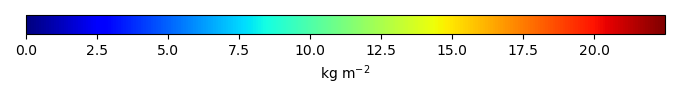
Bias [kg m-2] |
Bias Score [1] |
Spatial Distribution Score [1] |
Overall Score [1] |
|||
|---|---|---|---|---|---|---|---|---|---|---|---|---|
| Benchmark | [-] | 50.2 | ||||||||||
| 271 | [-] | 40.9 | 41.6 | 50.2 | 1.65e-05 | -1.06 | 0.641 | 0.943 | 0.792 | |||
| 330 | [-] | 49.3 | 50.4 | 50.2 | 1.65e-05 | 0.845 | 0.623 | 0.968 | 0.795 | |||
| CMIP6_001 | [-] | 48.5 | 49.3 | 50.1 | 0.0725 | 0.247 | 0.682 | 0.975 | 0.829 |
Download Data |
Period Mean (original grids) [Pg] |
Model Period Mean (intersection) [Pg] |
Benchmark Period Mean (intersection) [Pg] |
Model Period Mean (complement) [Pg] |
Benchmark Period Mean (complement) [Pg] |
Bias [kg m-2] |
Bias Score [1] |
Spatial Distribution Score [1] |
Overall Score [1] |
|||
|---|---|---|---|---|---|---|---|---|---|---|---|---|
| Benchmark | [-] | 10.5 | ||||||||||
| 271 | [-] | 4.25 | 3.76 | 10.5 | 0.00136 | -0.974 | 0.612 | 0.377 | 0.495 | |||
| 330 | [-] | 6.54 | 5.68 | 10.5 | 0.00136 | -0.687 | 0.614 | 0.737 | 0.675 | |||
| CMIP6_001 | [-] | 4.35 | 3.67 | 10.5 | 0.0103 | -1.01 | 0.639 | 0.603 | 0.621 |
Download Data |
Period Mean (original grids) [Pg] |
Model Period Mean (intersection) [Pg] |
Benchmark Period Mean (intersection) [Pg] |
Model Period Mean (complement) [Pg] |
Benchmark Period Mean (complement) [Pg] |
Bias [kg m-2] |
Bias Score [1] |
Spatial Distribution Score [1] |
Overall Score [1] |
|||
|---|---|---|---|---|---|---|---|---|---|---|---|---|
| Benchmark | [-] | 20.8 | ||||||||||
| 271 | [-] | 10.1 | 9.93 | 20.8 | 0.00143 | -0.862 | 0.523 | 0.687 | 0.605 | |||
| 330 | [-] | 16.5 | 16.3 | 20.8 | 0.00143 | -0.182 | 0.518 | 0.852 | 0.685 | |||
| CMIP6_001 | [-] | 20.6 | 20.3 | 20.7 | 0.0333 | 0.205 | 0.490 | 0.824 | 0.657 |
Download Data |
Period Mean (original grids) [Pg] |
Model Period Mean (intersection) [Pg] |
Benchmark Period Mean (intersection) [Pg] |
Model Period Mean (complement) [Pg] |
Benchmark Period Mean (complement) [Pg] |
Bias [kg m-2] |
Bias Score [1] |
Spatial Distribution Score [1] |
Overall Score [1] |
|||
|---|---|---|---|---|---|---|---|---|---|---|---|---|
| Benchmark | [-] | 3.92 | ||||||||||
| 271 | [-] | 2.51 | 2.53 | 3.97 | 0.00 | -0.177 | 0.602 | 0.793 | 0.698 | |||
| 330 | [-] | 3.08 | 3.11 | 3.97 | 0.00 | 0.0279 | 0.611 | 0.856 | 0.733 | |||
| CMIP6_001 | [-] | 4.38 | 4.42 | 3.95 | 0.0167 | 0.208 | 0.509 | 0.836 | 0.672 |
Download Data |
Period Mean (original grids) [Pg] |
Model Period Mean (intersection) [Pg] |
Benchmark Period Mean (intersection) [Pg] |
Model Period Mean (complement) [Pg] |
Benchmark Period Mean (complement) [Pg] |
Bias [kg m-2] |
Bias Score [1] |
Spatial Distribution Score [1] |
Overall Score [1] |
|||
|---|---|---|---|---|---|---|---|---|---|---|---|---|
| Benchmark | [-] | 32.7 | ||||||||||
| 271 | [-] | 38.1 | 38.1 | 32.6 | 0.0272 | 7.32 | 0.366 | 0.867 | 0.616 | |||
| 330 | [-] | 43.7 | 43.7 | 32.6 | 0.0272 | 9.60 | 0.323 | 0.873 | 0.598 | |||
| CMIP6_001 | [-] | 45.4 | 45.4 | 31.8 | 0.853 | 9.36 | 0.356 | 0.905 | 0.630 |
Download Data |
Period Mean (original grids) [Pg] |
Model Period Mean (intersection) [Pg] |
Benchmark Period Mean (intersection) [Pg] |
Model Period Mean (complement) [Pg] |
Benchmark Period Mean (complement) [Pg] |
Bias [kg m-2] |
Bias Score [1] |
Spatial Distribution Score [1] |
Overall Score [1] |
|||
|---|---|---|---|---|---|---|---|---|---|---|---|---|
| Benchmark | [-] | 52.3 | ||||||||||
| 271 | [-] | 33.9 | 33.2 | 52.3 | 0.000181 | -1.82 | 0.595 | 0.872 | 0.733 | |||
| 330 | [-] | 49.0 | 48.2 | 52.3 | 0.000181 | -0.116 | 0.680 | 0.905 | 0.793 | |||
| CMIP6_001 | [-] | 57.3 | 56.5 | 52.3 | 0.0428 | 0.657 | 0.662 | 0.944 | 0.803 |
Download Data |
Period Mean (original grids) [Pg] |
Model Period Mean (intersection) [Pg] |
Benchmark Period Mean (intersection) [Pg] |
Model Period Mean (complement) [Pg] |
Benchmark Period Mean (complement) [Pg] |
Bias [kg m-2] |
Bias Score [1] |
Spatial Distribution Score [1] |
Overall Score [1] |
|||
|---|---|---|---|---|---|---|---|---|---|---|---|---|
| Benchmark | [-] | 17.4 | ||||||||||
| 271 | [-] | 31.7 | 32.6 | 17.2 | 0.000596 | 1.25 | 0.538 | 0.541 | 0.539 | |||
| 330 | [-] | 32.6 | 33.5 | 17.2 | 0.000596 | 1.31 | 0.538 | 0.547 | 0.542 | |||
| CMIP6_001 | [-] | 35.0 | 35.9 | 17.2 | 0.0238 | 1.33 | 0.500 | 0.555 | 0.527 |
Download Data |
Period Mean (original grids) [Pg] |
Model Period Mean (intersection) [Pg] |
Benchmark Period Mean (intersection) [Pg] |
Model Period Mean (complement) [Pg] |
Benchmark Period Mean (complement) [Pg] |
Bias [kg m-2] |
Bias Score [1] |
Spatial Distribution Score [1] |
Overall Score [1] |
|||
|---|---|---|---|---|---|---|---|---|---|---|---|---|
| Benchmark | [-] | 11.4 | ||||||||||
| 271 | [-] | 17.4 | 16.9 | 11.5 | 0.00536 | 1.78 | 0.463 | 0.649 | 0.556 | |||
| 330 | [-] | 22.3 | 21.8 | 11.5 | 0.00536 | 2.67 | 0.421 | 0.502 | 0.461 | |||
| CMIP6_001 | [-] | 23.7 | 23.1 | 11.4 | 0.0711 | 2.74 | 0.434 | 0.443 | 0.439 |
Download Data |
Period Mean (original grids) [Pg] |
Model Period Mean (intersection) [Pg] |
Benchmark Period Mean (intersection) [Pg] |
Model Period Mean (complement) [Pg] |
Benchmark Period Mean (complement) [Pg] |
Bias [kg m-2] |
Bias Score [1] |
Spatial Distribution Score [1] |
Overall Score [1] |
|||
|---|---|---|---|---|---|---|---|---|---|---|---|---|
| Benchmark | [-] | 4.25 | ||||||||||
| 271 | [-] | 2.46 | 2.53 | 4.22 | 1.23e-05 | -0.399 | 0.613 | 0.555 | 0.584 | |||
| 330 | [-] | 2.85 | 3.02 | 4.22 | 1.23e-05 | -0.250 | 0.627 | 0.732 | 0.680 | |||
| CMIP6_001 | [-] | 2.76 | 2.91 | 4.21 | 0.00173 | -0.335 | 0.528 | 0.760 | 0.644 |
Download Data |
Period Mean (original grids) [Pg] |
Model Period Mean (intersection) [Pg] |
Benchmark Period Mean (intersection) [Pg] |
Model Period Mean (complement) [Pg] |
Benchmark Period Mean (complement) [Pg] |
Bias [kg m-2] |
Bias Score [1] |
Spatial Distribution Score [1] |
Overall Score [1] |
|||
|---|---|---|---|---|---|---|---|---|---|---|---|---|
| Benchmark | [-] | 7.97 | ||||||||||
| 271 | [-] | 7.42 | 7.42 | 7.96 | 0.0163 | 0.455 | 0.505 | 0.635 | 0.570 | |||
| 330 | [-] | 8.43 | 8.43 | 7.96 | 0.0163 | 0.608 | 0.453 | 0.633 | 0.543 | |||
| CMIP6_001 | [-] | 12.0 | 12.0 | 7.75 | 0.231 | 1.24 | 0.539 | 0.732 | 0.636 |
Download Data |
Period Mean (original grids) [Pg] |
Model Period Mean (intersection) [Pg] |
Benchmark Period Mean (intersection) [Pg] |
Model Period Mean (complement) [Pg] |
Benchmark Period Mean (complement) [Pg] |
Bias [kg m-2] |
Bias Score [1] |
Spatial Distribution Score [1] |
Overall Score [1] |
|||
|---|---|---|---|---|---|---|---|---|---|---|---|---|
| Benchmark | [-] | 19.2 | ||||||||||
| 271 | [-] | 12.1 | 11.9 | 19.3 | 0.000853 | -0.322 | 0.457 | 0.744 | 0.600 | |||
| 330 | [-] | 14.4 | 14.1 | 19.3 | 0.000853 | 0.138 | 0.467 | 0.784 | 0.625 | |||
| CMIP6_001 | [-] | 15.0 | 14.7 | 19.3 | 0.0637 | 0.0638 | 0.471 | 0.744 | 0.608 |
Download Data |
Period Mean (original grids) [Pg] |
Model Period Mean (intersection) [Pg] |
Benchmark Period Mean (intersection) [Pg] |
Model Period Mean (complement) [Pg] |
Benchmark Period Mean (complement) [Pg] |
Bias [kg m-2] |
Bias Score [1] |
Spatial Distribution Score [1] |
Overall Score [1] |
|||
|---|---|---|---|---|---|---|---|---|---|---|---|---|
| Benchmark | [-] | 447. | ||||||||||
| 271 | [-] | 354. | 353. | 447. | 0.00201 | 0.0730 | -0.0198 | 0.578 | 0.849 | 0.713 | ||
| 330 | [-] | 469. | 468. | 447. | 0.00251 | 0.0730 | 0.838 | 0.573 | 0.893 | 0.733 | ||
| CMIP6_001 | [-] | 492. | 491. | 445. | 0.00330 | 1.88 | 0.845 | 0.577 | 0.890 | 0.734 |
Download Data |
Period Mean (original grids) [Pg] |
Model Period Mean (intersection) [Pg] |
Benchmark Period Mean (intersection) [Pg] |
Model Period Mean (complement) [Pg] |
Benchmark Period Mean (complement) [Pg] |
Bias [kg m-2] |
Bias Score [1] |
Spatial Distribution Score [1] |
Overall Score [1] |
|||
|---|---|---|---|---|---|---|---|---|---|---|---|---|
| Benchmark | [-] | 1.25 | ||||||||||
| 271 | [-] | 2.09 | 2.12 | 1.25 | 0.000647 | 0.0929 | 0.875 | 0.764 | 0.819 | |||
| 330 | [-] | 2.42 | 2.46 | 1.25 | 0.000647 | 0.118 | 0.867 | 0.748 | 0.807 | |||
| CMIP6_001 | [-] | 1.28 | 1.30 | 1.25 | 0.00710 | 0.0213 | 0.895 | 0.559 | 0.727 |
Download Data |
Period Mean (original grids) [Pg] |
Model Period Mean (intersection) [Pg] |
Benchmark Period Mean (intersection) [Pg] |
Model Period Mean (complement) [Pg] |
Benchmark Period Mean (complement) [Pg] |
Bias [kg m-2] |
Bias Score [1] |
Spatial Distribution Score [1] |
Overall Score [1] |
|||
|---|---|---|---|---|---|---|---|---|---|---|---|---|
| Benchmark | [-] | 7.25 | ||||||||||
| 271 | [-] | 4.65 | 4.57 | 7.25 | 0.00 | -0.215 | 0.582 | 0.680 | 0.631 | |||
| 330 | [-] | 10.3 | 10.3 | 7.25 | 0.00 | 0.620 | 0.522 | 0.755 | 0.639 | |||
| CMIP6_001 | [-] | 10.4 | 10.6 | 7.23 | 0.0194 | 0.538 | 0.490 | 0.597 | 0.543 |
Download Data |
Period Mean (original grids) [Pg] |
Model Period Mean (intersection) [Pg] |
Benchmark Period Mean (intersection) [Pg] |
Model Period Mean (complement) [Pg] |
Benchmark Period Mean (complement) [Pg] |
Bias [kg m-2] |
Bias Score [1] |
Spatial Distribution Score [1] |
Overall Score [1] |
|||
|---|---|---|---|---|---|---|---|---|---|---|---|---|
| Benchmark | [-] | 7.19 | ||||||||||
| 271 | [-] | 9.52 | 9.23 | 7.17 | 0.0177 | 2.15 | 0.377 | 0.710 | 0.544 | |||
| 330 | [-] | 12.5 | 12.2 | 7.17 | 0.0177 | 3.36 | 0.317 | 0.582 | 0.449 | |||
| CMIP6_001 | [-] | 10.0 | 9.77 | 7.09 | 0.0995 | 2.08 | 0.402 | 0.610 | 0.506 |
Download Data |
Period Mean (original grids) [Pg] |
Model Period Mean (intersection) [Pg] |
Benchmark Period Mean (intersection) [Pg] |
Model Period Mean (complement) [Pg] |
Benchmark Period Mean (complement) [Pg] |
Bias [kg m-2] |
Bias Score [1] |
Spatial Distribution Score [1] |
Overall Score [1] |
|||
|---|---|---|---|---|---|---|---|---|---|---|---|---|
| Benchmark | [-] | 16.1 | ||||||||||
| 271 | [-] | 14.4 | 14.2 | 16.1 | 2.79e-05 | 0.126 | 0.600 | 0.914 | 0.757 | |||
| 330 | [-] | 15.0 | 14.9 | 16.1 | 2.79e-05 | 0.306 | 0.600 | 0.918 | 0.759 | |||
| CMIP6_001 | [-] | 10.0 | 9.92 | 16.1 | 0.0154 | -0.970 | 0.552 | 0.863 | 0.707 |
Download Data |
Period Mean (original grids) [Pg] |
Model Period Mean (intersection) [Pg] |
Benchmark Period Mean (intersection) [Pg] |
Model Period Mean (complement) [Pg] |
Benchmark Period Mean (complement) [Pg] |
Bias [kg m-2] |
Bias Score [1] |
Spatial Distribution Score [1] |
Overall Score [1] |
|||
|---|---|---|---|---|---|---|---|---|---|---|---|---|
| Benchmark | [-] | 25.1 | ||||||||||
| 271 | [-] | 17.4 | 17.5 | 25.1 | 0.00 | -0.736 | 0.488 | 0.787 | 0.637 | |||
| 330 | [-] | 31.9 | 32.0 | 25.1 | 0.00 | 1.90 | 0.505 | 0.893 | 0.699 | |||
| CMIP6_001 | [-] | 36.1 | 35.9 | 25.0 | 0.142 | 2.55 | 0.508 | 0.817 | 0.663 |
Download Data |
Period Mean (original grids) [Pg] |
Model Period Mean (intersection) [Pg] |
Benchmark Period Mean (intersection) [Pg] |
Model Period Mean (complement) [Pg] |
Benchmark Period Mean (complement) [Pg] |
Bias [kg m-2] |
Bias Score [1] |
Spatial Distribution Score [1] |
Overall Score [1] |
|||
|---|---|---|---|---|---|---|---|---|---|---|---|---|
| Benchmark | [-] | 7.38 | ||||||||||
| 271 | [-] | 5.60 | 5.67 | 7.36 | 0.00 | -0.0853 | 0.522 | 0.758 | 0.640 | |||
| 330 | [-] | 6.43 | 6.51 | 7.36 | 0.00 | 0.121 | 0.505 | 0.785 | 0.645 | |||
| CMIP6_001 | [-] | 1.68 | 1.70 | 7.33 | 0.0373 | -1.24 | 0.572 | 0.315 | 0.443 |
Download Data |
Period Mean (original grids) [Pg] |
Model Period Mean (intersection) [Pg] |
Benchmark Period Mean (intersection) [Pg] |
Model Period Mean (complement) [Pg] |
Benchmark Period Mean (complement) [Pg] |
Bias [kg m-2] |
Bias Score [1] |
Spatial Distribution Score [1] |
Overall Score [1] |
|||
|---|---|---|---|---|---|---|---|---|---|---|---|---|
| Benchmark | [-] | 132. | ||||||||||
| 271 | [-] | 83.8 | 83.8 | 133. | 0.000467 | -5.14 | 0.594 | 0.894 | 0.744 | |||
| 330 | [-] | 120. | 120. | 133. | 0.000467 | -0.942 | 0.653 | 0.942 | 0.797 | |||
| CMIP6_001 | [-] | 133. | 133. | 132. | 0.0591 | 0.561 | 0.680 | 0.966 | 0.823 |
Download Data |
Period Mean (original grids) [Pg] |
Model Period Mean (intersection) [Pg] |
Benchmark Period Mean (intersection) [Pg] |
Model Period Mean (complement) [Pg] |
Benchmark Period Mean (complement) [Pg] |
Bias [kg m-2] |
Bias Score [1] |
Spatial Distribution Score [1] |
Overall Score [1] |
|||
|---|---|---|---|---|---|---|---|---|---|---|---|---|
| Benchmark | [-] | 15.4 | ||||||||||
| 271 | [-] | 8.39 | 8.64 | 15.3 | 0.00201 | 0.000561 | -0.756 | 0.534 | 0.822 | 0.678 | ||
| 330 | [-] | 13.1 | 13.6 | 15.3 | 0.00251 | 0.000561 | -0.00915 | 0.549 | 0.844 | 0.696 | ||
| CMIP6_001 | [-] | 12.8 | 13.4 | 15.3 | 0.00330 | 0.0210 | 0.0101 | 0.479 | 0.797 | 0.638 |
Download Data |
Period Mean (original grids) [Pg] |
Model Period Mean (intersection) [Pg] |
Benchmark Period Mean (intersection) [Pg] |
Model Period Mean (complement) [Pg] |
Benchmark Period Mean (complement) [Pg] |
Bias [kg m-2] |
Bias Score [1] |
Spatial Distribution Score [1] |
Overall Score [1] |
|||
|---|---|---|---|---|---|---|---|---|---|---|---|---|
| Benchmark | [-] | 4.33 | ||||||||||
| 271 | [-] | 7.18 | 7.01 | 4.27 | 0.000238 | 1.25 | 0.377 | 0.822 | 0.600 | |||
| 330 | [-] | 8.67 | 8.44 | 4.27 | 0.000238 | 1.69 | 0.343 | 0.816 | 0.579 | |||
| CMIP6_001 | [-] | 7.18 | 7.05 | 4.21 | 0.0595 | 1.41 | 0.383 | 0.746 | 0.565 |
Temporally integrated period mean