Mean State
Download Data |
Period Mean (original grids) [Pg] |
Model Period Mean (intersection) [Pg] |
Benchmark Period Mean (intersection) [Pg] |
Model Period Mean (complement) [Pg] |
Benchmark Period Mean (complement) [Pg] |
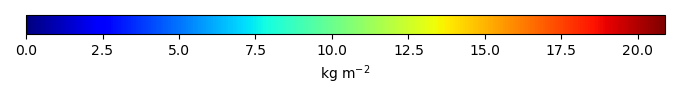
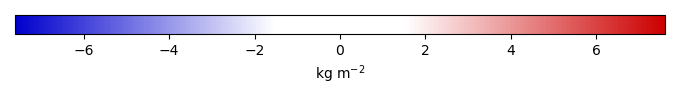
Bias [kg m-2] |
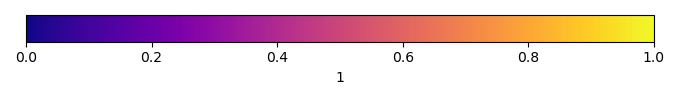
Bias Score [1] |
Spatial Distribution Score [1] |
Overall Score [1] |
|||
|---|---|---|---|---|---|---|---|---|---|---|---|---|
| Benchmark | [-] | 4.43 | ||||||||||
| 271 | [-] | 2.36 | 2.27 | 4.43 | 0.125 | -0.601 | 0.626 | 0.890 | 0.758 | |||
| 330 | [-] | 2.96 | 2.85 | 4.43 | 0.148 | -0.366 | 0.653 | 0.927 | 0.790 | |||
| CMIP6_001 | [-] | 4.18 | 4.13 | 4.36 | 0.0947 | 0.0705 | -0.00357 | 0.492 | 0.764 | 0.628 |
Download Data |
Period Mean (original grids) [Pg] |
Model Period Mean (intersection) [Pg] |
Benchmark Period Mean (intersection) [Pg] |
Model Period Mean (complement) [Pg] |
Benchmark Period Mean (complement) [Pg] |
Bias [kg m-2] |
Bias Score [1] |
Spatial Distribution Score [1] |
Overall Score [1] |
|||
|---|---|---|---|---|---|---|---|---|---|---|---|---|
| Benchmark | [-] | 40.1 | ||||||||||
| 271 | [-] | 32.7 | 31.9 | 40.1 | 0.175 | 0.00333 | -0.749 | 0.613 | 0.687 | 0.650 | ||
| 330 | [-] | 47.4 | 46.3 | 40.1 | 0.262 | 0.00333 | 0.899 | 0.667 | 0.809 | 0.738 | ||
| CMIP6_001 | [-] | 55.4 | 54.2 | 39.9 | 0.304 | 0.184 | 1.74 | 0.582 | 0.593 | 0.588 |
Download Data |
Period Mean (original grids) [Pg] |
Model Period Mean (intersection) [Pg] |
Benchmark Period Mean (intersection) [Pg] |
Model Period Mean (complement) [Pg] |
Benchmark Period Mean (complement) [Pg] |
Bias [kg m-2] |
Bias Score [1] |
Spatial Distribution Score [1] |
Overall Score [1] |
|||
|---|---|---|---|---|---|---|---|---|---|---|---|---|
| Benchmark | [-] | 28.0 | ||||||||||
| 271 | [-] | 30.8 | 15.2 | 28.0 | 16.3 | 0.00891 | -1.16 | 0.510 | 0.678 | 0.594 | ||
| 330 | [-] | 32.0 | 16.1 | 28.0 | 16.7 | 0.00891 | -1.05 | 0.519 | 0.683 | 0.601 | ||
| CMIP6_001 | [-] | 34.1 | 16.4 | 27.7 | 18.6 | 0.322 | -1.09 | 0.519 | 0.682 | 0.600 |
Download Data |
Period Mean (original grids) [Pg] |
Model Period Mean (intersection) [Pg] |
Benchmark Period Mean (intersection) [Pg] |
Model Period Mean (complement) [Pg] |
Benchmark Period Mean (complement) [Pg] |
Bias [kg m-2] |
Bias Score [1] |
Spatial Distribution Score [1] |
Overall Score [1] |
|||
|---|---|---|---|---|---|---|---|---|---|---|---|---|
| Benchmark | [-] | 0.341 | ||||||||||
| 271 | [-] | 17.3 | 0.0601 | 0.341 | 16.6 | -1.97 | 0.444 | 0.513 | 0.478 | |||
| 330 | [-] | 22.0 | 0.128 | 0.341 | 21.2 | -1.52 | 0.503 | 0.842 | 0.673 | |||
| CMIP6_001 | [-] | 24.6 | 0.0710 | 0.341 | 23.7 | -1.88 | 0.466 | 0.554 | 0.510 |
Download Data |
Period Mean (original grids) [Pg] |
Model Period Mean (intersection) [Pg] |
Benchmark Period Mean (intersection) [Pg] |
Model Period Mean (complement) [Pg] |
Benchmark Period Mean (complement) [Pg] |
Bias [kg m-2] |
Bias Score [1] |
Spatial Distribution Score [1] |
Overall Score [1] |
|||
|---|---|---|---|---|---|---|---|---|---|---|---|---|
| Benchmark | [-] | 3.80 | ||||||||||
| 271 | [-] | 2.21 | 2.15 | 3.80 | 0.137 | 0.000494 | -0.612 | 0.606 | 0.806 | 0.706 | ||
| 330 | [-] | 2.58 | 2.61 | 3.80 | 0.148 | 0.000494 | -0.409 | 0.627 | 0.906 | 0.767 | ||
| CMIP6_001 | [-] | 2.59 | 2.65 | 3.79 | 0.108 | 0.00634 | -0.434 | 0.430 | 0.678 | 0.554 |
Download Data |
Period Mean (original grids) [Pg] |
Model Period Mean (intersection) [Pg] |
Benchmark Period Mean (intersection) [Pg] |
Model Period Mean (complement) [Pg] |
Benchmark Period Mean (complement) [Pg] |
Bias [kg m-2] |
Bias Score [1] |
Spatial Distribution Score [1] |
Overall Score [1] |
|||
|---|---|---|---|---|---|---|---|---|---|---|---|---|
| Benchmark | [-] | 29.4 | ||||||||||
| 271 | [-] | 11.9 | 11.2 | 29.4 | 0.533 | 0.0158 | -2.65 | 0.581 | 0.874 | 0.728 | ||
| 330 | [-] | 13.9 | 13.1 | 29.4 | 0.595 | 0.0158 | -2.23 | 0.603 | 0.877 | 0.740 | ||
| CMIP6_001 | [-] | 14.5 | 13.9 | 28.9 | 0.403 | 0.540 | -2.11 | 0.494 | 0.626 | 0.560 |
Download Data |
Period Mean (original grids) [Pg] |
Model Period Mean (intersection) [Pg] |
Benchmark Period Mean (intersection) [Pg] |
Model Period Mean (complement) [Pg] |
Benchmark Period Mean (complement) [Pg] |
Bias [kg m-2] |
Bias Score [1] |
Spatial Distribution Score [1] |
Overall Score [1] |
|||
|---|---|---|---|---|---|---|---|---|---|---|---|---|
| Benchmark | [-] | 174. | ||||||||||
| 271 | [-] | 347. | 103. | 174. | 243. | 0.0403 | -1.21 | 0.566 | 0.844 | 0.705 | ||
| 330 | [-] | 462. | 142. | 174. | 318. | 0.0403 | -0.349 | 0.580 | 0.842 | 0.711 | ||
| CMIP6_001 | [-] | 484. | 147. | 172. | 335. | 2.04 | -0.281 | 0.497 | 0.671 | 0.584 |
Download Data |
Period Mean (original grids) [Pg] |
Model Period Mean (intersection) [Pg] |
Benchmark Period Mean (intersection) [Pg] |
Model Period Mean (complement) [Pg] |
Benchmark Period Mean (complement) [Pg] |
Bias [kg m-2] |
Bias Score [1] |
Spatial Distribution Score [1] |
Overall Score [1] |
|||
|---|---|---|---|---|---|---|---|---|---|---|---|---|
| Benchmark | [-] | 4.88 | ||||||||||
| 271 | [-] | 2.08 | 1.00 | 4.87 | 1.11 | 0.0107 | -2.55 | 0.501 | 0.328 | 0.414 | ||
| 330 | [-] | 2.39 | 1.18 | 4.87 | 1.25 | 0.0107 | -2.39 | 0.524 | 0.439 | 0.481 | ||
| CMIP6_001 | [-] | 1.16 | 0.402 | 4.82 | 0.778 | 0.0615 | -3.09 | 0.419 | 0.148 | 0.283 |
Download Data |
Period Mean (original grids) [Pg] |
Model Period Mean (intersection) [Pg] |
Benchmark Period Mean (intersection) [Pg] |
Model Period Mean (complement) [Pg] |
Benchmark Period Mean (complement) [Pg] |
Bias [kg m-2] |
Bias Score [1] |
Spatial Distribution Score [1] |
Overall Score [1] |
|||
|---|---|---|---|---|---|---|---|---|---|---|---|---|
| Benchmark | [-] | 9.77 | ||||||||||
| 271 | [-] | 4.40 | 4.20 | 9.77 | 0.138 | -0.923 | 0.556 | 0.510 | 0.533 | |||
| 330 | [-] | 9.76 | 9.46 | 9.77 | 0.261 | 0.101 | 0.495 | 0.849 | 0.672 | |||
| CMIP6_001 | [-] | 10.1 | 10.2 | 9.60 | 0.159 | 0.175 | 0.183 | 0.433 | 0.611 | 0.522 |
Download Data |
Period Mean (original grids) [Pg] |
Model Period Mean (intersection) [Pg] |
Benchmark Period Mean (intersection) [Pg] |
Model Period Mean (complement) [Pg] |
Benchmark Period Mean (complement) [Pg] |
Bias [kg m-2] |
Bias Score [1] |
Spatial Distribution Score [1] |
Overall Score [1] |
|||
|---|---|---|---|---|---|---|---|---|---|---|---|---|
| Benchmark | [-] | 0.211 | ||||||||||
| 271 | [-] | 9.13 | 0.0406 | 0.211 | 8.84 | -1.38 | 0.490 | 0.661 | 0.575 | |||
| 330 | [-] | 12.1 | 0.0474 | 0.211 | 11.8 | -1.29 | 0.515 | 0.765 | 0.640 | |||
| CMIP6_001 | [-] | 9.84 | 0.0158 | 0.210 | 9.59 | 0.000277 | -1.64 | 0.428 | 0.624 | 0.526 |
Download Data |
Period Mean (original grids) [Pg] |
Model Period Mean (intersection) [Pg] |
Benchmark Period Mean (intersection) [Pg] |
Model Period Mean (complement) [Pg] |
Benchmark Period Mean (complement) [Pg] |
Bias [kg m-2] |
Bias Score [1] |
Spatial Distribution Score [1] |
Overall Score [1] |
|||
|---|---|---|---|---|---|---|---|---|---|---|---|---|
| Benchmark | [-] | 16.1 | ||||||||||
| 271 | [-] | 13.8 | 12.9 | 16.1 | 0.740 | -0.583 | 0.603 | 0.653 | 0.628 | |||
| 330 | [-] | 14.6 | 13.6 | 16.1 | 0.806 | -0.395 | 0.609 | 0.654 | 0.632 | |||
| CMIP6_001 | [-] | 9.49 | 8.89 | 16.1 | 0.511 | 0.0548 | -1.64 | 0.535 | 0.616 | 0.575 |
Download Data |
Period Mean (original grids) [Pg] |
Model Period Mean (intersection) [Pg] |
Benchmark Period Mean (intersection) [Pg] |
Model Period Mean (complement) [Pg] |
Benchmark Period Mean (complement) [Pg] |
Bias [kg m-2] |
Bias Score [1] |
Spatial Distribution Score [1] |
Overall Score [1] |
|||
|---|---|---|---|---|---|---|---|---|---|---|---|---|
| Benchmark | [-] | 24.5 | ||||||||||
| 271 | [-] | 17.0 | 16.7 | 24.5 | 0.406 | -1.05 | 0.529 | 0.744 | 0.636 | |||
| 330 | [-] | 31.3 | 30.9 | 24.5 | 0.463 | 1.63 | 0.537 | 0.913 | 0.725 | |||
| CMIP6_001 | [-] | 35.1 | 34.6 | 24.0 | 0.328 | 0.527 | 2.39 | 0.467 | 0.578 | 0.523 |
Download Data |
Period Mean (original grids) [Pg] |
Model Period Mean (intersection) [Pg] |
Benchmark Period Mean (intersection) [Pg] |
Model Period Mean (complement) [Pg] |
Benchmark Period Mean (complement) [Pg] |
Bias [kg m-2] |
Bias Score [1] |
Spatial Distribution Score [1] |
Overall Score [1] |
|||
|---|---|---|---|---|---|---|---|---|---|---|---|---|
| Benchmark | [-] | 12.8 | ||||||||||
| 271 | [-] | 5.47 | 5.29 | 12.8 | 0.251 | 0.00114 | -1.96 | 0.523 | 0.915 | 0.719 | ||
| 330 | [-] | 6.28 | 6.07 | 12.8 | 0.282 | 0.00114 | -1.73 | 0.548 | 0.929 | 0.738 | ||
| CMIP6_001 | [-] | 1.64 | 1.51 | 12.7 | 0.149 | 0.0995 | -3.07 | 0.430 | 0.570 | 0.500 |
Temporally integrated period mean