Mean State
Download Data |
Period Mean (original grids) [%] |
Model Period Mean (intersection) [%] |
Benchmark Period Mean (intersection) [%] |
Model Period Mean (complement) [%] |
Benchmark Period Mean (complement) [%] |
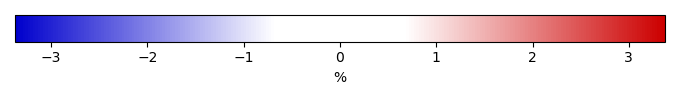
Bias [%] |
RMSE [%] |
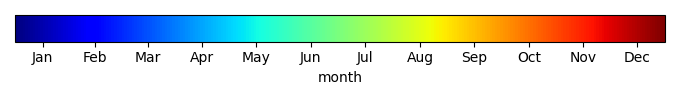
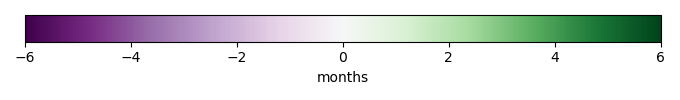
Phase Shift [months] |
Bias Score [1] |
RMSE Score [1] |
Seasonal Cycle Score [1] |
Spatial Distribution Score [1] |
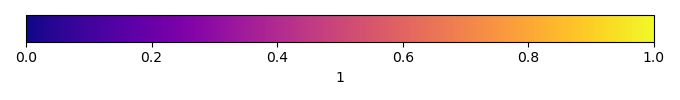
Overall Score [1] |
|||
|---|---|---|---|---|---|---|---|---|---|---|---|---|---|---|---|---|
| Benchmark | [-] | 0.919 | ||||||||||||||
| 271 | [-] | 0.369 | 0.449 | 0.930 | 0.0793 | -0.497 | 1.76 | 1.95 | 0.658 | 0.508 | 0.713 | 0.490 | 0.575 | |||
| 330 | [-] | 0.252 | 0.296 | 0.919 | 0.0822 | -0.635 | 1.73 | 1.95 | 0.664 | 0.528 | 0.718 | 0.279 | 0.544 |
Download Data |
Period Mean (original grids) [%] |
Model Period Mean (intersection) [%] |
Benchmark Period Mean (intersection) [%] |
Model Period Mean (complement) [%] |
Benchmark Period Mean (complement) [%] |
Bias [%] |
RMSE [%] |
Phase Shift [months] |
Bias Score [1] |
RMSE Score [1] |
Seasonal Cycle Score [1] |
Spatial Distribution Score [1] |
Overall Score [1] |
|||
|---|---|---|---|---|---|---|---|---|---|---|---|---|---|---|---|---|
| Benchmark | [-] | 2.59 | ||||||||||||||
| 271 | [-] | 1.92 | 1.92 | 2.72 | 0.848 | 0.330 | -0.817 | 4.89 | 2.47 | 0.628 | 0.412 | 0.612 | 0.698 | 0.552 | ||
| 330 | [-] | 1.46 | 1.47 | 2.59 | 0.633 | 0.314 | -1.13 | 4.68 | 2.43 | 0.625 | 0.424 | 0.621 | 0.506 | 0.520 |
Download Data |
Period Mean (original grids) [%] |
Model Period Mean (intersection) [%] |
Benchmark Period Mean (intersection) [%] |
Model Period Mean (complement) [%] |
Benchmark Period Mean (complement) [%] |
Bias [%] |
RMSE [%] |
Phase Shift [months] |
Bias Score [1] |
RMSE Score [1] |
Seasonal Cycle Score [1] |
Spatial Distribution Score [1] |
Overall Score [1] |
|||
|---|---|---|---|---|---|---|---|---|---|---|---|---|---|---|---|---|
| Benchmark | [-] | 2.14 | ||||||||||||||
| 271 | [-] | 3.13 | 3.19 | 2.17 | 1.33 | 0.0175 | 0.930 | 3.76 | 1.77 | 0.634 | 0.483 | 0.755 | 0.860 | 0.643 | ||
| 330 | [-] | 2.31 | 2.35 | 2.14 | 0.875 | 0.0176 | 0.141 | 3.58 | 1.71 | 0.644 | 0.494 | 0.764 | 0.874 | 0.654 |
Download Data |
Period Mean (original grids) [%] |
Model Period Mean (intersection) [%] |
Benchmark Period Mean (intersection) [%] |
Model Period Mean (complement) [%] |
Benchmark Period Mean (complement) [%] |
Bias [%] |
RMSE [%] |
Phase Shift [months] |
Bias Score [1] |
RMSE Score [1] |
Seasonal Cycle Score [1] |
Spatial Distribution Score [1] |
Overall Score [1] |
|||
|---|---|---|---|---|---|---|---|---|---|---|---|---|---|---|---|---|
| Benchmark | [-] | 0.0450 | ||||||||||||||
| 271 | [-] | 0.00724 | 0.00743 | 0.0424 | 0.00501 | -0.0353 | 0.107 | 2.16 | 0.886 | 0.690 | 0.666 | 0.0371 | 0.594 | |||
| 330 | [-] | 0.0107 | 0.0111 | 0.0450 | 0.00529 | -0.0348 | 0.109 | 1.97 | 0.880 | 0.716 | 0.703 | 0.0653 | 0.616 |
Download Data |
Period Mean (original grids) [%] |
Model Period Mean (intersection) [%] |
Benchmark Period Mean (intersection) [%] |
Model Period Mean (complement) [%] |
Benchmark Period Mean (complement) [%] |
Bias [%] |
RMSE [%] |
Phase Shift [months] |
Bias Score [1] |
RMSE Score [1] |
Seasonal Cycle Score [1] |
Spatial Distribution Score [1] |
Overall Score [1] |
|||
|---|---|---|---|---|---|---|---|---|---|---|---|---|---|---|---|---|
| Benchmark | [-] | 0.124 | ||||||||||||||
| 271 | [-] | 0.112 | 0.107 | 0.133 | 0.145 | 0.0174 | -0.0111 | 0.303 | 1.75 | 0.725 | 0.534 | 0.753 | 0.760 | 0.661 | ||
| 330 | [-] | 0.103 | 0.102 | 0.125 | 0.112 | 0.0145 | -0.0198 | 0.298 | 1.71 | 0.747 | 0.551 | 0.763 | 0.711 | 0.665 |
Download Data |
Period Mean (original grids) [%] |
Model Period Mean (intersection) [%] |
Benchmark Period Mean (intersection) [%] |
Model Period Mean (complement) [%] |
Benchmark Period Mean (complement) [%] |
Bias [%] |
RMSE [%] |
Phase Shift [months] |
Bias Score [1] |
RMSE Score [1] |
Seasonal Cycle Score [1] |
Spatial Distribution Score [1] |
Overall Score [1] |
|||
|---|---|---|---|---|---|---|---|---|---|---|---|---|---|---|---|---|
| Benchmark | [-] | 0.271 | ||||||||||||||
| 271 | [-] | 0.175 | 0.174 | 0.299 | 0.0863 | 0.000115 | -0.127 | 0.681 | 1.44 | 0.713 | 0.549 | 0.804 | 0.389 | 0.601 | ||
| 330 | [-] | 0.0937 | 0.0913 | 0.271 | 0.0228 | 0.000245 | -0.181 | 0.544 | 1.29 | 0.804 | 0.657 | 0.830 | 0.247 | 0.639 |
Download Data |
Period Mean (original grids) [%] |
Model Period Mean (intersection) [%] |
Benchmark Period Mean (intersection) [%] |
Model Period Mean (complement) [%] |
Benchmark Period Mean (complement) [%] |
Bias [%] |
RMSE [%] |
Phase Shift [months] |
Bias Score [1] |
RMSE Score [1] |
Seasonal Cycle Score [1] |
Spatial Distribution Score [1] |
Overall Score [1] |
|||
|---|---|---|---|---|---|---|---|---|---|---|---|---|---|---|---|---|
| Benchmark | [-] | 0.194 | ||||||||||||||
| 271 | [-] | 0.208 | 0.210 | 0.203 | 0.105 | 0.00 | 0.00339 | 0.440 | 2.50 | 0.747 | 0.495 | 0.598 | 0.746 | 0.616 | ||
| 330 | [-] | 0.187 | 0.189 | 0.194 | 0.0975 | 0.00 | -0.00774 | 0.430 | 2.48 | 0.776 | 0.518 | 0.605 | 0.748 | 0.633 |
Download Data |
Period Mean (original grids) [%] |
Model Period Mean (intersection) [%] |
Benchmark Period Mean (intersection) [%] |
Model Period Mean (complement) [%] |
Benchmark Period Mean (complement) [%] |
Bias [%] |
RMSE [%] |
Phase Shift [months] |
Bias Score [1] |
RMSE Score [1] |
Seasonal Cycle Score [1] |
Spatial Distribution Score [1] |
Overall Score [1] |
|||
|---|---|---|---|---|---|---|---|---|---|---|---|---|---|---|---|---|
| Benchmark | [-] | 0.673 | ||||||||||||||
| 271 | [-] | 0.399 | 0.409 | 0.667 | 0.222 | 0.0425 | -0.280 | 1.36 | 1.72 | 0.666 | 0.419 | 0.765 | 0.597 | 0.573 | ||
| 330 | [-] | 0.276 | 0.280 | 0.674 | 0.188 | 0.0358 | -0.406 | 1.42 | 1.73 | 0.673 | 0.419 | 0.765 | 0.282 | 0.512 |
Download Data |
Period Mean (original grids) [%] |
Model Period Mean (intersection) [%] |
Benchmark Period Mean (intersection) [%] |
Model Period Mean (complement) [%] |
Benchmark Period Mean (complement) [%] |
Bias [%] |
RMSE [%] |
Phase Shift [months] |
Bias Score [1] |
RMSE Score [1] |
Seasonal Cycle Score [1] |
Spatial Distribution Score [1] |
Overall Score [1] |
|||
|---|---|---|---|---|---|---|---|---|---|---|---|---|---|---|---|---|
| Benchmark | [-] | 0.0259 | ||||||||||||||
| 271 | [-] | 0.00479 | 0.00587 | 0.0249 | 0.00122 | -0.0194 | 0.0614 | 3.38 | 0.928 | 0.708 | 0.428 | 0.0955 | 0.574 | |||
| 330 | [-] | 0.00731 | 0.00777 | 0.0259 | 0.00184 | -0.0188 | 0.0640 | 3.14 | 0.927 | 0.732 | 0.473 | 0.0931 | 0.591 |
Download Data |
Period Mean (original grids) [%] |
Model Period Mean (intersection) [%] |
Benchmark Period Mean (intersection) [%] |
Model Period Mean (complement) [%] |
Benchmark Period Mean (complement) [%] |
Bias [%] |
RMSE [%] |
Phase Shift [months] |
Bias Score [1] |
RMSE Score [1] |
Seasonal Cycle Score [1] |
Spatial Distribution Score [1] |
Overall Score [1] |
|||
|---|---|---|---|---|---|---|---|---|---|---|---|---|---|---|---|---|
| Benchmark | [-] | 0.604 | ||||||||||||||
| 271 | [-] | 0.825 | 0.832 | 0.655 | 0.622 | 0.189 | 0.175 | 1.25 | 1.69 | 0.646 | 0.530 | 0.769 | 0.864 | 0.668 | ||
| 330 | [-] | 0.608 | 0.615 | 0.605 | 0.431 | 0.221 | 0.00560 | 1.04 | 1.69 | 0.702 | 0.586 | 0.770 | 0.867 | 0.702 |
Download Data |
Period Mean (original grids) [%] |
Model Period Mean (intersection) [%] |
Benchmark Period Mean (intersection) [%] |
Model Period Mean (complement) [%] |
Benchmark Period Mean (complement) [%] |
Bias [%] |
RMSE [%] |
Phase Shift [months] |
Bias Score [1] |
RMSE Score [1] |
Seasonal Cycle Score [1] |
Spatial Distribution Score [1] |
Overall Score [1] |
|||
|---|---|---|---|---|---|---|---|---|---|---|---|---|---|---|---|---|
| Benchmark | [-] | 0.0753 | ||||||||||||||
| 271 | [-] | 0.128 | 0.130 | 0.0835 | 0.0966 | 0.100 | 0.0444 | 0.255 | 2.56 | 0.663 | 0.448 | 0.599 | 0.735 | 0.579 | ||
| 330 | [-] | 0.110 | 0.112 | 0.0753 | 0.0734 | 0.0762 | 0.0325 | 0.239 | 2.54 | 0.690 | 0.470 | 0.607 | 0.762 | 0.600 |
Download Data |
Period Mean (original grids) [%] |
Model Period Mean (intersection) [%] |
Benchmark Period Mean (intersection) [%] |
Model Period Mean (complement) [%] |
Benchmark Period Mean (complement) [%] |
Bias [%] |
RMSE [%] |
Phase Shift [months] |
Bias Score [1] |
RMSE Score [1] |
Seasonal Cycle Score [1] |
Spatial Distribution Score [1] |
Overall Score [1] |
|||
|---|---|---|---|---|---|---|---|---|---|---|---|---|---|---|---|---|
| Benchmark | [-] | 0.477 | ||||||||||||||
| 271 | [-] | 0.630 | 0.655 | 0.494 | 0.133 | 0.0861 | 0.132 | 1.07 | 2.05 | 0.691 | 0.474 | 0.685 | 0.828 | 0.630 | ||
| 330 | [-] | 0.440 | 0.458 | 0.478 | 0.0919 | 0.0805 | -0.0398 | 0.941 | 2.00 | 0.736 | 0.525 | 0.696 | 0.800 | 0.656 |
Download Data |
Period Mean (original grids) [%] |
Model Period Mean (intersection) [%] |
Benchmark Period Mean (intersection) [%] |
Model Period Mean (complement) [%] |
Benchmark Period Mean (complement) [%] |
Bias [%] |
RMSE [%] |
Phase Shift [months] |
Bias Score [1] |
RMSE Score [1] |
Seasonal Cycle Score [1] |
Spatial Distribution Score [1] |
Overall Score [1] |
|||
|---|---|---|---|---|---|---|---|---|---|---|---|---|---|---|---|---|
| Benchmark | [-] | 0.0165 | ||||||||||||||
| 271 | [-] | 0.0354 | 0.0357 | 0.0157 | 0.108 | 0.0187 | 0.0231 | 0.0856 | 1.53 | 0.856 | 0.429 | 0.749 | 0.623 | 0.617 | ||
| 330 | [-] | 0.0307 | 0.0309 | 0.0165 | 0.0943 | 0.0139 | 0.0167 | 0.0828 | 1.49 | 0.866 | 0.466 | 0.755 | 0.617 | 0.634 |
Download Data |
Period Mean (original grids) [%] |
Model Period Mean (intersection) [%] |
Benchmark Period Mean (intersection) [%] |
Model Period Mean (complement) [%] |
Benchmark Period Mean (complement) [%] |
Bias [%] |
RMSE [%] |
Phase Shift [months] |
Bias Score [1] |
RMSE Score [1] |
Seasonal Cycle Score [1] |
Spatial Distribution Score [1] |
Overall Score [1] |
|||
|---|---|---|---|---|---|---|---|---|---|---|---|---|---|---|---|---|
| Benchmark | [-] | 0.0137 | ||||||||||||||
| 271 | [-] | 0.00827 | 0.00810 | 0.0144 | 0.00169 | -0.00710 | 0.0435 | 3.20 | 0.910 | 0.649 | 0.449 | 0.315 | 0.594 | |||
| 330 | [-] | 0.00253 | 0.00248 | 0.0137 | 0.000870 | -0.0115 | 0.0363 | 3.06 | 0.931 | 0.718 | 0.476 | 0.0616 | 0.581 |
Download Data |
Period Mean (original grids) [%] |
Model Period Mean (intersection) [%] |
Benchmark Period Mean (intersection) [%] |
Model Period Mean (complement) [%] |
Benchmark Period Mean (complement) [%] |
Bias [%] |
RMSE [%] |
Phase Shift [months] |
Bias Score [1] |
RMSE Score [1] |
Seasonal Cycle Score [1] |
Spatial Distribution Score [1] |
Overall Score [1] |
|||
|---|---|---|---|---|---|---|---|---|---|---|---|---|---|---|---|---|
| Benchmark | [-] | 0.380 | ||||||||||||||
| 271 | [-] | 0.561 | 0.589 | 0.399 | 0.343 | 0.199 | 0.154 | 1.02 | 1.78 | 0.591 | 0.452 | 0.750 | 0.644 | 0.578 | ||
| 330 | [-] | 0.385 | 0.407 | 0.381 | 0.204 | 0.146 | -0.00933 | 0.893 | 1.86 | 0.635 | 0.473 | 0.737 | 0.705 | 0.604 |
Download Data |
Period Mean (original grids) [%] |
Model Period Mean (intersection) [%] |
Benchmark Period Mean (intersection) [%] |
Model Period Mean (complement) [%] |
Benchmark Period Mean (complement) [%] |
Bias [%] |
RMSE [%] |
Phase Shift [months] |
Bias Score [1] |
RMSE Score [1] |
Seasonal Cycle Score [1] |
Spatial Distribution Score [1] |
Overall Score [1] |
|||
|---|---|---|---|---|---|---|---|---|---|---|---|---|---|---|---|---|
| Benchmark | [-] | 0.0798 | ||||||||||||||
| 271 | [-] | 0.0952 | 0.0956 | 0.0785 | 0.0551 | 0.0176 | 0.177 | 2.83 | 0.636 | 0.493 | 0.540 | 0.711 | 0.574 | |||
| 330 | [-] | 0.0751 | 0.0751 | 0.0798 | 0.0388 | -0.00551 | 0.171 | 2.82 | 0.661 | 0.500 | 0.544 | 0.582 | 0.558 |
Download Data |
Period Mean (original grids) [%] |
Model Period Mean (intersection) [%] |
Benchmark Period Mean (intersection) [%] |
Model Period Mean (complement) [%] |
Benchmark Period Mean (complement) [%] |
Bias [%] |
RMSE [%] |
Phase Shift [months] |
Bias Score [1] |
RMSE Score [1] |
Seasonal Cycle Score [1] |
Spatial Distribution Score [1] |
Overall Score [1] |
|||
|---|---|---|---|---|---|---|---|---|---|---|---|---|---|---|---|---|
| Benchmark | [-] | 0.0500 | ||||||||||||||
| 271 | [-] | 0.130 | 0.132 | 0.0493 | 0.0357 | 0.0775 | 0.254 | 2.47 | 0.601 | 0.394 | 0.618 | 0.583 | 0.518 | |||
| 330 | [-] | 0.0353 | 0.0357 | 0.0500 | 0.0213 | -0.0155 | 0.130 | 2.36 | 0.740 | 0.566 | 0.641 | 0.372 | 0.577 |
Download Data |
Period Mean (original grids) [%] |
Model Period Mean (intersection) [%] |
Benchmark Period Mean (intersection) [%] |
Model Period Mean (complement) [%] |
Benchmark Period Mean (complement) [%] |
Bias [%] |
RMSE [%] |
Phase Shift [months] |
Bias Score [1] |
RMSE Score [1] |
Seasonal Cycle Score [1] |
Spatial Distribution Score [1] |
Overall Score [1] |
|||
|---|---|---|---|---|---|---|---|---|---|---|---|---|---|---|---|---|
| Benchmark | [-] | 0.0535 | ||||||||||||||
| 271 | [-] | 0.0695 | 0.0751 | 0.0542 | 0.0234 | 0.00 | 0.0204 | 0.146 | 2.23 | 0.636 | 0.532 | 0.657 | 0.646 | 0.601 | ||
| 330 | [-] | 0.0503 | 0.0551 | 0.0535 | 0.0155 | 0.00 | 0.00110 | 0.129 | 2.26 | 0.714 | 0.602 | 0.650 | 0.601 | 0.634 |
Download Data |
Period Mean (original grids) [%] |
Model Period Mean (intersection) [%] |
Benchmark Period Mean (intersection) [%] |
Model Period Mean (complement) [%] |
Benchmark Period Mean (complement) [%] |
Bias [%] |
RMSE [%] |
Phase Shift [months] |
Bias Score [1] |
RMSE Score [1] |
Seasonal Cycle Score [1] |
Spatial Distribution Score [1] |
Overall Score [1] |
|||
|---|---|---|---|---|---|---|---|---|---|---|---|---|---|---|---|---|
| Benchmark | [-] | 0.265 | ||||||||||||||
| 271 | [-] | 1.04 | 1.04 | 0.279 | 0.374 | 0.000144 | 0.737 | 1.30 | 1.41 | 0.445 | 0.306 | 0.800 | 0.282 | 0.428 | ||
| 330 | [-] | 0.398 | 0.386 | 0.265 | 0.211 | 0.000102 | 0.117 | 0.557 | 1.33 | 0.622 | 0.468 | 0.819 | 0.641 | 0.603 |
Download Data |
Period Mean (original grids) [%] |
Model Period Mean (intersection) [%] |
Benchmark Period Mean (intersection) [%] |
Model Period Mean (complement) [%] |
Benchmark Period Mean (complement) [%] |
Bias [%] |
RMSE [%] |
Phase Shift [months] |
Bias Score [1] |
RMSE Score [1] |
Seasonal Cycle Score [1] |
Spatial Distribution Score [1] |
Overall Score [1] |
|||
|---|---|---|---|---|---|---|---|---|---|---|---|---|---|---|---|---|
| Benchmark | [-] | 0.427 | ||||||||||||||
| 271 | [-] | 2.19 | 2.20 | 0.446 | 0.237 | 0.0945 | 1.70 | 2.29 | 1.49 | 0.322 | 0.333 | 0.797 | 0.171 | 0.391 | ||
| 330 | [-] | 1.56 | 1.57 | 0.428 | 0.109 | 0.0946 | 1.10 | 1.74 | 1.37 | 0.434 | 0.378 | 0.816 | 0.231 | 0.448 |
Download Data |
Period Mean (original grids) [%] |
Model Period Mean (intersection) [%] |
Benchmark Period Mean (intersection) [%] |
Model Period Mean (complement) [%] |
Benchmark Period Mean (complement) [%] |
Bias [%] |
RMSE [%] |
Phase Shift [months] |
Bias Score [1] |
RMSE Score [1] |
Seasonal Cycle Score [1] |
Spatial Distribution Score [1] |
Overall Score [1] |
|||
|---|---|---|---|---|---|---|---|---|---|---|---|---|---|---|---|---|
| Benchmark | [-] | 0.0613 | ||||||||||||||
| 271 | [-] | 0.134 | 0.116 | 0.0583 | 0.105 | 0.0683 | 0.0553 | 0.189 | 1.89 | 0.762 | 0.560 | 0.717 | 0.538 | 0.627 | ||
| 330 | [-] | 0.0698 | 0.0613 | 0.0613 | 0.0856 | 0.0528 | 0.000694 | 0.137 | 1.98 | 0.818 | 0.639 | 0.705 | 0.767 | 0.713 |
Temporally integrated period mean