Mean State
Download Data |
Period Mean (original grids) [Pg yr-1] |
Model Period Mean (intersection) [Pg yr-1] |
Benchmark Period Mean (intersection) [Pg yr-1] |
Model Period Mean (complement) [Pg yr-1] |
Benchmark Period Mean (complement) [Pg yr-1] |
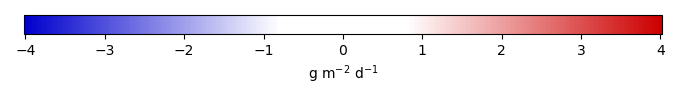
Bias [g m-2 d-1] |
RMSE [g m-2 d-1] |
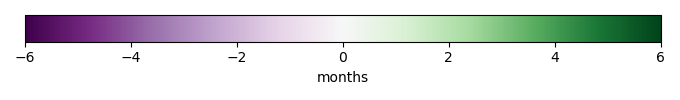
Phase Shift [months] |
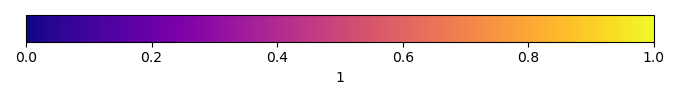
Bias Score [1] |
RMSE Score [1] |
Seasonal Cycle Score [1] |
Spatial Distribution Score [1] |
Overall Score [1] |
|||
|---|---|---|---|---|---|---|---|---|---|---|---|---|---|---|---|---|
| Benchmark | [-] | 6.03 | ||||||||||||||
| 271 | [-] | 7.43 | 7.39 | 6.03 | 0.261 | 1.03 | 1.50 | 2.32 | 0.377 | 0.772 | 0.629 | 0.942 | 0.699 | |||
| 330 | [-] | 8.37 | 8.40 | 6.03 | 0.277 | 1.68 | 1.97 | 2.75 | 0.248 | 0.725 | 0.554 | 0.895 | 0.629 | |||
| CMIP6_001 | [-] | 7.72 | 7.75 | 6.02 | 0.229 | 0.00530 | 1.26 | 1.69 | 2.36 | 0.384 | 0.730 | 0.619 | 0.878 | 0.668 |
Download Data |
Period Mean (original grids) [Pg yr-1] |
Model Period Mean (intersection) [Pg yr-1] |
Benchmark Period Mean (intersection) [Pg yr-1] |
Model Period Mean (complement) [Pg yr-1] |
Benchmark Period Mean (complement) [Pg yr-1] |
Bias [g m-2 d-1] |
RMSE [g m-2 d-1] |
Phase Shift [months] |
Bias Score [1] |
RMSE Score [1] |
Seasonal Cycle Score [1] |
Spatial Distribution Score [1] |
Overall Score [1] |
|||
|---|---|---|---|---|---|---|---|---|---|---|---|---|---|---|---|---|
| Benchmark | [-] | 4.84 | ||||||||||||||
| 271 | [-] | 4.94 | 4.70 | 4.84 | 0.0245 | -0.0348 | 1.37 | 1.40 | 0.436 | 0.447 | 0.824 | 0.816 | 0.594 | |||
| 330 | [-] | 5.99 | 5.68 | 4.84 | 0.0268 | 0.363 | 1.38 | 1.45 | 0.458 | 0.440 | 0.809 | 0.947 | 0.619 | |||
| CMIP6_001 | [-] | 4.25 | 4.01 | 4.83 | 0.0227 | 0.00451 | -0.302 | 1.21 | 1.41 | 0.582 | 0.562 | 0.810 | 0.912 | 0.686 |
Download Data |
Period Mean (original grids) [Pg yr-1] |
Model Period Mean (intersection) [Pg yr-1] |
Benchmark Period Mean (intersection) [Pg yr-1] |
Model Period Mean (complement) [Pg yr-1] |
Benchmark Period Mean (complement) [Pg yr-1] |
Bias [g m-2 d-1] |
RMSE [g m-2 d-1] |
Phase Shift [months] |
Bias Score [1] |
RMSE Score [1] |
Seasonal Cycle Score [1] |
Spatial Distribution Score [1] |
Overall Score [1] |
|||
|---|---|---|---|---|---|---|---|---|---|---|---|---|---|---|---|---|
| Benchmark | [-] | 7.67 | ||||||||||||||
| 271 | [-] | 5.99 | 5.67 | 7.67 | 0.266 | 0.000596 | -0.494 | 1.30 | 1.04 | 0.431 | 0.696 | 0.881 | 0.929 | 0.726 | ||
| 330 | [-] | 7.67 | 7.29 | 7.67 | 0.317 | 0.000596 | 0.0206 | 1.24 | 1.11 | 0.482 | 0.698 | 0.871 | 0.902 | 0.730 | ||
| CMIP6_001 | [-] | 8.86 | 8.43 | 7.65 | 0.336 | 0.0194 | 0.374 | 1.74 | 1.24 | 0.369 | 0.627 | 0.851 | 0.689 | 0.632 |
Download Data |
Period Mean (original grids) [Pg yr-1] |
Model Period Mean (intersection) [Pg yr-1] |
Benchmark Period Mean (intersection) [Pg yr-1] |
Model Period Mean (complement) [Pg yr-1] |
Benchmark Period Mean (complement) [Pg yr-1] |
Bias [g m-2 d-1] |
RMSE [g m-2 d-1] |
Phase Shift [months] |
Bias Score [1] |
RMSE Score [1] |
Seasonal Cycle Score [1] |
Spatial Distribution Score [1] |
Overall Score [1] |
|||
|---|---|---|---|---|---|---|---|---|---|---|---|---|---|---|---|---|
| Benchmark | [-] | 0.268 | ||||||||||||||
| 271 | [-] | 0.792 | 0.757 | 0.268 | 0.0415 | 0.506 | 1.13 | 0.151 | 0.265 | 0.160 | 0.988 | 0.697 | 0.454 | |||
| 330 | [-] | 0.859 | 0.819 | 0.268 | 0.0468 | 0.569 | 1.16 | 0.164 | 0.268 | 0.157 | 0.988 | 0.686 | 0.451 | |||
| CMIP6_001 | [-] | 1.19 | 1.19 | 0.266 | 0.0136 | 0.00214 | 0.827 | 1.56 | 0.428 | 0.207 | 0.116 | 0.946 | 0.365 | 0.350 |
Download Data |
Period Mean (original grids) [Pg yr-1] |
Model Period Mean (intersection) [Pg yr-1] |
Benchmark Period Mean (intersection) [Pg yr-1] |
Model Period Mean (complement) [Pg yr-1] |
Benchmark Period Mean (complement) [Pg yr-1] |
Bias [g m-2 d-1] |
RMSE [g m-2 d-1] |
Phase Shift [months] |
Bias Score [1] |
RMSE Score [1] |
Seasonal Cycle Score [1] |
Spatial Distribution Score [1] |
Overall Score [1] |
|||
|---|---|---|---|---|---|---|---|---|---|---|---|---|---|---|---|---|
| Benchmark | [-] | 5.87 | ||||||||||||||
| 271 | [-] | 5.93 | 4.85 | 5.87 | 1.04 | 0.00716 | 0.930 | 1.93 | 2.74 | 0.533 | 0.877 | 0.558 | 0.656 | 0.700 | ||
| 330 | [-] | 6.48 | 5.30 | 5.87 | 1.14 | 0.00716 | 1.51 | 2.16 | 2.63 | 0.506 | 0.877 | 0.579 | 0.757 | 0.719 | ||
| CMIP6_001 | [-] | 6.33 | 5.33 | 5.72 | 0.964 | 0.154 | 1.34 | 1.90 | 2.48 | 0.567 | 0.905 | 0.604 | 0.527 | 0.702 |
Download Data |
Period Mean (original grids) [Pg yr-1] |
Model Period Mean (intersection) [Pg yr-1] |
Benchmark Period Mean (intersection) [Pg yr-1] |
Model Period Mean (complement) [Pg yr-1] |
Benchmark Period Mean (complement) [Pg yr-1] |
Bias [g m-2 d-1] |
RMSE [g m-2 d-1] |
Phase Shift [months] |
Bias Score [1] |
RMSE Score [1] |
Seasonal Cycle Score [1] |
Spatial Distribution Score [1] |
Overall Score [1] |
|||
|---|---|---|---|---|---|---|---|---|---|---|---|---|---|---|---|---|
| Benchmark | [-] | 4.81 | ||||||||||||||
| 271 | [-] | 4.91 | 4.72 | 4.81 | 0.0529 | 1.65e-06 | 0.00521 | 1.22 | 0.0207 | 0.336 | 0.298 | 0.999 | 0.917 | 0.570 | ||
| 330 | [-] | 5.99 | 5.78 | 4.81 | 0.0619 | 1.65e-06 | 0.337 | 1.04 | 0.0278 | 0.427 | 0.370 | 0.998 | 0.846 | 0.602 | ||
| CMIP6_001 | [-] | 7.14 | 6.90 | 4.80 | 0.0702 | 0.00239 | 0.667 | 1.18 | 0.0917 | 0.362 | 0.364 | 0.994 | 0.945 | 0.606 |
Download Data |
Period Mean (original grids) [Pg yr-1] |
Model Period Mean (intersection) [Pg yr-1] |
Benchmark Period Mean (intersection) [Pg yr-1] |
Model Period Mean (complement) [Pg yr-1] |
Benchmark Period Mean (complement) [Pg yr-1] |
Bias [g m-2 d-1] |
RMSE [g m-2 d-1] |
Phase Shift [months] |
Bias Score [1] |
RMSE Score [1] |
Seasonal Cycle Score [1] |
Spatial Distribution Score [1] |
Overall Score [1] |
|||
|---|---|---|---|---|---|---|---|---|---|---|---|---|---|---|---|---|
| Benchmark | [-] | 8.54 | ||||||||||||||
| 271 | [-] | 9.24 | 9.05 | 8.54 | 0.313 | 0.170 | 0.842 | 0.735 | 0.486 | 0.611 | 0.925 | 0.945 | 0.716 | |||
| 330 | [-] | 9.26 | 9.07 | 8.54 | 0.311 | 0.171 | 0.877 | 0.743 | 0.495 | 0.606 | 0.925 | 0.938 | 0.714 | |||
| CMIP6_001 | [-] | 10.9 | 10.8 | 8.53 | 0.315 | 0.00868 | 0.417 | 1.21 | 0.922 | 0.375 | 0.476 | 0.907 | 0.911 | 0.629 |
Download Data |
Period Mean (original grids) [Pg yr-1] |
Model Period Mean (intersection) [Pg yr-1] |
Benchmark Period Mean (intersection) [Pg yr-1] |
Model Period Mean (complement) [Pg yr-1] |
Benchmark Period Mean (complement) [Pg yr-1] |
Bias [g m-2 d-1] |
RMSE [g m-2 d-1] |
Phase Shift [months] |
Bias Score [1] |
RMSE Score [1] |
Seasonal Cycle Score [1] |
Spatial Distribution Score [1] |
Overall Score [1] |
|||
|---|---|---|---|---|---|---|---|---|---|---|---|---|---|---|---|---|
| Benchmark | [-] | 6.81 | ||||||||||||||
| 271 | [-] | 6.01 | 5.47 | 6.81 | 0.458 | 0.00128 | -0.118 | 1.18 | 1.34 | 0.602 | 0.727 | 0.829 | 0.955 | 0.768 | ||
| 330 | [-] | 6.44 | 5.86 | 6.81 | 0.493 | 0.00128 | 0.0820 | 1.18 | 1.35 | 0.608 | 0.733 | 0.827 | 0.943 | 0.769 | ||
| CMIP6_001 | [-] | 6.38 | 5.79 | 6.77 | 0.457 | 0.0385 | 0.0214 | 1.35 | 1.84 | 0.552 | 0.698 | 0.743 | 0.887 | 0.716 |
Download Data |
Period Mean (original grids) [Pg yr-1] |
Model Period Mean (intersection) [Pg yr-1] |
Benchmark Period Mean (intersection) [Pg yr-1] |
Model Period Mean (complement) [Pg yr-1] |
Benchmark Period Mean (complement) [Pg yr-1] |
Bias [g m-2 d-1] |
RMSE [g m-2 d-1] |
Phase Shift [months] |
Bias Score [1] |
RMSE Score [1] |
Seasonal Cycle Score [1] |
Spatial Distribution Score [1] |
Overall Score [1] |
|||
|---|---|---|---|---|---|---|---|---|---|---|---|---|---|---|---|---|
| Benchmark | [-] | 0.433 | ||||||||||||||
| 271 | [-] | 0.741 | 0.748 | 0.433 | 0.0127 | 7.17e-07 | 0.280 | 1.13 | 0.493 | 0.438 | 0.127 | 0.965 | 0.790 | 0.489 | ||
| 330 | [-] | 0.844 | 0.860 | 0.433 | 0.0139 | 7.17e-07 | 0.373 | 1.08 | 0.449 | 0.424 | 0.153 | 0.969 | 0.813 | 0.502 | ||
| CMIP6_001 | [-] | 0.670 | 0.693 | 0.432 | 0.00202 | 0.000674 | 0.215 | 1.54 | 0.979 | 0.281 | 0.0887 | 0.891 | 0.429 | 0.356 |
Download Data |
Period Mean (original grids) [Pg yr-1] |
Model Period Mean (intersection) [Pg yr-1] |
Benchmark Period Mean (intersection) [Pg yr-1] |
Model Period Mean (complement) [Pg yr-1] |
Benchmark Period Mean (complement) [Pg yr-1] |
Bias [g m-2 d-1] |
RMSE [g m-2 d-1] |
Phase Shift [months] |
Bias Score [1] |
RMSE Score [1] |
Seasonal Cycle Score [1] |
Spatial Distribution Score [1] |
Overall Score [1] |
|||
|---|---|---|---|---|---|---|---|---|---|---|---|---|---|---|---|---|
| Benchmark | [-] | 3.22 | ||||||||||||||
| 271 | [-] | 4.37 | 4.09 | 3.22 | 0.272 | 0.00226 | 0.495 | 0.844 | 1.39 | 0.426 | 0.772 | 0.820 | 0.902 | 0.738 | ||
| 330 | [-] | 4.65 | 4.37 | 3.22 | 0.277 | 0.00226 | 0.608 | 0.954 | 1.29 | 0.396 | 0.729 | 0.834 | 0.857 | 0.709 | ||
| CMIP6_001 | [-] | 4.74 | 4.33 | 3.19 | 0.391 | 0.0315 | 0.600 | 0.885 | 1.46 | 0.501 | 0.726 | 0.805 | 0.728 | 0.697 |
Download Data |
Period Mean (original grids) [Pg yr-1] |
Model Period Mean (intersection) [Pg yr-1] |
Benchmark Period Mean (intersection) [Pg yr-1] |
Model Period Mean (complement) [Pg yr-1] |
Benchmark Period Mean (complement) [Pg yr-1] |
Bias [g m-2 d-1] |
RMSE [g m-2 d-1] |
Phase Shift [months] |
Bias Score [1] |
RMSE Score [1] |
Seasonal Cycle Score [1] |
Spatial Distribution Score [1] |
Overall Score [1] |
|||
|---|---|---|---|---|---|---|---|---|---|---|---|---|---|---|---|---|
| Benchmark | [-] | 4.41 | ||||||||||||||
| 271 | [-] | 2.95 | 2.74 | 4.41 | 0.169 | 0.000463 | -0.566 | 1.22 | 0.388 | 0.346 | 0.519 | 0.972 | 0.789 | 0.629 | ||
| 330 | [-] | 3.25 | 3.02 | 4.41 | 0.183 | 0.000463 | -0.404 | 1.18 | 0.407 | 0.395 | 0.520 | 0.971 | 0.738 | 0.629 | ||
| CMIP6_001 | [-] | 4.02 | 3.81 | 4.39 | 0.161 | 0.0266 | -0.0125 | 1.12 | 0.473 | 0.470 | 0.487 | 0.965 | 0.946 | 0.671 |
Download Data |
Period Mean (original grids) [Pg yr-1] |
Model Period Mean (intersection) [Pg yr-1] |
Benchmark Period Mean (intersection) [Pg yr-1] |
Model Period Mean (complement) [Pg yr-1] |
Benchmark Period Mean (complement) [Pg yr-1] |
Bias [g m-2 d-1] |
RMSE [g m-2 d-1] |
Phase Shift [months] |
Bias Score [1] |
RMSE Score [1] |
Seasonal Cycle Score [1] |
Spatial Distribution Score [1] |
Overall Score [1] |
|||
|---|---|---|---|---|---|---|---|---|---|---|---|---|---|---|---|---|
| Benchmark | [-] | 93.9 | ||||||||||||||
| 271 | [-] | 90.8 | 86.3 | 93.9 | 4.29 | 0.0179 | 0.0128 | 1.10 | 1.01 | 0.473 | 0.611 | 0.873 | 0.937 | 0.701 | ||
| 330 | [-] | 105. | 100. | 93.9 | 4.67 | 0.0179 | 0.327 | 1.11 | 1.04 | 0.487 | 0.600 | 0.869 | 0.949 | 0.701 | ||
| CMIP6_001 | [-] | 105. | 100. | 93.5 | 4.08 | 0.380 | 0.318 | 1.26 | 1.18 | 0.455 | 0.560 | 0.847 | 0.930 | 0.670 |
Download Data |
Period Mean (original grids) [Pg yr-1] |
Model Period Mean (intersection) [Pg yr-1] |
Benchmark Period Mean (intersection) [Pg yr-1] |
Model Period Mean (complement) [Pg yr-1] |
Benchmark Period Mean (complement) [Pg yr-1] |
Bias [g m-2 d-1] |
RMSE [g m-2 d-1] |
Phase Shift [months] |
Bias Score [1] |
RMSE Score [1] |
Seasonal Cycle Score [1] |
Spatial Distribution Score [1] |
Overall Score [1] |
|||
|---|---|---|---|---|---|---|---|---|---|---|---|---|---|---|---|---|
| Benchmark | [-] | 0.942 | ||||||||||||||
| 271 | [-] | 1.41 | 1.34 | 0.942 | 0.0895 | 0.000118 | 0.185 | 0.376 | 1.74 | 0.731 | 0.794 | 0.746 | 0.909 | 0.795 | ||
| 330 | [-] | 1.52 | 1.46 | 0.942 | 0.0944 | 0.000118 | 0.229 | 0.410 | 1.76 | 0.702 | 0.781 | 0.745 | 0.892 | 0.780 | ||
| CMIP6_001 | [-] | 1.34 | 1.31 | 0.938 | 0.0521 | 0.00457 | 0.153 | 0.425 | 1.85 | 0.729 | 0.749 | 0.730 | 0.885 | 0.768 |
Download Data |
Period Mean (original grids) [Pg yr-1] |
Model Period Mean (intersection) [Pg yr-1] |
Benchmark Period Mean (intersection) [Pg yr-1] |
Model Period Mean (complement) [Pg yr-1] |
Benchmark Period Mean (complement) [Pg yr-1] |
Bias [g m-2 d-1] |
RMSE [g m-2 d-1] |
Phase Shift [months] |
Bias Score [1] |
RMSE Score [1] |
Seasonal Cycle Score [1] |
Spatial Distribution Score [1] |
Overall Score [1] |
|||
|---|---|---|---|---|---|---|---|---|---|---|---|---|---|---|---|---|
| Benchmark | [-] | 1.28 | ||||||||||||||
| 271 | [-] | 1.73 | 1.65 | 1.28 | 0.0525 | 0.214 | 0.774 | 0.377 | 0.523 | 0.417 | 0.968 | 0.730 | 0.611 | |||
| 330 | [-] | 2.10 | 2.01 | 1.28 | 0.0604 | 0.374 | 0.933 | 0.365 | 0.462 | 0.373 | 0.969 | 0.588 | 0.553 | |||
| CMIP6_001 | [-] | 1.80 | 1.79 | 1.28 | 0.0332 | 0.00304 | 0.246 | 1.03 | 0.841 | 0.409 | 0.339 | 0.897 | 0.502 | 0.497 |
Download Data |
Period Mean (original grids) [Pg yr-1] |
Model Period Mean (intersection) [Pg yr-1] |
Benchmark Period Mean (intersection) [Pg yr-1] |
Model Period Mean (complement) [Pg yr-1] |
Benchmark Period Mean (complement) [Pg yr-1] |
Bias [g m-2 d-1] |
RMSE [g m-2 d-1] |
Phase Shift [months] |
Bias Score [1] |
RMSE Score [1] |
Seasonal Cycle Score [1] |
Spatial Distribution Score [1] |
Overall Score [1] |
|||
|---|---|---|---|---|---|---|---|---|---|---|---|---|---|---|---|---|
| Benchmark | [-] | 2.84 | ||||||||||||||
| 271 | [-] | 3.16 | 2.63 | 2.83 | 0.432 | 0.00547 | 0.559 | 1.36 | 1.29 | 0.462 | 0.727 | 0.841 | 0.940 | 0.740 | ||
| 330 | [-] | 3.59 | 3.02 | 2.83 | 0.483 | 0.00547 | 1.01 | 1.51 | 1.32 | 0.411 | 0.725 | 0.832 | 0.952 | 0.729 | ||
| CMIP6_001 | [-] | 3.18 | 2.77 | 2.81 | 0.342 | 0.0214 | 0.586 | 1.62 | 1.87 | 0.406 | 0.699 | 0.735 | 0.918 | 0.691 |
Download Data |
Period Mean (original grids) [Pg yr-1] |
Model Period Mean (intersection) [Pg yr-1] |
Benchmark Period Mean (intersection) [Pg yr-1] |
Model Period Mean (complement) [Pg yr-1] |
Benchmark Period Mean (complement) [Pg yr-1] |
Bias [g m-2 d-1] |
RMSE [g m-2 d-1] |
Phase Shift [months] |
Bias Score [1] |
RMSE Score [1] |
Seasonal Cycle Score [1] |
Spatial Distribution Score [1] |
Overall Score [1] |
|||
|---|---|---|---|---|---|---|---|---|---|---|---|---|---|---|---|---|
| Benchmark | [-] | 3.76 | ||||||||||||||
| 271 | [-] | 3.69 | 3.49 | 3.76 | 0.137 | 1.58e-05 | -0.0487 | 0.849 | 0.659 | 0.628 | 0.640 | 0.948 | 0.956 | 0.762 | ||
| 330 | [-] | 3.81 | 3.60 | 3.76 | 0.141 | 1.58e-05 | 0.0352 | 0.881 | 0.854 | 0.648 | 0.607 | 0.931 | 0.939 | 0.747 | ||
| CMIP6_001 | [-] | 3.50 | 3.32 | 3.75 | 0.116 | 0.00457 | -0.162 | 1.17 | 0.776 | 0.551 | 0.516 | 0.935 | 0.904 | 0.685 |
Download Data |
Period Mean (original grids) [Pg yr-1] |
Model Period Mean (intersection) [Pg yr-1] |
Benchmark Period Mean (intersection) [Pg yr-1] |
Model Period Mean (complement) [Pg yr-1] |
Benchmark Period Mean (complement) [Pg yr-1] |
Bias [g m-2 d-1] |
RMSE [g m-2 d-1] |
Phase Shift [months] |
Bias Score [1] |
RMSE Score [1] |
Seasonal Cycle Score [1] |
Spatial Distribution Score [1] |
Overall Score [1] |
|||
|---|---|---|---|---|---|---|---|---|---|---|---|---|---|---|---|---|
| Benchmark | [-] | 2.78 | ||||||||||||||
| 271 | [-] | 2.57 | 2.53 | 2.78 | 0.0768 | -0.0246 | 0.847 | 0.156 | 0.468 | 0.588 | 0.989 | 0.810 | 0.689 | |||
| 330 | [-] | 3.42 | 3.36 | 2.78 | 0.0820 | 0.411 | 0.840 | 0.267 | 0.481 | 0.593 | 0.981 | 0.951 | 0.720 | |||
| CMIP6_001 | [-] | 4.01 | 3.92 | 2.76 | 0.0630 | 0.0181 | 0.700 | 1.36 | 0.369 | 0.317 | 0.385 | 0.972 | 0.705 | 0.553 |
Download Data |
Period Mean (original grids) [Pg yr-1] |
Model Period Mean (intersection) [Pg yr-1] |
Benchmark Period Mean (intersection) [Pg yr-1] |
Model Period Mean (complement) [Pg yr-1] |
Benchmark Period Mean (complement) [Pg yr-1] |
Bias [g m-2 d-1] |
RMSE [g m-2 d-1] |
Phase Shift [months] |
Bias Score [1] |
RMSE Score [1] |
Seasonal Cycle Score [1] |
Spatial Distribution Score [1] |
Overall Score [1] |
|||
|---|---|---|---|---|---|---|---|---|---|---|---|---|---|---|---|---|
| Benchmark | [-] | 1.53 | ||||||||||||||
| 271 | [-] | 1.51 | 1.56 | 1.53 | 0.0207 | 0.0912 | 0.540 | 0.860 | 0.627 | 0.743 | 0.922 | 0.915 | 0.790 | |||
| 330 | [-] | 1.62 | 1.68 | 1.53 | 0.0219 | 0.169 | 0.577 | 0.807 | 0.608 | 0.723 | 0.926 | 0.910 | 0.778 | |||
| CMIP6_001 | [-] | 1.15 | 1.21 | 1.52 | 0.00967 | 0.00362 | -0.167 | 0.690 | 1.06 | 0.577 | 0.678 | 0.878 | 0.908 | 0.744 |
Download Data |
Period Mean (original grids) [Pg yr-1] |
Model Period Mean (intersection) [Pg yr-1] |
Benchmark Period Mean (intersection) [Pg yr-1] |
Model Period Mean (complement) [Pg yr-1] |
Benchmark Period Mean (complement) [Pg yr-1] |
Bias [g m-2 d-1] |
RMSE [g m-2 d-1] |
Phase Shift [months] |
Bias Score [1] |
RMSE Score [1] |
Seasonal Cycle Score [1] |
Spatial Distribution Score [1] |
Overall Score [1] |
|||
|---|---|---|---|---|---|---|---|---|---|---|---|---|---|---|---|---|
| Benchmark | [-] | 18.7 | ||||||||||||||
| 271 | [-] | 15.1 | 14.9 | 18.7 | 0.182 | -1.09 | 1.90 | 1.67 | 0.442 | 0.737 | 0.764 | 0.942 | 0.724 | |||
| 330 | [-] | 19.0 | 18.7 | 18.7 | 0.205 | 0.168 | 1.52 | 1.67 | 0.625 | 0.688 | 0.765 | 0.984 | 0.750 | |||
| CMIP6_001 | [-] | 18.4 | 18.2 | 18.7 | 0.138 | 0.0172 | 0.0187 | 1.61 | 1.60 | 0.572 | 0.720 | 0.775 | 0.975 | 0.752 |
Download Data |
Period Mean (original grids) [Pg yr-1] |
Model Period Mean (intersection) [Pg yr-1] |
Benchmark Period Mean (intersection) [Pg yr-1] |
Model Period Mean (complement) [Pg yr-1] |
Benchmark Period Mean (complement) [Pg yr-1] |
Bias [g m-2 d-1] |
RMSE [g m-2 d-1] |
Phase Shift [months] |
Bias Score [1] |
RMSE Score [1] |
Seasonal Cycle Score [1] |
Spatial Distribution Score [1] |
Overall Score [1] |
|||
|---|---|---|---|---|---|---|---|---|---|---|---|---|---|---|---|---|
| Benchmark | [-] | 8.12 | ||||||||||||||
| 271 | [-] | 6.19 | 6.06 | 8.11 | 0.253 | 0.000394 | -0.790 | 1.39 | 1.01 | 0.474 | 0.730 | 0.899 | 0.962 | 0.759 | ||
| 330 | [-] | 7.74 | 7.61 | 8.11 | 0.292 | 0.000394 | -0.121 | 1.42 | 1.08 | 0.484 | 0.689 | 0.888 | 0.853 | 0.721 | ||
| CMIP6_001 | [-] | 6.98 | 6.89 | 8.11 | 0.256 | 0.00281 | -0.412 | 1.53 | 1.29 | 0.468 | 0.671 | 0.858 | 0.782 | 0.690 |
Download Data |
Period Mean (original grids) [Pg yr-1] |
Model Period Mean (intersection) [Pg yr-1] |
Benchmark Period Mean (intersection) [Pg yr-1] |
Model Period Mean (complement) [Pg yr-1] |
Benchmark Period Mean (complement) [Pg yr-1] |
Bias [g m-2 d-1] |
RMSE [g m-2 d-1] |
Phase Shift [months] |
Bias Score [1] |
RMSE Score [1] |
Seasonal Cycle Score [1] |
Spatial Distribution Score [1] |
Overall Score [1] |
|||
|---|---|---|---|---|---|---|---|---|---|---|---|---|---|---|---|---|
| Benchmark | [-] | 1.01 | ||||||||||||||
| 271 | [-] | 2.10 | 1.87 | 1.01 | 0.130 | 0.000142 | 0.941 | 1.20 | 1.30 | 0.275 | 0.652 | 0.834 | 0.883 | 0.659 | ||
| 330 | [-] | 2.29 | 2.06 | 1.01 | 0.135 | 0.000142 | 1.12 | 1.34 | 1.32 | 0.232 | 0.611 | 0.834 | 0.863 | 0.630 | ||
| CMIP6_001 | [-] | 2.15 | 1.97 | 0.996 | 0.0889 | 0.0112 | 1.06 | 1.37 | 1.52 | 0.266 | 0.577 | 0.798 | 0.798 | 0.603 |
Temporally integrated period mean