Mean State
Download Data |
Period Mean (original grids) [Pg] |
Model Period Mean (intersection) [Pg] |
Benchmark Period Mean (intersection) [Pg] |
Model Period Mean (complement) [Pg] |
Benchmark Period Mean (complement) [Pg] |
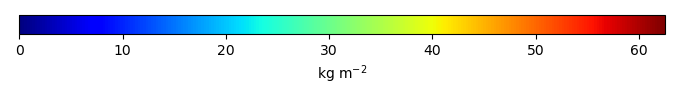
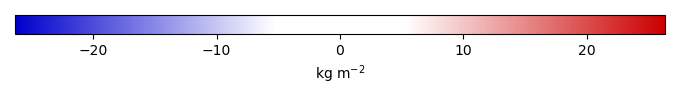
Bias [kg m-2] |
Bias Score [1] |
Spatial Distribution Score [1] |
Overall Score [1] |
|||
|---|---|---|---|---|---|---|---|---|---|---|---|---|
| Benchmark | [-] | 34.1 | ||||||||||
| 271 | [-] | 55.4 | 56.4 | 34.1 | 0.592 | 0.00195 | 5.62 | 0.451 | 0.668 | 0.560 | ||
| 330 | [-] | 51.6 | 52.9 | 34.1 | 0.539 | 0.00195 | 4.77 | 0.488 | 0.781 | 0.634 | ||
| CMIP6_001 | [-] | 34.5 | 35.0 | 33.8 | 0.267 | 0.315 | 0.733 | 0.676 | 0.916 | 0.796 |
Download Data |
Period Mean (original grids) [Pg] |
Model Period Mean (intersection) [Pg] |
Benchmark Period Mean (intersection) [Pg] |
Model Period Mean (complement) [Pg] |
Benchmark Period Mean (complement) [Pg] |
Bias [kg m-2] |
Bias Score [1] |
Spatial Distribution Score [1] |
Overall Score [1] |
|||
|---|---|---|---|---|---|---|---|---|---|---|---|---|
| Benchmark | [-] | 44.8 | ||||||||||
| 271 | [-] | 28.4 | 26.8 | 44.8 | 0.0785 | 0.0633 | -2.57 | 0.609 | 0.878 | 0.744 | ||
| 330 | [-] | 29.2 | 27.4 | 44.8 | 0.0720 | 0.0633 | -2.49 | 0.613 | 0.875 | 0.744 | ||
| CMIP6_001 | [-] | 16.3 | 15.4 | 44.4 | 0.0240 | 0.478 | -4.21 | 0.499 | 0.840 | 0.669 |
Download Data |
Period Mean (original grids) [Pg] |
Model Period Mean (intersection) [Pg] |
Benchmark Period Mean (intersection) [Pg] |
Model Period Mean (complement) [Pg] |
Benchmark Period Mean (complement) [Pg] |
Bias [kg m-2] |
Bias Score [1] |
Spatial Distribution Score [1] |
Overall Score [1] |
|||
|---|---|---|---|---|---|---|---|---|---|---|---|---|
| Benchmark | [-] | 60.1 | ||||||||||
| 271 | [-] | 49.4 | 47.8 | 60.0 | 1.17 | 0.0611 | -0.720 | 0.593 | 0.699 | 0.646 | ||
| 330 | [-] | 50.5 | 48.9 | 60.0 | 1.16 | 0.0611 | -0.611 | 0.598 | 0.713 | 0.656 | ||
| CMIP6_001 | [-] | 39.1 | 38.2 | 59.3 | 0.682 | 0.762 | -1.87 | 0.565 | 0.786 | 0.676 |
Download Data |
Period Mean (original grids) [Pg] |
Model Period Mean (intersection) [Pg] |
Benchmark Period Mean (intersection) [Pg] |
Model Period Mean (complement) [Pg] |
Benchmark Period Mean (complement) [Pg] |
Bias [kg m-2] |
Bias Score [1] |
Spatial Distribution Score [1] |
Overall Score [1] |
|||
|---|---|---|---|---|---|---|---|---|---|---|---|---|
| Benchmark | [-] | 11.1 | ||||||||||
| 271 | [-] | 96.1 | 6.25 | 11.1 | 90.3 | 1.92 | 0.441 | 0.545 | 0.493 | |||
| 330 | [-] | 100. | 6.43 | 11.1 | 94.1 | 2.38 | 0.442 | 0.594 | 0.518 | |||
| CMIP6_001 | [-] | 62.7 | 3.43 | 10.3 | 59.5 | 0.803 | -8.34 | 0.390 | 0.410 | 0.400 |
Download Data |
Period Mean (original grids) [Pg] |
Model Period Mean (intersection) [Pg] |
Benchmark Period Mean (intersection) [Pg] |
Model Period Mean (complement) [Pg] |
Benchmark Period Mean (complement) [Pg] |
Bias [kg m-2] |
Bias Score [1] |
Spatial Distribution Score [1] |
Overall Score [1] |
|||
|---|---|---|---|---|---|---|---|---|---|---|---|---|
| Benchmark | [-] | 55.7 | ||||||||||
| 271 | [-] | 34.8 | 32.0 | 55.5 | 2.56 | 0.256 | -0.898 | 0.703 | 0.530 | 0.616 | ||
| 330 | [-] | 33.1 | 30.5 | 55.5 | 2.40 | 0.256 | -1.59 | 0.718 | 0.432 | 0.575 | ||
| CMIP6_001 | [-] | 23.8 | 22.3 | 50.7 | 1.35 | 4.99 | -5.20 | 0.740 | 0.311 | 0.526 |
Download Data |
Period Mean (original grids) [Pg] |
Model Period Mean (intersection) [Pg] |
Benchmark Period Mean (intersection) [Pg] |
Model Period Mean (complement) [Pg] |
Benchmark Period Mean (complement) [Pg] |
Bias [kg m-2] |
Bias Score [1] |
Spatial Distribution Score [1] |
Overall Score [1] |
|||
|---|---|---|---|---|---|---|---|---|---|---|---|---|
| Benchmark | [-] | 65.6 | ||||||||||
| 271 | [-] | 185. | 60.9 | 65.6 | 120. | 0.0110 | -0.374 | 0.607 | 0.901 | 0.754 | ||
| 330 | [-] | 190. | 61.2 | 65.6 | 124. | 0.0110 | -0.245 | 0.640 | 0.897 | 0.769 | ||
| CMIP6_001 | [-] | 149. | 54.3 | 65.2 | 91.1 | 0.461 | -2.28 | 0.683 | 0.728 | 0.705 |
Download Data |
Period Mean (original grids) [Pg] |
Model Period Mean (intersection) [Pg] |
Benchmark Period Mean (intersection) [Pg] |
Model Period Mean (complement) [Pg] |
Benchmark Period Mean (complement) [Pg] |
Bias [kg m-2] |
Bias Score [1] |
Spatial Distribution Score [1] |
Overall Score [1] |
|||
|---|---|---|---|---|---|---|---|---|---|---|---|---|
| Benchmark | [-] | 143. | ||||||||||
| 271 | [-] | 170. | 149. | 143. | 24.3 | 0.0553 | 0.896 | 0.590 | 0.628 | 0.609 | ||
| 330 | [-] | 180. | 161. | 143. | 22.2 | 0.0553 | 1.51 | 0.586 | 0.256 | 0.421 | ||
| CMIP6_001 | [-] | 118. | 107. | 142. | 12.9 | 0.973 | -1.71 | 0.565 | 0.768 | 0.667 |
Download Data |
Period Mean (original grids) [Pg] |
Model Period Mean (intersection) [Pg] |
Benchmark Period Mean (intersection) [Pg] |
Model Period Mean (complement) [Pg] |
Benchmark Period Mean (complement) [Pg] |
Bias [kg m-2] |
Bias Score [1] |
Spatial Distribution Score [1] |
Overall Score [1] |
|||
|---|---|---|---|---|---|---|---|---|---|---|---|---|
| Benchmark | [-] | 58.4 | ||||||||||
| 271 | [-] | 60.1 | 57.3 | 58.3 | 1.66 | 0.112 | 1.57 | 0.645 | 0.694 | 0.670 | ||
| 330 | [-] | 57.0 | 54.0 | 58.3 | 1.51 | 0.112 | 0.979 | 0.650 | 0.676 | 0.663 | ||
| CMIP6_001 | [-] | 33.0 | 31.4 | 56.8 | 0.830 | 1.57 | -2.58 | 0.616 | 0.795 | 0.705 |
Download Data |
Period Mean (original grids) [Pg] |
Model Period Mean (intersection) [Pg] |
Benchmark Period Mean (intersection) [Pg] |
Model Period Mean (complement) [Pg] |
Benchmark Period Mean (complement) [Pg] |
Bias [kg m-2] |
Bias Score [1] |
Spatial Distribution Score [1] |
Overall Score [1] |
|||
|---|---|---|---|---|---|---|---|---|---|---|---|---|
| Benchmark | [-] | 7.78 | ||||||||||
| 271 | [-] | 163. | 10.9 | 7.77 | 154. | 0.00477 | 21.0 | 0.332 | 0.265 | 0.299 | ||
| 330 | [-] | 163. | 10.6 | 7.77 | 154. | 0.00477 | 19.7 | 0.348 | 0.287 | 0.317 | ||
| CMIP6_001 | [-] | 44.4 | 0.983 | 7.36 | 44.0 | 0.414 | -12.4 | 0.377 | 0.514 | 0.446 |
Download Data |
Period Mean (original grids) [Pg] |
Model Period Mean (intersection) [Pg] |
Benchmark Period Mean (intersection) [Pg] |
Model Period Mean (complement) [Pg] |
Benchmark Period Mean (complement) [Pg] |
Bias [kg m-2] |
Bias Score [1] |
Spatial Distribution Score [1] |
Overall Score [1] |
|||
|---|---|---|---|---|---|---|---|---|---|---|---|---|
| Benchmark | [-] | 58.9 | ||||||||||
| 271 | [-] | 48.3 | 46.7 | 58.6 | 1.46 | 0.283 | -0.442 | 0.693 | 0.629 | 0.661 | ||
| 330 | [-] | 44.2 | 42.8 | 58.6 | 1.31 | 0.283 | -0.981 | 0.705 | 0.762 | 0.734 | ||
| CMIP6_001 | [-] | 25.6 | 24.4 | 57.4 | 1.08 | 1.53 | -3.09 | 0.540 | 0.597 | 0.568 |
Download Data |
Period Mean (original grids) [Pg] |
Model Period Mean (intersection) [Pg] |
Benchmark Period Mean (intersection) [Pg] |
Model Period Mean (complement) [Pg] |
Benchmark Period Mean (complement) [Pg] |
Bias [kg m-2] |
Bias Score [1] |
Spatial Distribution Score [1] |
Overall Score [1] |
|||
|---|---|---|---|---|---|---|---|---|---|---|---|---|
| Benchmark | [-] | 61.8 | ||||||||||
| 271 | [-] | 51.6 | 45.7 | 61.7 | 5.07 | 0.0572 | -0.798 | 0.638 | 0.853 | 0.746 | ||
| 330 | [-] | 46.6 | 40.9 | 61.7 | 4.85 | 0.0572 | -1.87 | 0.659 | 0.824 | 0.741 | ||
| CMIP6_001 | [-] | 36.5 | 33.8 | 60.2 | 2.23 | 1.58 | -3.65 | 0.703 | 0.704 | 0.704 |
Download Data |
Period Mean (original grids) [Pg] |
Model Period Mean (intersection) [Pg] |
Benchmark Period Mean (intersection) [Pg] |
Model Period Mean (complement) [Pg] |
Benchmark Period Mean (complement) [Pg] |
Bias [kg m-2] |
Bias Score [1] |
Spatial Distribution Score [1] |
Overall Score [1] |
|||
|---|---|---|---|---|---|---|---|---|---|---|---|---|
| Benchmark | [-] | 1.05e+03 | ||||||||||
| 271 | [-] | 1.51e+03 | 931. | 1.05e+03 | 582. | 1.51 | 0.197 | 0.587 | 0.791 | 0.689 | ||
| 330 | [-] | 1.52e+03 | 909. | 1.05e+03 | 607. | 1.51 | -0.0752 | 0.597 | 0.741 | 0.669 | ||
| CMIP6_001 | [-] | 956. | 616. | 1.02e+03 | 337. | 23.7 | -2.63 | 0.583 | 0.163 | 0.373 |
Download Data |
Period Mean (original grids) [Pg] |
Model Period Mean (intersection) [Pg] |
Benchmark Period Mean (intersection) [Pg] |
Model Period Mean (complement) [Pg] |
Benchmark Period Mean (complement) [Pg] |
Bias [kg m-2] |
Bias Score [1] |
Spatial Distribution Score [1] |
Overall Score [1] |
|||
|---|---|---|---|---|---|---|---|---|---|---|---|---|
| Benchmark | [-] | 64.3 | ||||||||||
| 271 | [-] | 31.0 | 30.6 | 64.3 | 0.865 | 0.0301 | -1.72 | 0.453 | 0.414 | 0.434 | ||
| 330 | [-] | 27.8 | 27.5 | 64.3 | 0.765 | 0.0301 | -1.95 | 0.459 | 0.498 | 0.478 | ||
| CMIP6_001 | [-] | 15.1 | 15.0 | 63.6 | 0.276 | 0.698 | -2.89 | 0.452 | 0.808 | 0.630 |
Download Data |
Period Mean (original grids) [Pg] |
Model Period Mean (intersection) [Pg] |
Benchmark Period Mean (intersection) [Pg] |
Model Period Mean (complement) [Pg] |
Benchmark Period Mean (complement) [Pg] |
Bias [kg m-2] |
Bias Score [1] |
Spatial Distribution Score [1] |
Overall Score [1] |
|||
|---|---|---|---|---|---|---|---|---|---|---|---|---|
| Benchmark | [-] | 13.3 | ||||||||||
| 271 | [-] | 150. | 7.69 | 13.3 | 141. | 0.0146 | 1.33 | 0.427 | 0.649 | 0.538 | ||
| 330 | [-] | 161. | 7.63 | 13.3 | 152. | 0.0146 | 0.975 | 0.438 | 0.646 | 0.542 | ||
| CMIP6_001 | [-] | 100. | 20.1 | 12.1 | 81.3 | 1.24 | 27.1 | 0.391 | 0.00924 | 0.200 |
Download Data |
Period Mean (original grids) [Pg] |
Model Period Mean (intersection) [Pg] |
Benchmark Period Mean (intersection) [Pg] |
Model Period Mean (complement) [Pg] |
Benchmark Period Mean (complement) [Pg] |
Bias [kg m-2] |
Bias Score [1] |
Spatial Distribution Score [1] |
Overall Score [1] |
|||
|---|---|---|---|---|---|---|---|---|---|---|---|---|
| Benchmark | [-] | 42.5 | ||||||||||
| 271 | [-] | 30.8 | 27.8 | 42.1 | 2.07 | 0.391 | 0.0342 | 0.543 | 0.850 | 0.697 | ||
| 330 | [-] | 28.9 | 26.1 | 42.1 | 1.86 | 0.391 | -0.863 | 0.573 | 0.850 | 0.712 | ||
| CMIP6_001 | [-] | 19.4 | 18.2 | 40.2 | 0.794 | 2.26 | -4.99 | 0.630 | 0.745 | 0.688 |
Download Data |
Period Mean (original grids) [Pg] |
Model Period Mean (intersection) [Pg] |
Benchmark Period Mean (intersection) [Pg] |
Model Period Mean (complement) [Pg] |
Benchmark Period Mean (complement) [Pg] |
Bias [kg m-2] |
Bias Score [1] |
Spatial Distribution Score [1] |
Overall Score [1] |
|||
|---|---|---|---|---|---|---|---|---|---|---|---|---|
| Benchmark | [-] | 45.3 | ||||||||||
| 271 | [-] | 50.8 | 49.2 | 45.3 | 0.728 | 0.00775 | 1.55 | 0.657 | 0.810 | 0.733 | ||
| 330 | [-] | 42.0 | 40.6 | 45.3 | 0.610 | 0.00775 | -0.578 | 0.744 | 0.621 | 0.682 | ||
| CMIP6_001 | [-] | 22.0 | 21.3 | 44.4 | 0.252 | 0.888 | -5.24 | 0.656 | 0.456 | 0.556 |
Download Data |
Period Mean (original grids) [Pg] |
Model Period Mean (intersection) [Pg] |
Benchmark Period Mean (intersection) [Pg] |
Model Period Mean (complement) [Pg] |
Benchmark Period Mean (complement) [Pg] |
Bias [kg m-2] |
Bias Score [1] |
Spatial Distribution Score [1] |
Overall Score [1] |
|||
|---|---|---|---|---|---|---|---|---|---|---|---|---|
| Benchmark | [-] | 51.3 | ||||||||||
| 271 | [-] | 68.9 | 38.3 | 51.3 | 32.8 | -3.03 | 0.668 | 0.848 | 0.758 | |||
| 330 | [-] | 75.6 | 36.2 | 51.3 | 41.4 | -3.66 | 0.687 | 0.787 | 0.737 | |||
| CMIP6_001 | [-] | 58.5 | 28.3 | 49.6 | 29.9 | 1.76 | -5.95 | 0.589 | 0.873 | 0.731 |
Download Data |
Period Mean (original grids) [Pg] |
Model Period Mean (intersection) [Pg] |
Benchmark Period Mean (intersection) [Pg] |
Model Period Mean (complement) [Pg] |
Benchmark Period Mean (complement) [Pg] |
Bias [kg m-2] |
Bias Score [1] |
Spatial Distribution Score [1] |
Overall Score [1] |
|||
|---|---|---|---|---|---|---|---|---|---|---|---|---|
| Benchmark | [-] | 34.3 | ||||||||||
| 271 | [-] | 23.0 | 23.1 | 34.2 | 0.888 | 0.00992 | -2.16 | 0.611 | 0.586 | 0.598 | ||
| 330 | [-] | 21.1 | 21.1 | 34.2 | 0.771 | 0.00992 | -2.76 | 0.600 | 0.674 | 0.637 | ||
| CMIP6_001 | [-] | 7.77 | 8.05 | 34.0 | 0.190 | 0.216 | -6.38 | 0.489 | 0.728 | 0.608 |
Download Data |
Period Mean (original grids) [Pg] |
Model Period Mean (intersection) [Pg] |
Benchmark Period Mean (intersection) [Pg] |
Model Period Mean (complement) [Pg] |
Benchmark Period Mean (complement) [Pg] |
Bias [kg m-2] |
Bias Score [1] |
Spatial Distribution Score [1] |
Overall Score [1] |
|||
|---|---|---|---|---|---|---|---|---|---|---|---|---|
| Benchmark | [-] | 101. | ||||||||||
| 271 | [-] | 112. | 111. | 101. | 0.913 | 0.0749 | 1.84 | 0.668 | 0.621 | 0.645 | ||
| 330 | [-] | 113. | 111. | 101. | 0.839 | 0.0749 | 1.89 | 0.662 | 0.502 | 0.582 | ||
| CMIP6_001 | [-] | 80.8 | 80.1 | 100. | 0.434 | 0.811 | -1.76 | 0.726 | 0.541 | 0.633 |
Download Data |
Period Mean (original grids) [Pg] |
Model Period Mean (intersection) [Pg] |
Benchmark Period Mean (intersection) [Pg] |
Model Period Mean (complement) [Pg] |
Benchmark Period Mean (complement) [Pg] |
Bias [kg m-2] |
Bias Score [1] |
Spatial Distribution Score [1] |
Overall Score [1] |
|||
|---|---|---|---|---|---|---|---|---|---|---|---|---|
| Benchmark | [-] | 60.7 | ||||||||||
| 271 | [-] | 75.3 | 75.7 | 60.7 | 0.799 | 0.0488 | 2.75 | 0.590 | 0.866 | 0.728 | ||
| 330 | [-] | 73.2 | 73.8 | 60.7 | 0.728 | 0.0488 | 2.43 | 0.591 | 0.866 | 0.729 | ||
| CMIP6_001 | [-] | 39.8 | 40.0 | 60.4 | 0.570 | 0.300 | -2.50 | 0.645 | 0.860 | 0.752 |
Download Data |
Period Mean (original grids) [Pg] |
Model Period Mean (intersection) [Pg] |
Benchmark Period Mean (intersection) [Pg] |
Model Period Mean (complement) [Pg] |
Benchmark Period Mean (complement) [Pg] |
Bias [kg m-2] |
Bias Score [1] |
Spatial Distribution Score [1] |
Overall Score [1] |
|||
|---|---|---|---|---|---|---|---|---|---|---|---|---|
| Benchmark | [-] | 29.6 | ||||||||||
| 271 | [-] | 29.3 | 27.6 | 29.6 | 0.736 | 0.0296 | 0.861 | 0.493 | 0.801 | 0.647 | ||
| 330 | [-] | 28.4 | 26.8 | 29.6 | 0.649 | 0.0296 | 0.412 | 0.498 | 0.667 | 0.583 | ||
| CMIP6_001 | [-] | 17.4 | 16.5 | 28.2 | 0.279 | 1.46 | -2.83 | 0.591 | 0.435 | 0.513 |
Temporally integrated period mean