Mean State
Download Data |
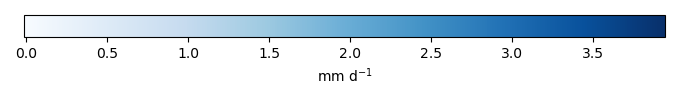
Period Mean (original grids) [mm d-1] |
Model Period Mean (intersection) [mm d-1] |
Benchmark Period Mean (intersection) [mm d-1] |
Model Period Mean (complement) [mm d-1] |
Benchmark Period Mean (complement) [mm d-1] |
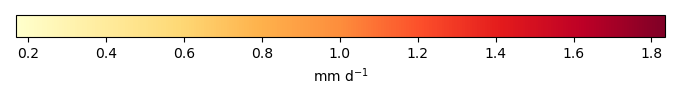
Bias [mm d-1] |
RMSE [mm d-1] |
Phase Shift [months] |
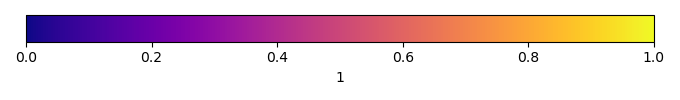
Bias Score [1] |
RMSE Score [1] |
Seasonal Cycle Score [1] |
Spatial Distribution Score [1] |
Overall Score [1] |
|||
|---|---|---|---|---|---|---|---|---|---|---|---|---|---|---|---|---|
| Benchmark | [-] | 2.49 | ||||||||||||||
| 271 | [-] | 2.57 | 2.60 | 2.49 | 2.09 | 0.0995 | 0.784 | 3.10 | 0.515 | 0.593 | 0.478 | 0.921 | 0.620 | |||
| 330 | [-] | 2.45 | 2.48 | 2.49 | 1.99 | -0.0170 | 0.799 | 2.96 | 0.497 | 0.592 | 0.504 | 0.879 | 0.613 | |||
| CMIP6_001 | [-] | 2.58 | 2.61 | 2.49 | 1.91 | 2.68 | 0.123 | 0.683 | 2.68 | 0.599 | 0.621 | 0.569 | 0.973 | 0.677 |
Download Data |
Period Mean (original grids) [mm d-1] |
Model Period Mean (intersection) [mm d-1] |
Benchmark Period Mean (intersection) [mm d-1] |
Model Period Mean (complement) [mm d-1] |
Benchmark Period Mean (complement) [mm d-1] |
Bias [mm d-1] |
RMSE [mm d-1] |
Phase Shift [months] |
Bias Score [1] |
RMSE Score [1] |
Seasonal Cycle Score [1] |
Spatial Distribution Score [1] |
Overall Score [1] |
|||
|---|---|---|---|---|---|---|---|---|---|---|---|---|---|---|---|---|
| Benchmark | [-] | 1.21 | ||||||||||||||
| 271 | [-] | 2.02 | 2.03 | 1.21 | 0.997 | 0.826 | 1.31 | 1.31 | 0.181 | 0.382 | 0.830 | 0.751 | 0.505 | |||
| 330 | [-] | 2.00 | 2.02 | 1.21 | 0.913 | 0.813 | 1.31 | 1.42 | 0.184 | 0.373 | 0.809 | 0.781 | 0.504 | |||
| CMIP6_001 | [-] | 1.73 | 1.75 | 1.20 | 0.547 | 2.59 | 0.542 | 1.01 | 1.21 | 0.323 | 0.475 | 0.836 | 0.916 | 0.605 |
Download Data |
Period Mean (original grids) [mm d-1] |
Model Period Mean (intersection) [mm d-1] |
Benchmark Period Mean (intersection) [mm d-1] |
Model Period Mean (complement) [mm d-1] |
Benchmark Period Mean (complement) [mm d-1] |
Bias [mm d-1] |
RMSE [mm d-1] |
Phase Shift [months] |
Bias Score [1] |
RMSE Score [1] |
Seasonal Cycle Score [1] |
Spatial Distribution Score [1] |
Overall Score [1] |
|||
|---|---|---|---|---|---|---|---|---|---|---|---|---|---|---|---|---|
| Benchmark | [-] | 1.67 | ||||||||||||||
| 271 | [-] | 1.86 | 1.86 | 1.67 | 1.82 | 2.90 | 0.189 | 0.869 | 1.38 | 0.461 | 0.537 | 0.813 | 0.822 | 0.634 | ||
| 330 | [-] | 1.87 | 1.87 | 1.67 | 1.81 | 2.90 | 0.201 | 0.863 | 1.45 | 0.463 | 0.518 | 0.806 | 0.863 | 0.634 | ||
| CMIP6_001 | [-] | 2.05 | 2.05 | 1.67 | 1.99 | 2.05 | 0.388 | 0.937 | 1.42 | 0.401 | 0.506 | 0.821 | 0.934 | 0.634 |
Download Data |
Period Mean (original grids) [mm d-1] |
Model Period Mean (intersection) [mm d-1] |
Benchmark Period Mean (intersection) [mm d-1] |
Model Period Mean (complement) [mm d-1] |
Benchmark Period Mean (complement) [mm d-1] |
Bias [mm d-1] |
RMSE [mm d-1] |
Phase Shift [months] |
Bias Score [1] |
RMSE Score [1] |
Seasonal Cycle Score [1] |
Spatial Distribution Score [1] |
Overall Score [1] |
|||
|---|---|---|---|---|---|---|---|---|---|---|---|---|---|---|---|---|
| Benchmark | [-] | 0.851 | ||||||||||||||
| 271 | [-] | 0.495 | 0.498 | 0.851 | 0.466 | -0.351 | 0.481 | 0.380 | 0.0897 | 0.344 | 0.974 | 0.977 | 0.546 | |||
| 330 | [-] | 0.488 | 0.491 | 0.851 | 0.461 | -0.358 | 0.483 | 0.256 | 0.0718 | 0.351 | 0.982 | 0.980 | 0.547 | |||
| CMIP6_001 | [-] | 0.513 | 0.522 | 0.851 | 0.390 | 1.06 | -0.333 | 0.488 | 0.319 | 0.187 | 0.328 | 0.978 | 0.955 | 0.556 |
Download Data |
Period Mean (original grids) [mm d-1] |
Model Period Mean (intersection) [mm d-1] |
Benchmark Period Mean (intersection) [mm d-1] |
Model Period Mean (complement) [mm d-1] |
Benchmark Period Mean (complement) [mm d-1] |
Bias [mm d-1] |
RMSE [mm d-1] |
Phase Shift [months] |
Bias Score [1] |
RMSE Score [1] |
Seasonal Cycle Score [1] |
Spatial Distribution Score [1] |
Overall Score [1] |
|||
|---|---|---|---|---|---|---|---|---|---|---|---|---|---|---|---|---|
| Benchmark | [-] | 3.76 | ||||||||||||||
| 271 | [-] | 3.34 | 3.27 | 3.76 | 3.57 | 3.88 | -0.421 | 0.588 | 2.98 | 0.454 | 0.727 | 0.505 | 0.897 | 0.662 | ||
| 330 | [-] | 3.07 | 3.01 | 3.76 | 3.31 | 3.88 | -0.685 | 0.770 | 2.89 | 0.237 | 0.744 | 0.514 | 0.971 | 0.642 | ||
| CMIP6_001 | [-] | 3.30 | 3.26 | 3.75 | 3.50 | 3.91 | -0.432 | 0.574 | 2.68 | 0.443 | 0.736 | 0.555 | 0.987 | 0.691 |
Download Data |
Period Mean (original grids) [mm d-1] |
Model Period Mean (intersection) [mm d-1] |
Benchmark Period Mean (intersection) [mm d-1] |
Model Period Mean (complement) [mm d-1] |
Benchmark Period Mean (complement) [mm d-1] |
Bias [mm d-1] |
RMSE [mm d-1] |
Phase Shift [months] |
Bias Score [1] |
RMSE Score [1] |
Seasonal Cycle Score [1] |
Spatial Distribution Score [1] |
Overall Score [1] |
|||
|---|---|---|---|---|---|---|---|---|---|---|---|---|---|---|---|---|
| Benchmark | [-] | 1.12 | ||||||||||||||
| 271 | [-] | 1.00 | 0.996 | 1.12 | 1.12 | 1.43 | -0.119 | 0.365 | 0.101 | 0.475 | 0.456 | 0.993 | 0.796 | 0.635 | ||
| 330 | [-] | 1.06 | 1.06 | 1.12 | 1.18 | 1.43 | -0.0531 | 0.343 | 0.121 | 0.624 | 0.452 | 0.992 | 0.919 | 0.688 | ||
| CMIP6_001 | [-] | 1.00 | 1.00 | 1.12 | 1.07 | 1.40 | -0.114 | 0.329 | 0.229 | 0.515 | 0.511 | 0.984 | 0.929 | 0.690 |
Download Data |
Period Mean (original grids) [mm d-1] |
Model Period Mean (intersection) [mm d-1] |
Benchmark Period Mean (intersection) [mm d-1] |
Model Period Mean (complement) [mm d-1] |
Benchmark Period Mean (complement) [mm d-1] |
Bias [mm d-1] |
RMSE [mm d-1] |
Phase Shift [months] |
Bias Score [1] |
RMSE Score [1] |
Seasonal Cycle Score [1] |
Spatial Distribution Score [1] |
Overall Score [1] |
|||
|---|---|---|---|---|---|---|---|---|---|---|---|---|---|---|---|---|
| Benchmark | [-] | 1.17 | ||||||||||||||
| 271 | [-] | 1.20 | 1.27 | 1.17 | 0.888 | 0.120 | 0.695 | 1.31 | 0.511 | 0.337 | 0.801 | 0.923 | 0.582 | |||
| 330 | [-] | 1.18 | 1.25 | 1.17 | 0.873 | 0.0935 | 0.692 | 1.30 | 0.512 | 0.340 | 0.803 | 0.902 | 0.580 | |||
| CMIP6_001 | [-] | 1.17 | 1.23 | 1.17 | 0.875 | 1.94 | 0.0766 | 0.713 | 1.37 | 0.510 | 0.340 | 0.804 | 0.948 | 0.588 |
Download Data |
Period Mean (original grids) [mm d-1] |
Model Period Mean (intersection) [mm d-1] |
Benchmark Period Mean (intersection) [mm d-1] |
Model Period Mean (complement) [mm d-1] |
Benchmark Period Mean (complement) [mm d-1] |
Bias [mm d-1] |
RMSE [mm d-1] |
Phase Shift [months] |
Bias Score [1] |
RMSE Score [1] |
Seasonal Cycle Score [1] |
Spatial Distribution Score [1] |
Overall Score [1] |
|||
|---|---|---|---|---|---|---|---|---|---|---|---|---|---|---|---|---|
| Benchmark | [-] | 2.11 | ||||||||||||||
| 271 | [-] | 1.96 | 2.01 | 2.11 | 1.64 | 4.04 | -0.0279 | 0.833 | 1.76 | 0.482 | 0.517 | 0.751 | 0.857 | 0.625 | ||
| 330 | [-] | 1.91 | 1.96 | 2.11 | 1.60 | 4.04 | -0.0905 | 0.840 | 1.59 | 0.476 | 0.528 | 0.774 | 0.796 | 0.620 | ||
| CMIP6_001 | [-] | 1.98 | 2.03 | 2.11 | 1.58 | 3.39 | -0.00620 | 0.946 | 2.10 | 0.500 | 0.399 | 0.688 | 0.888 | 0.575 |
Download Data |
Period Mean (original grids) [mm d-1] |
Model Period Mean (intersection) [mm d-1] |
Benchmark Period Mean (intersection) [mm d-1] |
Model Period Mean (complement) [mm d-1] |
Benchmark Period Mean (complement) [mm d-1] |
Bias [mm d-1] |
RMSE [mm d-1] |
Phase Shift [months] |
Bias Score [1] |
RMSE Score [1] |
Seasonal Cycle Score [1] |
Spatial Distribution Score [1] |
Overall Score [1] |
|||
|---|---|---|---|---|---|---|---|---|---|---|---|---|---|---|---|---|
| Benchmark | [-] | 0.785 | ||||||||||||||
| 271 | [-] | 0.490 | 0.517 | 0.785 | 0.280 | -0.272 | 0.453 | 0.372 | 0.146 | 0.281 | 0.973 | 0.964 | 0.529 | |||
| 330 | [-] | 0.494 | 0.523 | 0.785 | 0.285 | -0.264 | 0.432 | 0.363 | 0.157 | 0.323 | 0.974 | 0.934 | 0.542 | |||
| CMIP6_001 | [-] | 0.433 | 0.463 | 0.785 | 0.219 | 0.741 | -0.324 | 0.497 | 0.410 | 0.120 | 0.262 | 0.967 | 0.921 | 0.506 |
Download Data |
Period Mean (original grids) [mm d-1] |
Model Period Mean (intersection) [mm d-1] |
Benchmark Period Mean (intersection) [mm d-1] |
Model Period Mean (complement) [mm d-1] |
Benchmark Period Mean (complement) [mm d-1] |
Bias [mm d-1] |
RMSE [mm d-1] |
Phase Shift [months] |
Bias Score [1] |
RMSE Score [1] |
Seasonal Cycle Score [1] |
Spatial Distribution Score [1] |
Overall Score [1] |
|||
|---|---|---|---|---|---|---|---|---|---|---|---|---|---|---|---|---|
| Benchmark | [-] | 0.787 | ||||||||||||||
| 271 | [-] | 1.47 | 1.45 | 0.786 | 1.72 | 1.79 | 0.690 | 0.944 | 2.17 | 0.195 | 0.564 | 0.661 | 0.806 | 0.558 | ||
| 330 | [-] | 1.44 | 1.43 | 0.786 | 1.65 | 1.79 | 0.664 | 0.944 | 2.17 | 0.207 | 0.548 | 0.668 | 0.787 | 0.551 | ||
| CMIP6_001 | [-] | 1.25 | 1.22 | 0.779 | 1.79 | 2.20 | 0.475 | 0.722 | 2.29 | 0.366 | 0.608 | 0.655 | 0.877 | 0.623 |
Download Data |
Period Mean (original grids) [mm d-1] |
Model Period Mean (intersection) [mm d-1] |
Benchmark Period Mean (intersection) [mm d-1] |
Model Period Mean (complement) [mm d-1] |
Benchmark Period Mean (complement) [mm d-1] |
Bias [mm d-1] |
RMSE [mm d-1] |
Phase Shift [months] |
Bias Score [1] |
RMSE Score [1] |
Seasonal Cycle Score [1] |
Spatial Distribution Score [1] |
Overall Score [1] |
|||
|---|---|---|---|---|---|---|---|---|---|---|---|---|---|---|---|---|
| Benchmark | [-] | 1.32 | ||||||||||||||
| 271 | [-] | 1.27 | 1.27 | 1.32 | 1.30 | 1.25 | -0.0432 | 0.414 | 0.319 | 0.565 | 0.599 | 0.977 | 0.978 | 0.743 | ||
| 330 | [-] | 1.31 | 1.31 | 1.32 | 1.34 | 1.25 | -0.00437 | 0.416 | 0.379 | 0.592 | 0.593 | 0.973 | 0.989 | 0.748 | ||
| CMIP6_001 | [-] | 1.23 | 1.24 | 1.31 | 1.18 | 1.43 | -0.0758 | 0.445 | 0.425 | 0.600 | 0.556 | 0.971 | 0.988 | 0.734 |
Download Data |
Period Mean (original grids) [mm d-1] |
Model Period Mean (intersection) [mm d-1] |
Benchmark Period Mean (intersection) [mm d-1] |
Model Period Mean (complement) [mm d-1] |
Benchmark Period Mean (complement) [mm d-1] |
Bias [mm d-1] |
RMSE [mm d-1] |
Phase Shift [months] |
Bias Score [1] |
RMSE Score [1] |
Seasonal Cycle Score [1] |
Spatial Distribution Score [1] |
Overall Score [1] |
|||
|---|---|---|---|---|---|---|---|---|---|---|---|---|---|---|---|---|
| Benchmark | [-] | 1.56 | ||||||||||||||
| 271 | [-] | 1.32 | 1.63 | 1.56 | 0.453 | 2.85 | 0.0923 | 0.714 | 1.35 | 0.410 | 0.475 | 0.807 | 0.950 | 0.624 | ||
| 330 | [-] | 1.31 | 1.63 | 1.56 | 0.443 | 2.85 | 0.0818 | 0.724 | 1.35 | 0.407 | 0.474 | 0.808 | 0.932 | 0.619 | ||
| CMIP6_001 | [-] | 1.28 | 1.60 | 1.56 | 0.392 | 2.43 | 0.0621 | 0.685 | 1.41 | 0.451 | 0.470 | 0.800 | 0.969 | 0.632 |
Download Data |
Period Mean (original grids) [mm d-1] |
Model Period Mean (intersection) [mm d-1] |
Benchmark Period Mean (intersection) [mm d-1] |
Model Period Mean (complement) [mm d-1] |
Benchmark Period Mean (complement) [mm d-1] |
Bias [mm d-1] |
RMSE [mm d-1] |
Phase Shift [months] |
Bias Score [1] |
RMSE Score [1] |
Seasonal Cycle Score [1] |
Spatial Distribution Score [1] |
Overall Score [1] |
|||
|---|---|---|---|---|---|---|---|---|---|---|---|---|---|---|---|---|
| Benchmark | [-] | 0.603 | ||||||||||||||
| 271 | [-] | 0.434 | 0.937 | 0.603 | 0.315 | 0.339 | 0.764 | 2.31 | 0.447 | 0.374 | 0.632 | 0.949 | 0.555 | |||
| 330 | [-] | 0.429 | 0.969 | 0.603 | 0.300 | 0.371 | 0.799 | 2.32 | 0.414 | 0.356 | 0.635 | 0.954 | 0.543 | |||
| CMIP6_001 | [-] | 0.356 | 0.846 | 0.603 | 0.238 | 0.429 | 0.240 | 0.795 | 2.36 | 0.514 | 0.324 | 0.625 | 0.945 | 0.546 |
Download Data |
Period Mean (original grids) [mm d-1] |
Model Period Mean (intersection) [mm d-1] |
Benchmark Period Mean (intersection) [mm d-1] |
Model Period Mean (complement) [mm d-1] |
Benchmark Period Mean (complement) [mm d-1] |
Bias [mm d-1] |
RMSE [mm d-1] |
Phase Shift [months] |
Bias Score [1] |
RMSE Score [1] |
Seasonal Cycle Score [1] |
Spatial Distribution Score [1] |
Overall Score [1] |
|||
|---|---|---|---|---|---|---|---|---|---|---|---|---|---|---|---|---|
| Benchmark | [-] | 0.876 | ||||||||||||||
| 271 | [-] | 0.585 | 0.688 | 0.876 | 0.299 | -0.195 | 0.448 | 0.602 | 0.289 | 0.319 | 0.956 | 0.874 | 0.551 | |||
| 330 | [-] | 0.607 | 0.718 | 0.876 | 0.303 | -0.165 | 0.420 | 0.611 | 0.357 | 0.340 | 0.952 | 0.854 | 0.569 | |||
| CMIP6_001 | [-] | 0.526 | 0.632 | 0.875 | 0.260 | 1.04 | -0.247 | 0.448 | 0.758 | 0.256 | 0.345 | 0.938 | 0.953 | 0.567 |
Download Data |
Period Mean (original grids) [mm d-1] |
Model Period Mean (intersection) [mm d-1] |
Benchmark Period Mean (intersection) [mm d-1] |
Model Period Mean (complement) [mm d-1] |
Benchmark Period Mean (complement) [mm d-1] |
Bias [mm d-1] |
RMSE [mm d-1] |
Phase Shift [months] |
Bias Score [1] |
RMSE Score [1] |
Seasonal Cycle Score [1] |
Spatial Distribution Score [1] |
Overall Score [1] |
|||
|---|---|---|---|---|---|---|---|---|---|---|---|---|---|---|---|---|
| Benchmark | [-] | 2.12 | ||||||||||||||
| 271 | [-] | 2.32 | 2.30 | 2.12 | 2.43 | 3.97 | 0.237 | 0.862 | 1.89 | 0.411 | 0.552 | 0.725 | 0.795 | 0.607 | ||
| 330 | [-] | 2.25 | 2.24 | 2.12 | 2.34 | 3.97 | 0.171 | 0.892 | 1.88 | 0.375 | 0.547 | 0.723 | 0.741 | 0.587 | ||
| CMIP6_001 | [-] | 2.10 | 2.13 | 2.12 | 1.97 | 2.78 | 0.0623 | 0.904 | 2.38 | 0.405 | 0.544 | 0.626 | 0.861 | 0.596 |
Download Data |
Period Mean (original grids) [mm d-1] |
Model Period Mean (intersection) [mm d-1] |
Benchmark Period Mean (intersection) [mm d-1] |
Model Period Mean (complement) [mm d-1] |
Benchmark Period Mean (complement) [mm d-1] |
Bias [mm d-1] |
RMSE [mm d-1] |
Phase Shift [months] |
Bias Score [1] |
RMSE Score [1] |
Seasonal Cycle Score [1] |
Spatial Distribution Score [1] |
Overall Score [1] |
|||
|---|---|---|---|---|---|---|---|---|---|---|---|---|---|---|---|---|
| Benchmark | [-] | 1.88 | ||||||||||||||
| 271 | [-] | 1.96 | 1.95 | 1.88 | 2.17 | 0.0873 | 0.456 | 0.566 | 0.647 | 0.514 | 0.956 | 0.962 | 0.718 | |||
| 330 | [-] | 1.92 | 1.91 | 1.88 | 2.13 | 0.0488 | 0.461 | 0.683 | 0.682 | 0.502 | 0.949 | 0.968 | 0.721 | |||
| CMIP6_001 | [-] | 1.79 | 1.77 | 1.88 | 2.12 | 2.11 | -0.0807 | 0.504 | 0.669 | 0.619 | 0.482 | 0.945 | 0.995 | 0.705 |
Download Data |
Period Mean (original grids) [mm d-1] |
Model Period Mean (intersection) [mm d-1] |
Benchmark Period Mean (intersection) [mm d-1] |
Model Period Mean (complement) [mm d-1] |
Benchmark Period Mean (complement) [mm d-1] |
Bias [mm d-1] |
RMSE [mm d-1] |
Phase Shift [months] |
Bias Score [1] |
RMSE Score [1] |
Seasonal Cycle Score [1] |
Spatial Distribution Score [1] |
Overall Score [1] |
|||
|---|---|---|---|---|---|---|---|---|---|---|---|---|---|---|---|---|
| Benchmark | [-] | 1.14 | ||||||||||||||
| 271 | [-] | 1.18 | 1.17 | 1.14 | 1.49 | 0.0409 | 0.414 | 0.187 | 0.556 | 0.441 | 0.986 | 0.905 | 0.666 | |||
| 330 | [-] | 1.29 | 1.28 | 1.14 | 1.53 | 0.149 | 0.440 | 0.294 | 0.459 | 0.423 | 0.979 | 0.986 | 0.654 | |||
| CMIP6_001 | [-] | 1.13 | 1.12 | 1.14 | 1.34 | 1.29 | -0.00793 | 0.446 | 0.294 | 0.536 | 0.402 | 0.979 | 0.990 | 0.662 |
Download Data |
Period Mean (original grids) [mm d-1] |
Model Period Mean (intersection) [mm d-1] |
Benchmark Period Mean (intersection) [mm d-1] |
Model Period Mean (complement) [mm d-1] |
Benchmark Period Mean (complement) [mm d-1] |
Bias [mm d-1] |
RMSE [mm d-1] |
Phase Shift [months] |
Bias Score [1] |
RMSE Score [1] |
Seasonal Cycle Score [1] |
Spatial Distribution Score [1] |
Overall Score [1] |
|||
|---|---|---|---|---|---|---|---|---|---|---|---|---|---|---|---|---|
| Benchmark | [-] | 0.787 | ||||||||||||||
| 271 | [-] | 1.16 | 1.17 | 0.787 | 1.16 | 0.388 | 0.827 | 2.04 | 0.400 | 0.284 | 0.682 | 0.927 | 0.515 | |||
| 330 | [-] | 1.18 | 1.19 | 0.787 | 1.21 | 0.408 | 0.842 | 2.00 | 0.378 | 0.272 | 0.681 | 0.907 | 0.502 | |||
| CMIP6_001 | [-] | 1.00 | 1.01 | 0.786 | 0.983 | 1.92 | 0.234 | 0.726 | 1.97 | 0.484 | 0.347 | 0.692 | 0.792 | 0.532 |
Download Data |
Period Mean (original grids) [mm d-1] |
Model Period Mean (intersection) [mm d-1] |
Benchmark Period Mean (intersection) [mm d-1] |
Model Period Mean (complement) [mm d-1] |
Benchmark Period Mean (complement) [mm d-1] |
Bias [mm d-1] |
RMSE [mm d-1] |
Phase Shift [months] |
Bias Score [1] |
RMSE Score [1] |
Seasonal Cycle Score [1] |
Spatial Distribution Score [1] |
Overall Score [1] |
|||
|---|---|---|---|---|---|---|---|---|---|---|---|---|---|---|---|---|
| Benchmark | [-] | 3.61 | ||||||||||||||
| 271 | [-] | 3.08 | 3.09 | 3.61 | 2.84 | -0.535 | 0.752 | 2.03 | 0.438 | 0.666 | 0.703 | 0.993 | 0.693 | |||
| 330 | [-] | 2.96 | 2.97 | 3.61 | 2.71 | -0.654 | 0.820 | 1.92 | 0.327 | 0.685 | 0.728 | 0.953 | 0.676 | |||
| CMIP6_001 | [-] | 3.28 | 3.29 | 3.61 | 2.91 | 3.16 | -0.335 | 0.675 | 2.19 | 0.559 | 0.614 | 0.671 | 0.991 | 0.690 |
Download Data |
Period Mean (original grids) [mm d-1] |
Model Period Mean (intersection) [mm d-1] |
Benchmark Period Mean (intersection) [mm d-1] |
Model Period Mean (complement) [mm d-1] |
Benchmark Period Mean (complement) [mm d-1] |
Bias [mm d-1] |
RMSE [mm d-1] |
Phase Shift [months] |
Bias Score [1] |
RMSE Score [1] |
Seasonal Cycle Score [1] |
Spatial Distribution Score [1] |
Overall Score [1] |
|||
|---|---|---|---|---|---|---|---|---|---|---|---|---|---|---|---|---|
| Benchmark | [-] | 1.96 | ||||||||||||||
| 271 | [-] | 2.09 | 2.09 | 1.96 | 2.14 | 1.87 | 0.130 | 0.852 | 1.17 | 0.360 | 0.583 | 0.865 | 0.809 | 0.640 | ||
| 330 | [-] | 2.20 | 2.20 | 1.96 | 2.27 | 1.87 | 0.234 | 0.836 | 1.29 | 0.376 | 0.575 | 0.846 | 0.708 | 0.616 | ||
| CMIP6_001 | [-] | 2.11 | 2.11 | 1.96 | 2.29 | 2.09 | 0.156 | 0.830 | 1.42 | 0.411 | 0.545 | 0.820 | 0.757 | 0.616 |
Download Data |
Period Mean (original grids) [mm d-1] |
Model Period Mean (intersection) [mm d-1] |
Benchmark Period Mean (intersection) [mm d-1] |
Model Period Mean (complement) [mm d-1] |
Benchmark Period Mean (complement) [mm d-1] |
Bias [mm d-1] |
RMSE [mm d-1] |
Phase Shift [months] |
Bias Score [1] |
RMSE Score [1] |
Seasonal Cycle Score [1] |
Spatial Distribution Score [1] |
Overall Score [1] |
|||
|---|---|---|---|---|---|---|---|---|---|---|---|---|---|---|---|---|
| Benchmark | [-] | 1.17 | ||||||||||||||
| 271 | [-] | 1.42 | 1.51 | 1.17 | 1.00 | 0.333 | 0.780 | 2.07 | 0.293 | 0.442 | 0.691 | 0.846 | 0.543 | |||
| 330 | [-] | 1.41 | 1.51 | 1.17 | 0.991 | 0.328 | 0.805 | 2.04 | 0.267 | 0.430 | 0.695 | 0.805 | 0.526 | |||
| CMIP6_001 | [-] | 1.29 | 1.42 | 1.17 | 0.718 | 1.34 | 0.234 | 0.743 | 1.84 | 0.337 | 0.432 | 0.718 | 0.906 | 0.565 |
Temporally integrated period mean