Mean State
Download Data |
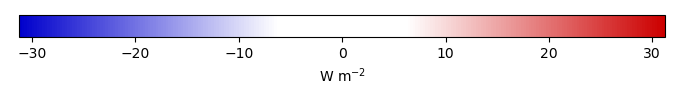
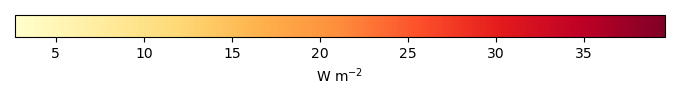
Period Mean (original grids) [W m-2] |
Model Period Mean (intersection) [W m-2] |
Benchmark Period Mean (intersection) [W m-2] |
Model Period Mean (complement) [W m-2] |
Benchmark Period Mean (complement) [W m-2] |
Bias [W m-2] |
RMSE [W m-2] |
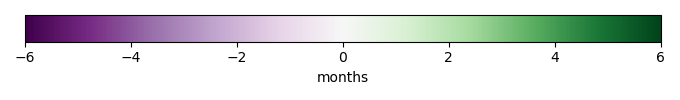
Phase Shift [months] |
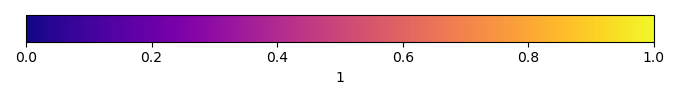
Bias Score [1] |
RMSE Score [1] |
Seasonal Cycle Score [1] |
Spatial Distribution Score [1] |
Overall Score [1] |
|||
|---|---|---|---|---|---|---|---|---|---|---|---|---|---|---|---|---|
| Benchmark | [-] | 67.7 | ||||||||||||||
| 271 | [-] | 74.7 | 75.1 | 67.7 | 72.5 | 7.02 | 14.8 | 1.95 | 0.566 | 0.679 | 0.693 | 0.953 | 0.714 | |||
| 330 | [-] | 69.9 | 70.6 | 67.7 | 67.8 | 2.54 | 13.3 | 1.93 | 0.636 | 0.673 | 0.693 | 0.956 | 0.726 | |||
| CMIP6_001 | [-] | 75.2 | 75.7 | 67.7 | 74.9 | 35.0 | 7.79 | 15.0 | 2.66 | 0.576 | 0.636 | 0.569 | 0.990 | 0.681 |
Download Data |
Period Mean (original grids) [W m-2] |
Model Period Mean (intersection) [W m-2] |
Benchmark Period Mean (intersection) [W m-2] |
Model Period Mean (complement) [W m-2] |
Benchmark Period Mean (complement) [W m-2] |
Bias [W m-2] |
RMSE [W m-2] |
Phase Shift [months] |
Bias Score [1] |
RMSE Score [1] |
Seasonal Cycle Score [1] |
Spatial Distribution Score [1] |
Overall Score [1] |
|||
|---|---|---|---|---|---|---|---|---|---|---|---|---|---|---|---|---|
| Benchmark | [-] | 48.1 | ||||||||||||||
| 271 | [-] | 58.0 | 57.5 | 48.1 | 57.5 | 9.52 | 21.5 | 1.34 | 0.431 | 0.427 | 0.826 | 0.925 | 0.607 | |||
| 330 | [-] | 57.4 | 57.0 | 48.1 | 56.0 | 8.99 | 21.5 | 1.30 | 0.438 | 0.424 | 0.832 | 0.942 | 0.612 | |||
| CMIP6_001 | [-] | 50.5 | 49.8 | 48.1 | 52.1 | 69.8 | 1.84 | 16.0 | 1.18 | 0.656 | 0.522 | 0.841 | 0.991 | 0.706 |
Download Data |
Period Mean (original grids) [W m-2] |
Model Period Mean (intersection) [W m-2] |
Benchmark Period Mean (intersection) [W m-2] |
Model Period Mean (complement) [W m-2] |
Benchmark Period Mean (complement) [W m-2] |
Bias [W m-2] |
RMSE [W m-2] |
Phase Shift [months] |
Bias Score [1] |
RMSE Score [1] |
Seasonal Cycle Score [1] |
Spatial Distribution Score [1] |
Overall Score [1] |
|||
|---|---|---|---|---|---|---|---|---|---|---|---|---|---|---|---|---|
| Benchmark | [-] | 48.5 | ||||||||||||||
| 271 | [-] | 53.6 | 52.7 | 48.5 | 61.8 | 4.04 | 17.0 | 1.03 | 0.500 | 0.631 | 0.882 | 0.956 | 0.720 | |||
| 330 | [-] | 53.8 | 52.9 | 48.5 | 61.2 | 4.22 | 16.3 | 0.951 | 0.531 | 0.616 | 0.889 | 0.976 | 0.726 | |||
| CMIP6_001 | [-] | 59.4 | 58.5 | 48.5 | 67.4 | 57.4 | 9.86 | 19.6 | 1.09 | 0.438 | 0.579 | 0.859 | 0.982 | 0.687 |
Download Data |
Period Mean (original grids) [W m-2] |
Model Period Mean (intersection) [W m-2] |
Benchmark Period Mean (intersection) [W m-2] |
Model Period Mean (complement) [W m-2] |
Benchmark Period Mean (complement) [W m-2] |
Bias [W m-2] |
RMSE [W m-2] |
Phase Shift [months] |
Bias Score [1] |
RMSE Score [1] |
Seasonal Cycle Score [1] |
Spatial Distribution Score [1] |
Overall Score [1] |
|||
|---|---|---|---|---|---|---|---|---|---|---|---|---|---|---|---|---|
| Benchmark | [-] | 11.6 | ||||||||||||||
| 271 | [-] | 14.4 | 14.5 | 11.6 | 13.9 | 2.95 | 8.51 | 0.416 | 0.547 | 0.491 | 0.972 | 0.957 | 0.692 | |||
| 330 | [-] | 14.5 | 14.6 | 11.6 | 14.0 | 3.07 | 8.13 | 0.304 | 0.550 | 0.519 | 0.979 | 0.948 | 0.703 | |||
| CMIP6_001 | [-] | 14.9 | 15.4 | 11.6 | 12.2 | 3.80 | 10.4 | 0.503 | 0.396 | 0.404 | 0.967 | 0.799 | 0.594 |
Download Data |
Period Mean (original grids) [W m-2] |
Model Period Mean (intersection) [W m-2] |
Benchmark Period Mean (intersection) [W m-2] |
Model Period Mean (complement) [W m-2] |
Benchmark Period Mean (complement) [W m-2] |
Bias [W m-2] |
RMSE [W m-2] |
Phase Shift [months] |
Bias Score [1] |
RMSE Score [1] |
Seasonal Cycle Score [1] |
Spatial Distribution Score [1] |
Overall Score [1] |
|||
|---|---|---|---|---|---|---|---|---|---|---|---|---|---|---|---|---|
| Benchmark | [-] | 98.8 | ||||||||||||||
| 271 | [-] | 95.3 | 92.8 | 98.8 | 98.7 | -5.02 | 13.9 | 1.73 | 0.607 | 0.756 | 0.747 | 0.930 | 0.759 | |||
| 330 | [-] | 89.1 | 86.0 | 98.8 | 93.5 | -11.9 | 16.6 | 1.62 | 0.477 | 0.772 | 0.779 | 0.844 | 0.729 | |||
| CMIP6_001 | [-] | 96.1 | 93.7 | 98.8 | 99.8 | 126. | -3.91 | 12.8 | 2.47 | 0.645 | 0.774 | 0.597 | 0.863 | 0.730 |
Download Data |
Period Mean (original grids) [W m-2] |
Model Period Mean (intersection) [W m-2] |
Benchmark Period Mean (intersection) [W m-2] |
Model Period Mean (complement) [W m-2] |
Benchmark Period Mean (complement) [W m-2] |
Bias [W m-2] |
RMSE [W m-2] |
Phase Shift [months] |
Bias Score [1] |
RMSE Score [1] |
Seasonal Cycle Score [1] |
Spatial Distribution Score [1] |
Overall Score [1] |
|||
|---|---|---|---|---|---|---|---|---|---|---|---|---|---|---|---|---|
| Benchmark | [-] | 23.0 | ||||||||||||||
| 271 | [-] | 29.2 | 29.1 | 23.0 | 30.3 | 6.09 | 11.3 | 0.261 | 0.436 | 0.512 | 0.982 | 0.944 | 0.677 | |||
| 330 | [-] | 31.2 | 31.1 | 23.0 | 32.6 | 8.11 | 12.3 | 0.220 | 0.349 | 0.503 | 0.985 | 0.991 | 0.666 | |||
| CMIP6_001 | [-] | 29.4 | 29.4 | 23.0 | 30.3 | 6.34 | 11.0 | 0.296 | 0.453 | 0.535 | 0.980 | 0.985 | 0.698 |
Download Data |
Period Mean (original grids) [W m-2] |
Model Period Mean (intersection) [W m-2] |
Benchmark Period Mean (intersection) [W m-2] |
Model Period Mean (complement) [W m-2] |
Benchmark Period Mean (complement) [W m-2] |
Bias [W m-2] |
RMSE [W m-2] |
Phase Shift [months] |
Bias Score [1] |
RMSE Score [1] |
Seasonal Cycle Score [1] |
Spatial Distribution Score [1] |
Overall Score [1] |
|||
|---|---|---|---|---|---|---|---|---|---|---|---|---|---|---|---|---|
| Benchmark | [-] | 25.0 | ||||||||||||||
| 271 | [-] | 35.2 | 33.9 | 25.0 | 50.1 | 9.12 | 15.9 | 0.703 | 0.436 | 0.471 | 0.932 | 0.969 | 0.656 | |||
| 330 | [-] | 34.0 | 32.8 | 25.0 | 48.4 | 8.03 | 15.2 | 0.689 | 0.470 | 0.488 | 0.932 | 0.959 | 0.668 | |||
| CMIP6_001 | [-] | 34.0 | 32.9 | 25.0 | 46.8 | 44.0 | 8.05 | 16.7 | 0.773 | 0.445 | 0.446 | 0.925 | 0.968 | 0.646 |
Download Data |
Period Mean (original grids) [W m-2] |
Model Period Mean (intersection) [W m-2] |
Benchmark Period Mean (intersection) [W m-2] |
Model Period Mean (complement) [W m-2] |
Benchmark Period Mean (complement) [W m-2] |
Bias [W m-2] |
RMSE [W m-2] |
Phase Shift [months] |
Bias Score [1] |
RMSE Score [1] |
Seasonal Cycle Score [1] |
Spatial Distribution Score [1] |
Overall Score [1] |
|||
|---|---|---|---|---|---|---|---|---|---|---|---|---|---|---|---|---|
| Benchmark | [-] | 53.0 | ||||||||||||||
| 271 | [-] | 57.1 | 53.9 | 53.0 | 76.9 | 1.34 | 17.3 | 1.68 | 0.656 | 0.510 | 0.771 | 0.982 | 0.686 | |||
| 330 | [-] | 55.3 | 52.4 | 53.0 | 73.4 | -0.203 | 17.4 | 1.70 | 0.624 | 0.518 | 0.773 | 0.959 | 0.678 | |||
| CMIP6_001 | [-] | 58.7 | 55.5 | 53.0 | 79.1 | 44.6 | 2.94 | 19.9 | 1.98 | 0.637 | 0.431 | 0.712 | 0.991 | 0.640 |
Download Data |
Period Mean (original grids) [W m-2] |
Model Period Mean (intersection) [W m-2] |
Benchmark Period Mean (intersection) [W m-2] |
Model Period Mean (complement) [W m-2] |
Benchmark Period Mean (complement) [W m-2] |
Bias [W m-2] |
RMSE [W m-2] |
Phase Shift [months] |
Bias Score [1] |
RMSE Score [1] |
Seasonal Cycle Score [1] |
Spatial Distribution Score [1] |
Overall Score [1] |
|||
|---|---|---|---|---|---|---|---|---|---|---|---|---|---|---|---|---|
| Benchmark | [-] | 12.8 | ||||||||||||||
| 271 | [-] | 14.3 | 15.2 | 12.8 | 10.9 | 2.24 | 9.21 | 0.118 | 0.614 | 0.452 | 0.990 | 0.969 | 0.695 | |||
| 330 | [-] | 15.0 | 15.9 | 12.8 | 11.8 | 2.98 | 9.12 | 0.110 | 0.585 | 0.466 | 0.991 | 0.944 | 0.691 | |||
| CMIP6_001 | [-] | 13.6 | 14.6 | 12.8 | 10.1 | 10.5 | 1.77 | 9.89 | 0.132 | 0.578 | 0.406 | 0.989 | 0.922 | 0.661 |
Download Data |
Period Mean (original grids) [W m-2] |
Model Period Mean (intersection) [W m-2] |
Benchmark Period Mean (intersection) [W m-2] |
Model Period Mean (complement) [W m-2] |
Benchmark Period Mean (complement) [W m-2] |
Bias [W m-2] |
RMSE [W m-2] |
Phase Shift [months] |
Bias Score [1] |
RMSE Score [1] |
Seasonal Cycle Score [1] |
Spatial Distribution Score [1] |
Overall Score [1] |
|||
|---|---|---|---|---|---|---|---|---|---|---|---|---|---|---|---|---|
| Benchmark | [-] | 26.3 | ||||||||||||||
| 271 | [-] | 41.9 | 41.1 | 26.3 | 48.9 | 15.0 | 20.1 | 1.06 | 0.289 | 0.556 | 0.881 | 0.942 | 0.645 | |||
| 330 | [-] | 41.9 | 41.2 | 26.3 | 47.6 | 15.1 | 20.6 | 0.924 | 0.272 | 0.545 | 0.899 | 0.955 | 0.643 | |||
| CMIP6_001 | [-] | 39.2 | 37.4 | 26.3 | 53.6 | 72.7 | 11.4 | 17.6 | 0.978 | 0.366 | 0.561 | 0.906 | 0.972 | 0.673 |
Download Data |
Period Mean (original grids) [W m-2] |
Model Period Mean (intersection) [W m-2] |
Benchmark Period Mean (intersection) [W m-2] |
Model Period Mean (complement) [W m-2] |
Benchmark Period Mean (complement) [W m-2] |
Bias [W m-2] |
RMSE [W m-2] |
Phase Shift [months] |
Bias Score [1] |
RMSE Score [1] |
Seasonal Cycle Score [1] |
Spatial Distribution Score [1] |
Overall Score [1] |
|||
|---|---|---|---|---|---|---|---|---|---|---|---|---|---|---|---|---|
| Benchmark | [-] | 33.2 | ||||||||||||||
| 271 | [-] | 37.1 | 37.5 | 33.2 | 35.6 | 4.35 | 12.2 | 0.621 | 0.654 | 0.556 | 0.949 | 0.980 | 0.739 | |||
| 330 | [-] | 37.6 | 37.8 | 33.2 | 36.8 | 4.71 | 12.3 | 0.681 | 0.622 | 0.566 | 0.943 | 0.981 | 0.735 | |||
| CMIP6_001 | [-] | 35.6 | 36.2 | 33.2 | 33.0 | 23.4 | 3.04 | 14.1 | 0.771 | 0.671 | 0.464 | 0.935 | 0.993 | 0.705 |
Download Data |
Period Mean (original grids) [W m-2] |
Model Period Mean (intersection) [W m-2] |
Benchmark Period Mean (intersection) [W m-2] |
Model Period Mean (complement) [W m-2] |
Benchmark Period Mean (complement) [W m-2] |
Bias [W m-2] |
RMSE [W m-2] |
Phase Shift [months] |
Bias Score [1] |
RMSE Score [1] |
Seasonal Cycle Score [1] |
Spatial Distribution Score [1] |
Overall Score [1] |
|||
|---|---|---|---|---|---|---|---|---|---|---|---|---|---|---|---|---|
| Benchmark | [-] | 36.4 | ||||||||||||||
| 271 | [-] | 38.2 | 42.0 | 36.4 | 23.1 | 5.81 | 15.2 | 1.13 | 0.506 | 0.552 | 0.853 | 0.976 | 0.688 | |||
| 330 | [-] | 37.8 | 41.7 | 36.4 | 22.8 | 5.43 | 15.0 | 1.13 | 0.506 | 0.553 | 0.853 | 0.967 | 0.687 | |||
| CMIP6_001 | [-] | 37.2 | 41.1 | 36.4 | 21.9 | 41.8 | 4.96 | 15.2 | 1.28 | 0.539 | 0.530 | 0.829 | 0.983 | 0.682 |
Download Data |
Period Mean (original grids) [W m-2] |
Model Period Mean (intersection) [W m-2] |
Benchmark Period Mean (intersection) [W m-2] |
Model Period Mean (complement) [W m-2] |
Benchmark Period Mean (complement) [W m-2] |
Bias [W m-2] |
RMSE [W m-2] |
Phase Shift [months] |
Bias Score [1] |
RMSE Score [1] |
Seasonal Cycle Score [1] |
Spatial Distribution Score [1] |
Overall Score [1] |
|||
|---|---|---|---|---|---|---|---|---|---|---|---|---|---|---|---|---|
| Benchmark | [-] | 5.96 | ||||||||||||||
| 271 | [-] | 12.3 | 11.9 | 5.96 | 20.1 | 6.14 | 9.65 | 1.77 | 0.639 | 0.698 | 0.735 | 0.866 | 0.727 | |||
| 330 | [-] | 12.0 | 11.6 | 5.96 | 20.4 | 5.84 | 9.35 | 1.89 | 0.657 | 0.703 | 0.711 | 0.847 | 0.724 | |||
| CMIP6_001 | [-] | 10.1 | 9.80 | 5.96 | 18.3 | 8.39 | 3.92 | 8.77 | 2.11 | 0.750 | 0.688 | 0.678 | 0.876 | 0.736 |
Download Data |
Period Mean (original grids) [W m-2] |
Model Period Mean (intersection) [W m-2] |
Benchmark Period Mean (intersection) [W m-2] |
Model Period Mean (complement) [W m-2] |
Benchmark Period Mean (complement) [W m-2] |
Bias [W m-2] |
RMSE [W m-2] |
Phase Shift [months] |
Bias Score [1] |
RMSE Score [1] |
Seasonal Cycle Score [1] |
Spatial Distribution Score [1] |
Overall Score [1] |
|||
|---|---|---|---|---|---|---|---|---|---|---|---|---|---|---|---|---|
| Benchmark | [-] | 12.8 | ||||||||||||||
| 271 | [-] | 17.1 | 18.6 | 12.8 | 13.3 | 5.53 | 11.5 | 0.439 | 0.362 | 0.428 | 0.968 | 0.934 | 0.624 | |||
| 330 | [-] | 17.9 | 19.6 | 12.8 | 13.7 | 6.49 | 12.4 | 0.489 | 0.318 | 0.398 | 0.964 | 0.905 | 0.596 | |||
| CMIP6_001 | [-] | 15.3 | 17.1 | 12.8 | 11.7 | 7.13 | 4.22 | 10.6 | 0.576 | 0.460 | 0.448 | 0.956 | 0.965 | 0.655 |
Download Data |
Period Mean (original grids) [W m-2] |
Model Period Mean (intersection) [W m-2] |
Benchmark Period Mean (intersection) [W m-2] |
Model Period Mean (complement) [W m-2] |
Benchmark Period Mean (complement) [W m-2] |
Bias [W m-2] |
RMSE [W m-2] |
Phase Shift [months] |
Bias Score [1] |
RMSE Score [1] |
Seasonal Cycle Score [1] |
Spatial Distribution Score [1] |
Overall Score [1] |
|||
|---|---|---|---|---|---|---|---|---|---|---|---|---|---|---|---|---|
| Benchmark | [-] | 50.5 | ||||||||||||||
| 271 | [-] | 66.7 | 64.3 | 50.5 | 74.0 | 14.5 | 21.7 | 1.27 | 0.337 | 0.572 | 0.842 | 0.965 | 0.657 | |||
| 330 | [-] | 63.7 | 61.3 | 50.5 | 71.3 | 11.5 | 19.9 | 1.37 | 0.401 | 0.572 | 0.826 | 0.964 | 0.667 | |||
| CMIP6_001 | [-] | 60.7 | 60.1 | 50.5 | 63.7 | 31.4 | 10.5 | 22.1 | 1.72 | 0.384 | 0.504 | 0.761 | 0.980 | 0.627 |
Download Data |
Period Mean (original grids) [W m-2] |
Model Period Mean (intersection) [W m-2] |
Benchmark Period Mean (intersection) [W m-2] |
Model Period Mean (complement) [W m-2] |
Benchmark Period Mean (complement) [W m-2] |
Bias [W m-2] |
RMSE [W m-2] |
Phase Shift [months] |
Bias Score [1] |
RMSE Score [1] |
Seasonal Cycle Score [1] |
Spatial Distribution Score [1] |
Overall Score [1] |
|||
|---|---|---|---|---|---|---|---|---|---|---|---|---|---|---|---|---|
| Benchmark | [-] | 54.7 | ||||||||||||||
| 271 | [-] | 56.5 | 56.0 | 54.7 | 61.6 | 1.64 | 13.5 | 0.522 | 0.618 | 0.530 | 0.954 | 0.964 | 0.719 | |||
| 330 | [-] | 55.3 | 54.8 | 54.7 | 60.7 | 0.442 | 14.3 | 0.761 | 0.642 | 0.483 | 0.928 | 0.967 | 0.700 | |||
| CMIP6_001 | [-] | 51.5 | 50.7 | 54.7 | 58.6 | -3.52 | 16.7 | 0.828 | 0.541 | 0.426 | 0.921 | 0.992 | 0.661 |
Download Data |
Period Mean (original grids) [W m-2] |
Model Period Mean (intersection) [W m-2] |
Benchmark Period Mean (intersection) [W m-2] |
Model Period Mean (complement) [W m-2] |
Benchmark Period Mean (complement) [W m-2] |
Bias [W m-2] |
RMSE [W m-2] |
Phase Shift [months] |
Bias Score [1] |
RMSE Score [1] |
Seasonal Cycle Score [1] |
Spatial Distribution Score [1] |
Overall Score [1] |
|||
|---|---|---|---|---|---|---|---|---|---|---|---|---|---|---|---|---|
| Benchmark | [-] | 25.7 | ||||||||||||||
| 271 | [-] | 34.1 | 33.1 | 25.7 | 39.8 | 7.43 | 12.5 | 0.339 | 0.439 | 0.546 | 0.975 | 0.960 | 0.693 | |||
| 330 | [-] | 37.6 | 36.8 | 25.7 | 42.3 | 11.1 | 15.1 | 0.404 | 0.237 | 0.526 | 0.969 | 0.992 | 0.650 | |||
| CMIP6_001 | [-] | 32.5 | 32.0 | 25.7 | 35.8 | 6.24 | 12.7 | 0.364 | 0.497 | 0.506 | 0.971 | 0.983 | 0.693 |
Download Data |
Period Mean (original grids) [W m-2] |
Model Period Mean (intersection) [W m-2] |
Benchmark Period Mean (intersection) [W m-2] |
Model Period Mean (complement) [W m-2] |
Benchmark Period Mean (complement) [W m-2] |
Bias [W m-2] |
RMSE [W m-2] |
Phase Shift [months] |
Bias Score [1] |
RMSE Score [1] |
Seasonal Cycle Score [1] |
Spatial Distribution Score [1] |
Overall Score [1] |
|||
|---|---|---|---|---|---|---|---|---|---|---|---|---|---|---|---|---|
| Benchmark | [-] | 26.3 | ||||||||||||||
| 271 | [-] | 33.4 | 33.6 | 26.3 | 36.5 | 7.49 | 14.0 | 0.909 | 0.510 | 0.544 | 0.906 | 0.968 | 0.695 | |||
| 330 | [-] | 33.7 | 33.7 | 26.3 | 37.6 | 7.59 | 15.0 | 1.07 | 0.487 | 0.508 | 0.888 | 0.947 | 0.668 | |||
| CMIP6_001 | [-] | 29.0 | 29.2 | 26.2 | 30.7 | 32.7 | 3.07 | 13.7 | 1.18 | 0.604 | 0.509 | 0.862 | 0.850 | 0.667 |
Download Data |
Period Mean (original grids) [W m-2] |
Model Period Mean (intersection) [W m-2] |
Benchmark Period Mean (intersection) [W m-2] |
Model Period Mean (complement) [W m-2] |
Benchmark Period Mean (complement) [W m-2] |
Bias [W m-2] |
RMSE [W m-2] |
Phase Shift [months] |
Bias Score [1] |
RMSE Score [1] |
Seasonal Cycle Score [1] |
Spatial Distribution Score [1] |
Overall Score [1] |
|||
|---|---|---|---|---|---|---|---|---|---|---|---|---|---|---|---|---|
| Benchmark | [-] | 91.0 | ||||||||||||||
| 271 | [-] | 89.2 | 89.6 | 91.0 | 85.0 | -1.67 | 20.5 | 2.51 | 0.582 | 0.534 | 0.603 | 0.905 | 0.632 | |||
| 330 | [-] | 85.8 | 86.1 | 91.0 | 82.0 | -5.17 | 18.4 | 2.26 | 0.651 | 0.575 | 0.641 | 0.982 | 0.685 | |||
| CMIP6_001 | [-] | 94.5 | 94.6 | 91.1 | 92.8 | 78.2 | 3.50 | 20.6 | 2.55 | 0.593 | 0.526 | 0.589 | 0.934 | 0.634 |
Download Data |
Period Mean (original grids) [W m-2] |
Model Period Mean (intersection) [W m-2] |
Benchmark Period Mean (intersection) [W m-2] |
Model Period Mean (complement) [W m-2] |
Benchmark Period Mean (complement) [W m-2] |
Bias [W m-2] |
RMSE [W m-2] |
Phase Shift [months] |
Bias Score [1] |
RMSE Score [1] |
Seasonal Cycle Score [1] |
Spatial Distribution Score [1] |
Overall Score [1] |
|||
|---|---|---|---|---|---|---|---|---|---|---|---|---|---|---|---|---|
| Benchmark | [-] | 66.6 | ||||||||||||||
| 271 | [-] | 61.2 | 61.2 | 66.6 | 61.5 | -5.31 | 16.6 | 1.29 | 0.605 | 0.603 | 0.846 | 0.991 | 0.730 | |||
| 330 | [-] | 63.8 | 63.7 | 66.6 | 64.6 | -2.74 | 15.6 | 1.32 | 0.670 | 0.606 | 0.841 | 0.960 | 0.736 | |||
| CMIP6_001 | [-] | 60.0 | 59.8 | 66.6 | 64.5 | -6.63 | 19.0 | 1.34 | 0.529 | 0.562 | 0.838 | 0.987 | 0.696 |
Download Data |
Period Mean (original grids) [W m-2] |
Model Period Mean (intersection) [W m-2] |
Benchmark Period Mean (intersection) [W m-2] |
Model Period Mean (complement) [W m-2] |
Benchmark Period Mean (complement) [W m-2] |
Bias [W m-2] |
RMSE [W m-2] |
Phase Shift [months] |
Bias Score [1] |
RMSE Score [1] |
Seasonal Cycle Score [1] |
Spatial Distribution Score [1] |
Overall Score [1] |
|||
|---|---|---|---|---|---|---|---|---|---|---|---|---|---|---|---|---|
| Benchmark | [-] | 22.4 | ||||||||||||||
| 271 | [-] | 41.3 | 41.7 | 22.4 | 36.3 | 18.8 | 23.6 | 1.48 | 0.183 | 0.496 | 0.806 | 0.949 | 0.586 | |||
| 330 | [-] | 40.8 | 41.2 | 22.4 | 36.0 | 18.3 | 23.2 | 1.45 | 0.189 | 0.495 | 0.814 | 0.951 | 0.589 | |||
| CMIP6_001 | [-] | 37.1 | 37.5 | 22.4 | 31.3 | 10.7 | 14.7 | 20.9 | 1.70 | 0.301 | 0.466 | 0.766 | 0.932 | 0.586 |
Temporally integrated period mean