Mean State
Download Data |
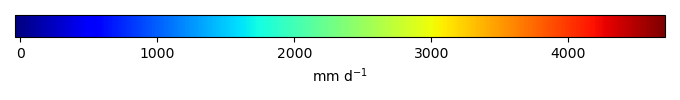
Period Mean (original grids) [mm d-1] |
Model Period Mean (intersection) [mm d-1] |
Benchmark Period Mean (intersection) [mm d-1] |
Model Period Mean (complement) [mm d-1] |
Benchmark Period Mean (complement) [mm d-1] |
Bias [mm d-1] |
RMSE [mm d-1] |
Phase Shift [months] |
Bias Score [1] |
RMSE Score [1] |
Seasonal Cycle Score [1] |
Spatial Distribution Score [1] |
Overall Score [1] |
|||
|---|---|---|---|---|---|---|---|---|---|---|---|---|---|---|---|---|
| Benchmark | [-] | 1.02 | ||||||||||||||
| 271 | [-] | 1.51 | 1.48 | 1.02 | 2.45 | 0.499 | 1.08 | 1.90 | 0.342 | 0.477 | 0.705 | 0.887 | 0.578 | |||
| 330 | [-] | 1.72 | 1.69 | 1.02 | 2.48 | 0.699 | 1.19 | 1.98 | 0.278 | 0.455 | 0.691 | 0.868 | 0.549 | |||
| CMIP6_001 | [-] | 1.60 | 1.61 | 1.02 | 1.62 | 1.05 | 0.590 | 1.13 | 2.05 | 0.389 | 0.519 | 0.687 | 0.904 | 0.604 |
Download Data |
Period Mean (original grids) [mm d-1] |
Model Period Mean (intersection) [mm d-1] |
Benchmark Period Mean (intersection) [mm d-1] |
Model Period Mean (complement) [mm d-1] |
Benchmark Period Mean (complement) [mm d-1] |
Bias [mm d-1] |
RMSE [mm d-1] |
Phase Shift [months] |
Bias Score [1] |
RMSE Score [1] |
Seasonal Cycle Score [1] |
Spatial Distribution Score [1] |
Overall Score [1] |
|||
|---|---|---|---|---|---|---|---|---|---|---|---|---|---|---|---|---|
| Benchmark | [-] | 0.410 | ||||||||||||||
| 271 | [-] | 1.44 | 1.42 | 0.410 | 2.14 | 1.01 | 1.31 | 0.929 | 0.106 | 0.331 | 0.893 | 0.623 | 0.457 | |||
| 330 | [-] | 1.39 | 1.37 | 0.410 | 1.83 | 0.957 | 1.27 | 0.959 | 0.129 | 0.335 | 0.887 | 0.637 | 0.465 | |||
| CMIP6_001 | [-] | 0.879 | 0.862 | 0.409 | 0.928 | 3.13 | 0.446 | 0.812 | 0.931 | 0.355 | 0.436 | 0.891 | 0.724 | 0.568 |
Download Data |
Period Mean (original grids) [mm d-1] |
Model Period Mean (intersection) [mm d-1] |
Benchmark Period Mean (intersection) [mm d-1] |
Model Period Mean (complement) [mm d-1] |
Benchmark Period Mean (complement) [mm d-1] |
Bias [mm d-1] |
RMSE [mm d-1] |
Phase Shift [months] |
Bias Score [1] |
RMSE Score [1] |
Seasonal Cycle Score [1] |
Spatial Distribution Score [1] |
Overall Score [1] |
|||
|---|---|---|---|---|---|---|---|---|---|---|---|---|---|---|---|---|
| Benchmark | [-] | 0.407 | ||||||||||||||
| 271 | [-] | 1.20 | 1.21 | 0.407 | 1.13 | 0.798 | 1.13 | 1.32 | 0.207 | 0.460 | 0.823 | 0.732 | 0.536 | |||
| 330 | [-] | 1.19 | 1.19 | 0.407 | 1.21 | 0.780 | 1.12 | 1.27 | 0.225 | 0.467 | 0.833 | 0.725 | 0.543 | |||
| CMIP6_001 | [-] | 0.879 | 0.892 | 0.406 | 0.585 | 0.696 | 0.476 | 0.908 | 1.34 | 0.327 | 0.501 | 0.818 | 0.831 | 0.596 |
Download Data |
Period Mean (original grids) [mm d-1] |
Model Period Mean (intersection) [mm d-1] |
Benchmark Period Mean (intersection) [mm d-1] |
Model Period Mean (complement) [mm d-1] |
Benchmark Period Mean (complement) [mm d-1] |
Bias [mm d-1] |
RMSE [mm d-1] |
Phase Shift [months] |
Bias Score [1] |
RMSE Score [1] |
Seasonal Cycle Score [1] |
Spatial Distribution Score [1] |
Overall Score [1] |
|||
|---|---|---|---|---|---|---|---|---|---|---|---|---|---|---|---|---|
| Benchmark | [-] | 0.970 | ||||||||||||||
| 271 | [-] | 1.02 | 0.995 | 0.970 | 1.20 | 0.0401 | 1.27 | 0.551 | 0.347 | 0.318 | 0.952 | 0.813 | 0.550 | |||
| 330 | [-] | 0.998 | 0.977 | 0.970 | 1.14 | 0.0214 | 1.28 | 0.527 | 0.351 | 0.308 | 0.955 | 0.780 | 0.540 | |||
| CMIP6_001 | [-] | 0.973 | 0.932 | 0.968 | 1.27 | 2.16 | -0.0193 | 1.31 | 0.666 | 0.386 | 0.267 | 0.943 | 0.771 | 0.527 |
Download Data |
Period Mean (original grids) [mm d-1] |
Model Period Mean (intersection) [mm d-1] |
Benchmark Period Mean (intersection) [mm d-1] |
Model Period Mean (complement) [mm d-1] |
Benchmark Period Mean (complement) [mm d-1] |
Bias [mm d-1] |
RMSE [mm d-1] |
Phase Shift [months] |
Bias Score [1] |
RMSE Score [1] |
Seasonal Cycle Score [1] |
Spatial Distribution Score [1] |
Overall Score [1] |
|||
|---|---|---|---|---|---|---|---|---|---|---|---|---|---|---|---|---|
| Benchmark | [-] | 2.63 | ||||||||||||||
| 271 | [-] | 4.67 | 5.01 | 2.63 | 3.99 | 1.57 | 2.23 | 2.95 | 1.45 | 0.314 | 0.623 | 0.787 | 0.889 | 0.647 | ||
| 330 | [-] | 4.50 | 4.85 | 2.63 | 3.79 | 1.57 | 2.07 | 2.92 | 1.45 | 0.332 | 0.600 | 0.790 | 0.878 | 0.640 | ||
| CMIP6_001 | [-] | 6.45 | 7.08 | 2.64 | 4.98 | 1.86 | 4.12 | 4.76 | 1.68 | 0.131 | 0.508 | 0.753 | 0.570 | 0.494 |
Download Data |
Period Mean (original grids) [mm d-1] |
Model Period Mean (intersection) [mm d-1] |
Benchmark Period Mean (intersection) [mm d-1] |
Model Period Mean (complement) [mm d-1] |
Benchmark Period Mean (complement) [mm d-1] |
Bias [mm d-1] |
RMSE [mm d-1] |
Phase Shift [months] |
Bias Score [1] |
RMSE Score [1] |
Seasonal Cycle Score [1] |
Spatial Distribution Score [1] |
Overall Score [1] |
|||
|---|---|---|---|---|---|---|---|---|---|---|---|---|---|---|---|---|
| Benchmark | [-] | 0.789 | ||||||||||||||
| 271 | [-] | 0.726 | 0.723 | 0.789 | 1.09 | -0.0618 | 0.668 | 0.605 | 0.489 | 0.592 | 0.926 | 0.897 | 0.699 | |||
| 330 | [-] | 0.677 | 0.675 | 0.789 | 0.945 | -0.111 | 0.681 | 0.717 | 0.490 | 0.583 | 0.916 | 0.868 | 0.688 | |||
| CMIP6_001 | [-] | 0.647 | 0.641 | 0.789 | 0.992 | 1.06 | -0.144 | 0.667 | 0.719 | 0.489 | 0.594 | 0.914 | 0.890 | 0.696 |
Download Data |
Period Mean (original grids) [mm d-1] |
Model Period Mean (intersection) [mm d-1] |
Benchmark Period Mean (intersection) [mm d-1] |
Model Period Mean (complement) [mm d-1] |
Benchmark Period Mean (complement) [mm d-1] |
Bias [mm d-1] |
RMSE [mm d-1] |
Phase Shift [months] |
Bias Score [1] |
RMSE Score [1] |
Seasonal Cycle Score [1] |
Spatial Distribution Score [1] |
Overall Score [1] |
|||
|---|---|---|---|---|---|---|---|---|---|---|---|---|---|---|---|---|
| Benchmark | [-] | 0.522 | ||||||||||||||
| 271 | [-] | 0.711 | 0.732 | 0.522 | 0.689 | 0.231 | 0.655 | 1.14 | 0.445 | 0.570 | 0.851 | 0.763 | 0.640 | |||
| 330 | [-] | 0.690 | 0.710 | 0.522 | 0.678 | 0.209 | 0.651 | 1.15 | 0.445 | 0.566 | 0.852 | 0.778 | 0.641 | |||
| CMIP6_001 | [-] | 0.683 | 0.697 | 0.522 | 0.811 | 1.99 | 0.190 | 0.673 | 1.15 | 0.427 | 0.533 | 0.846 | 0.736 | 0.615 |
Download Data |
Period Mean (original grids) [mm d-1] |
Model Period Mean (intersection) [mm d-1] |
Benchmark Period Mean (intersection) [mm d-1] |
Model Period Mean (complement) [mm d-1] |
Benchmark Period Mean (complement) [mm d-1] |
Bias [mm d-1] |
RMSE [mm d-1] |
Phase Shift [months] |
Bias Score [1] |
RMSE Score [1] |
Seasonal Cycle Score [1] |
Spatial Distribution Score [1] |
Overall Score [1] |
|||
|---|---|---|---|---|---|---|---|---|---|---|---|---|---|---|---|---|
| Benchmark | [-] | 1.39 | ||||||||||||||
| 271 | [-] | 1.91 | 1.77 | 1.39 | 2.77 | 0.419 | 1.66 | 1.01 | 0.376 | 0.416 | 0.888 | 0.900 | 0.599 | |||
| 330 | [-] | 1.80 | 1.66 | 1.39 | 2.72 | 0.308 | 1.59 | 1.02 | 0.381 | 0.419 | 0.889 | 0.900 | 0.602 | |||
| CMIP6_001 | [-] | 1.73 | 1.60 | 1.39 | 2.55 | 1.89 | 0.252 | 1.83 | 1.06 | 0.369 | 0.319 | 0.875 | 0.868 | 0.550 |
Download Data |
Period Mean (original grids) [mm d-1] |
Model Period Mean (intersection) [mm d-1] |
Benchmark Period Mean (intersection) [mm d-1] |
Model Period Mean (complement) [mm d-1] |
Benchmark Period Mean (complement) [mm d-1] |
Bias [mm d-1] |
RMSE [mm d-1] |
Phase Shift [months] |
Bias Score [1] |
RMSE Score [1] |
Seasonal Cycle Score [1] |
Spatial Distribution Score [1] |
Overall Score [1] |
|||
|---|---|---|---|---|---|---|---|---|---|---|---|---|---|---|---|---|
| Benchmark | [-] | 1.09 | ||||||||||||||
| 271 | [-] | 0.811 | 0.811 | 1.09 | 0.825 | -0.273 | 1.13 | 0.320 | 0.359 | 0.379 | 0.979 | 0.591 | 0.538 | |||
| 330 | [-] | 0.764 | 0.762 | 1.09 | 0.780 | -0.321 | 1.13 | 0.316 | 0.337 | 0.390 | 0.979 | 0.568 | 0.533 | |||
| CMIP6_001 | [-] | 0.932 | 0.917 | 1.09 | 1.01 | 0.971 | -0.167 | 1.26 | 0.421 | 0.388 | 0.308 | 0.971 | 0.750 | 0.545 |
Download Data |
Period Mean (original grids) [mm d-1] |
Model Period Mean (intersection) [mm d-1] |
Benchmark Period Mean (intersection) [mm d-1] |
Model Period Mean (complement) [mm d-1] |
Benchmark Period Mean (complement) [mm d-1] |
Bias [mm d-1] |
RMSE [mm d-1] |
Phase Shift [months] |
Bias Score [1] |
RMSE Score [1] |
Seasonal Cycle Score [1] |
Spatial Distribution Score [1] |
Overall Score [1] |
|||
|---|---|---|---|---|---|---|---|---|---|---|---|---|---|---|---|---|
| Benchmark | [-] | 0.232 | ||||||||||||||
| 271 | [-] | 0.504 | 0.454 | 0.232 | 1.09 | 0.257 | 0.447 | 1.62 | 0.169 | 0.569 | 0.776 | 0.665 | 0.549 | |||
| 330 | [-] | 0.419 | 0.371 | 0.232 | 0.988 | 0.173 | 0.376 | 1.47 | 0.251 | 0.581 | 0.795 | 0.648 | 0.571 | |||
| CMIP6_001 | [-] | 0.365 | 0.347 | 0.229 | 0.575 | 1.40 | 0.138 | 0.342 | 1.38 | 0.214 | 0.634 | 0.821 | 0.660 | 0.593 |
Download Data |
Period Mean (original grids) [mm d-1] |
Model Period Mean (intersection) [mm d-1] |
Benchmark Period Mean (intersection) [mm d-1] |
Model Period Mean (complement) [mm d-1] |
Benchmark Period Mean (complement) [mm d-1] |
Bias [mm d-1] |
RMSE [mm d-1] |
Phase Shift [months] |
Bias Score [1] |
RMSE Score [1] |
Seasonal Cycle Score [1] |
Spatial Distribution Score [1] |
Overall Score [1] |
|||
|---|---|---|---|---|---|---|---|---|---|---|---|---|---|---|---|---|
| Benchmark | [-] | 0.925 | ||||||||||||||
| 271 | [-] | 1.13 | 1.14 | 0.925 | 1.16 | 0.201 | 0.733 | 1.48 | 0.316 | 0.562 | 0.797 | 0.896 | 0.627 | |||
| 330 | [-] | 1.09 | 1.10 | 0.925 | 1.07 | 0.162 | 0.710 | 1.50 | 0.328 | 0.572 | 0.793 | 0.877 | 0.629 | |||
| CMIP6_001 | [-] | 0.915 | 0.869 | 0.925 | 1.23 | 1.06 | -0.0687 | 0.671 | 1.74 | 0.434 | 0.553 | 0.750 | 0.949 | 0.647 |
Download Data |
Period Mean (original grids) [mm d-1] |
Model Period Mean (intersection) [mm d-1] |
Benchmark Period Mean (intersection) [mm d-1] |
Model Period Mean (complement) [mm d-1] |
Benchmark Period Mean (complement) [mm d-1] |
Bias [mm d-1] |
RMSE [mm d-1] |
Phase Shift [months] |
Bias Score [1] |
RMSE Score [1] |
Seasonal Cycle Score [1] |
Spatial Distribution Score [1] |
Overall Score [1] |
|||
|---|---|---|---|---|---|---|---|---|---|---|---|---|---|---|---|---|
| Benchmark | [-] | 0.818 | ||||||||||||||
| 271 | [-] | 0.969 | 1.04 | 0.818 | 0.605 | 1.57 | 0.246 | 1.00 | 1.27 | 0.371 | 0.523 | 0.829 | 0.860 | 0.621 | ||
| 330 | [-] | 0.949 | 1.02 | 0.818 | 0.605 | 1.57 | 0.222 | 0.988 | 1.27 | 0.380 | 0.522 | 0.829 | 0.862 | 0.623 | ||
| CMIP6_001 | [-] | 0.900 | 0.964 | 0.817 | 0.581 | 1.14 | 0.166 | 0.958 | 1.35 | 0.423 | 0.526 | 0.815 | 0.853 | 0.629 |
Download Data |
Period Mean (original grids) [mm d-1] |
Model Period Mean (intersection) [mm d-1] |
Benchmark Period Mean (intersection) [mm d-1] |
Model Period Mean (complement) [mm d-1] |
Benchmark Period Mean (complement) [mm d-1] |
Bias [mm d-1] |
RMSE [mm d-1] |
Phase Shift [months] |
Bias Score [1] |
RMSE Score [1] |
Seasonal Cycle Score [1] |
Spatial Distribution Score [1] |
Overall Score [1] |
|||
|---|---|---|---|---|---|---|---|---|---|---|---|---|---|---|---|---|
| Benchmark | [-] | 0.0614 | ||||||||||||||
| 271 | [-] | 0.0727 | 0.0738 | 0.0614 | 0.00985 | 0.0131 | 0.102 | 1.99 | 0.587 | 0.713 | 0.702 | 0.844 | 0.712 | |||
| 330 | [-] | 0.0794 | 0.0801 | 0.0614 | 0.0317 | 0.0197 | 0.105 | 2.04 | 0.595 | 0.714 | 0.693 | 0.850 | 0.713 | |||
| CMIP6_001 | [-] | 0.0329 | 0.0348 | 0.0612 | -0.0473 | 0.165 | -0.0263 | 0.101 | 2.28 | 0.692 | 0.723 | 0.644 | 0.822 | 0.721 |
Download Data |
Period Mean (original grids) [mm d-1] |
Model Period Mean (intersection) [mm d-1] |
Benchmark Period Mean (intersection) [mm d-1] |
Model Period Mean (complement) [mm d-1] |
Benchmark Period Mean (complement) [mm d-1] |
Bias [mm d-1] |
RMSE [mm d-1] |
Phase Shift [months] |
Bias Score [1] |
RMSE Score [1] |
Seasonal Cycle Score [1] |
Spatial Distribution Score [1] |
Overall Score [1] |
|||
|---|---|---|---|---|---|---|---|---|---|---|---|---|---|---|---|---|
| Benchmark | [-] | 0.944 | ||||||||||||||
| 271 | [-] | 1.07 | 1.12 | 0.944 | 0.867 | 0.187 | 1.30 | 0.692 | 0.366 | 0.326 | 0.931 | 0.931 | 0.576 | |||
| 330 | [-] | 1.00 | 1.06 | 0.944 | 0.799 | 0.119 | 1.21 | 0.711 | 0.410 | 0.339 | 0.928 | 0.941 | 0.591 | |||
| CMIP6_001 | [-] | 1.07 | 1.11 | 0.944 | 0.927 | 1.65 | 0.194 | 1.16 | 0.745 | 0.383 | 0.339 | 0.922 | 0.937 | 0.584 |
Download Data |
Period Mean (original grids) [mm d-1] |
Model Period Mean (intersection) [mm d-1] |
Benchmark Period Mean (intersection) [mm d-1] |
Model Period Mean (complement) [mm d-1] |
Benchmark Period Mean (complement) [mm d-1] |
Bias [mm d-1] |
RMSE [mm d-1] |
Phase Shift [months] |
Bias Score [1] |
RMSE Score [1] |
Seasonal Cycle Score [1] |
Spatial Distribution Score [1] |
Overall Score [1] |
|||
|---|---|---|---|---|---|---|---|---|---|---|---|---|---|---|---|---|
| Benchmark | [-] | 0.988 | ||||||||||||||
| 271 | [-] | 1.61 | 1.57 | 0.988 | 1.65 | 0.624 | 1.68 | 1.13 | 0.209 | 0.367 | 0.855 | 0.840 | 0.528 | |||
| 330 | [-] | 1.55 | 1.50 | 0.988 | 1.68 | 0.560 | 1.60 | 1.08 | 0.220 | 0.375 | 0.859 | 0.851 | 0.536 | |||
| CMIP6_001 | [-] | 0.930 | 0.863 | 0.989 | 1.14 | 0.916 | -0.105 | 1.12 | 1.48 | 0.308 | 0.487 | 0.791 | 0.860 | 0.586 |
Download Data |
Period Mean (original grids) [mm d-1] |
Model Period Mean (intersection) [mm d-1] |
Benchmark Period Mean (intersection) [mm d-1] |
Model Period Mean (complement) [mm d-1] |
Benchmark Period Mean (complement) [mm d-1] |
Bias [mm d-1] |
RMSE [mm d-1] |
Phase Shift [months] |
Bias Score [1] |
RMSE Score [1] |
Seasonal Cycle Score [1] |
Spatial Distribution Score [1] |
Overall Score [1] |
|||
|---|---|---|---|---|---|---|---|---|---|---|---|---|---|---|---|---|
| Benchmark | [-] | 0.867 | ||||||||||||||
| 271 | [-] | 0.845 | 0.851 | 0.867 | 0.927 | -0.0132 | 0.510 | 1.51 | 0.527 | 0.714 | 0.795 | 0.926 | 0.736 | |||
| 330 | [-] | 0.870 | 0.877 | 0.867 | 0.946 | 0.0150 | 0.501 | 1.22 | 0.548 | 0.719 | 0.837 | 0.941 | 0.753 | |||
| CMIP6_001 | [-] | 0.968 | 0.990 | 0.867 | 0.883 | 0.524 | 0.125 | 0.527 | 1.12 | 0.525 | 0.701 | 0.859 | 0.900 | 0.737 |
Download Data |
Period Mean (original grids) [mm d-1] |
Model Period Mean (intersection) [mm d-1] |
Benchmark Period Mean (intersection) [mm d-1] |
Model Period Mean (complement) [mm d-1] |
Benchmark Period Mean (complement) [mm d-1] |
Bias [mm d-1] |
RMSE [mm d-1] |
Phase Shift [months] |
Bias Score [1] |
RMSE Score [1] |
Seasonal Cycle Score [1] |
Spatial Distribution Score [1] |
Overall Score [1] |
|||
|---|---|---|---|---|---|---|---|---|---|---|---|---|---|---|---|---|
| Benchmark | [-] | 1.16 | ||||||||||||||
| 271 | [-] | 1.29 | 1.16 | 1.16 | 2.70 | 0.0305 | 1.11 | 0.855 | 0.492 | 0.508 | 0.905 | 0.958 | 0.674 | |||
| 330 | [-] | 1.24 | 1.12 | 1.16 | 2.61 | -0.00955 | 1.02 | 0.856 | 0.511 | 0.522 | 0.905 | 0.955 | 0.683 | |||
| CMIP6_001 | [-] | 1.12 | 1.00 | 1.16 | 2.77 | 4.10 | -0.131 | 0.926 | 0.802 | 0.524 | 0.550 | 0.912 | 0.966 | 0.700 |
Download Data |
Period Mean (original grids) [mm d-1] |
Model Period Mean (intersection) [mm d-1] |
Benchmark Period Mean (intersection) [mm d-1] |
Model Period Mean (complement) [mm d-1] |
Benchmark Period Mean (complement) [mm d-1] |
Bias [mm d-1] |
RMSE [mm d-1] |
Phase Shift [months] |
Bias Score [1] |
RMSE Score [1] |
Seasonal Cycle Score [1] |
Spatial Distribution Score [1] |
Overall Score [1] |
|||
|---|---|---|---|---|---|---|---|---|---|---|---|---|---|---|---|---|
| Benchmark | [-] | 0.294 | ||||||||||||||
| 271 | [-] | 0.540 | 0.521 | 0.294 | 1.22 | 0.234 | 0.520 | 1.59 | 0.227 | 0.466 | 0.776 | 0.828 | 0.553 | |||
| 330 | [-] | 0.558 | 0.540 | 0.294 | 1.25 | 0.254 | 0.530 | 1.53 | 0.216 | 0.457 | 0.790 | 0.817 | 0.547 | |||
| CMIP6_001 | [-] | 0.453 | 0.433 | 0.293 | 1.47 | 1.98 | 0.151 | 0.476 | 1.86 | 0.310 | 0.473 | 0.727 | 0.884 | 0.573 |
Download Data |
Period Mean (original grids) [mm d-1] |
Model Period Mean (intersection) [mm d-1] |
Benchmark Period Mean (intersection) [mm d-1] |
Model Period Mean (complement) [mm d-1] |
Benchmark Period Mean (complement) [mm d-1] |
Bias [mm d-1] |
RMSE [mm d-1] |
Phase Shift [months] |
Bias Score [1] |
RMSE Score [1] |
Seasonal Cycle Score [1] |
Spatial Distribution Score [1] |
Overall Score [1] |
|||
|---|---|---|---|---|---|---|---|---|---|---|---|---|---|---|---|---|
| Benchmark | [-] | 3.21 | ||||||||||||||
| 271 | [-] | 2.18 | 2.17 | 3.21 | 2.58 | -0.992 | 2.71 | 0.760 | 0.234 | 0.420 | 0.921 | 0.813 | 0.562 | |||
| 330 | [-] | 2.15 | 2.14 | 3.21 | 2.58 | -1.03 | 2.73 | 0.810 | 0.229 | 0.410 | 0.913 | 0.809 | 0.554 | |||
| CMIP6_001 | [-] | 2.25 | 2.29 | 3.21 | 1.47 | 0.835 | -0.891 | 2.45 | 0.814 | 0.305 | 0.407 | 0.913 | 0.916 | 0.590 |
Download Data |
Period Mean (original grids) [mm d-1] |
Model Period Mean (intersection) [mm d-1] |
Benchmark Period Mean (intersection) [mm d-1] |
Model Period Mean (complement) [mm d-1] |
Benchmark Period Mean (complement) [mm d-1] |
Bias [mm d-1] |
RMSE [mm d-1] |
Phase Shift [months] |
Bias Score [1] |
RMSE Score [1] |
Seasonal Cycle Score [1] |
Spatial Distribution Score [1] |
Overall Score [1] |
|||
|---|---|---|---|---|---|---|---|---|---|---|---|---|---|---|---|---|
| Benchmark | [-] | 0.652 | ||||||||||||||
| 271 | [-] | 0.913 | 0.933 | 0.652 | 0.871 | 0.281 | 0.832 | 1.90 | 0.541 | 0.664 | 0.718 | 0.864 | 0.690 | |||
| 330 | [-] | 0.966 | 0.980 | 0.652 | 1.00 | 0.328 | 0.895 | 1.93 | 0.533 | 0.649 | 0.711 | 0.848 | 0.678 | |||
| CMIP6_001 | [-] | 1.02 | 1.04 | 0.652 | 0.644 | 1.26 | 0.376 | 1.12 | 2.00 | 0.507 | 0.598 | 0.705 | 0.732 | 0.628 |
Download Data |
Period Mean (original grids) [mm d-1] |
Model Period Mean (intersection) [mm d-1] |
Benchmark Period Mean (intersection) [mm d-1] |
Model Period Mean (complement) [mm d-1] |
Benchmark Period Mean (complement) [mm d-1] |
Bias [mm d-1] |
RMSE [mm d-1] |
Phase Shift [months] |
Bias Score [1] |
RMSE Score [1] |
Seasonal Cycle Score [1] |
Spatial Distribution Score [1] |
Overall Score [1] |
|||
|---|---|---|---|---|---|---|---|---|---|---|---|---|---|---|---|---|
| Benchmark | [-] | 0.550 | ||||||||||||||
| 271 | [-] | 2.20 | 2.22 | 0.550 | 2.21 | 1.63 | 2.21 | 1.69 | 0.114 | 0.289 | 0.760 | 0.577 | 0.406 | |||
| 330 | [-] | 2.11 | 2.15 | 0.550 | 2.05 | 1.56 | 2.11 | 1.65 | 0.127 | 0.290 | 0.765 | 0.593 | 0.413 | |||
| CMIP6_001 | [-] | 1.42 | 1.46 | 0.550 | 1.37 | 0.305 | 0.960 | 1.63 | 1.83 | 0.287 | 0.410 | 0.735 | 0.573 | 0.483 |
Temporally integrated period mean