Mean State
Download Data |
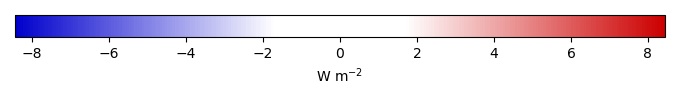
Period Mean (original grids) [W m-2] |
Model Period Mean (intersection) [W m-2] |
Benchmark Period Mean (intersection) [W m-2] |
Model Period Mean (complement) [W m-2] |
Benchmark Period Mean (complement) [W m-2] |
Bias [W m-2] |
RMSE [W m-2] |
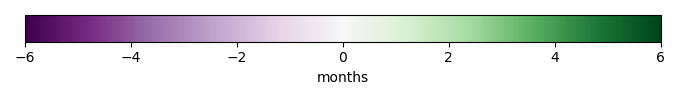
Phase Shift [months] |
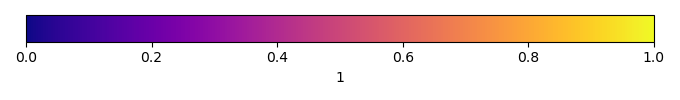
Bias Score [1] |
RMSE Score [1] |
Seasonal Cycle Score [1] |
Spatial Distribution Score [1] |
Overall Score [1] |
|||
|---|---|---|---|---|---|---|---|---|---|---|---|---|---|---|---|---|
| Benchmark | [-] | 0.518 | ||||||||||||||
| 271 | [-] | 0.0807 | 0.0805 | 0.518 | 0.0876 | -0.441 | 1.27 | 1.60 | 0.551 | 0.329 | 0.756 | 0.0154 | 0.396 | |||
| 330 | [-] | 0.0784 | 0.0773 | 0.518 | 0.0850 | -0.444 | 1.22 | 1.52 | 0.555 | 0.352 | 0.768 | 0.0103 | 0.407 | |||
| CMIP6_001 | [-] | 0.0424 | 0.0418 | 0.519 | 0.0690 | -0.0277 | -0.479 | 1.32 | 1.67 | 0.546 | 0.285 | 0.742 | 0.0124 | 0.374 |
Download Data |
Period Mean (original grids) [W m-2] |
Model Period Mean (intersection) [W m-2] |
Benchmark Period Mean (intersection) [W m-2] |
Model Period Mean (complement) [W m-2] |
Benchmark Period Mean (complement) [W m-2] |
Bias [W m-2] |
RMSE [W m-2] |
Phase Shift [months] |
Bias Score [1] |
RMSE Score [1] |
Seasonal Cycle Score [1] |
Spatial Distribution Score [1] |
Overall Score [1] |
|||
|---|---|---|---|---|---|---|---|---|---|---|---|---|---|---|---|---|
| Benchmark | [-] | -0.0251 | ||||||||||||||
| 271 | [-] | 0.0915 | 0.0919 | -0.0251 | 0.0732 | 0.119 | 1.82 | 1.08 | 0.746 | 0.257 | 0.860 | 0.0166 | 0.427 | |||
| 330 | [-] | 0.0903 | 0.0911 | -0.0251 | 0.0744 | 0.119 | 1.75 | 1.03 | 0.738 | 0.271 | 0.865 | 0.0189 | 0.433 | |||
| CMIP6_001 | [-] | 0.0932 | 0.0940 | -0.0250 | 0.0764 | -0.385 | 0.122 | 2.04 | 1.13 | 0.737 | 0.221 | 0.856 | 0.0311 | 0.413 |
Download Data |
Period Mean (original grids) [W m-2] |
Model Period Mean (intersection) [W m-2] |
Benchmark Period Mean (intersection) [W m-2] |
Model Period Mean (complement) [W m-2] |
Benchmark Period Mean (complement) [W m-2] |
Bias [W m-2] |
RMSE [W m-2] |
Phase Shift [months] |
Bias Score [1] |
RMSE Score [1] |
Seasonal Cycle Score [1] |
Spatial Distribution Score [1] |
Overall Score [1] |
|||
|---|---|---|---|---|---|---|---|---|---|---|---|---|---|---|---|---|
| Benchmark | [-] | 0.826 | ||||||||||||||
| 271 | [-] | 0.0633 | 0.0629 | 0.826 | 0.0675 | -0.759 | 2.10 | 2.51 | 0.604 | 0.276 | 0.596 | 0.0249 | 0.355 | |||
| 330 | [-] | 0.0819 | 0.0820 | 0.826 | 0.0816 | -0.740 | 2.06 | 2.40 | 0.608 | 0.283 | 0.613 | 0.0260 | 0.363 | |||
| CMIP6_001 | [-] | 0.0351 | 0.0328 | 0.826 | 0.0583 | 0.429 | -0.789 | 2.54 | 2.39 | 0.594 | 0.202 | 0.609 | 0.0417 | 0.330 |
Download Data |
Period Mean (original grids) [W m-2] |
Model Period Mean (intersection) [W m-2] |
Benchmark Period Mean (intersection) [W m-2] |
Model Period Mean (complement) [W m-2] |
Benchmark Period Mean (complement) [W m-2] |
Bias [W m-2] |
RMSE [W m-2] |
Phase Shift [months] |
Bias Score [1] |
RMSE Score [1] |
Seasonal Cycle Score [1] |
Spatial Distribution Score [1] |
Overall Score [1] |
|||
|---|---|---|---|---|---|---|---|---|---|---|---|---|---|---|---|---|
| Benchmark | [-] | 4.49 | ||||||||||||||
| 271 | [-] | 0.145 | 0.143 | 4.49 | 0.163 | -4.35 | 9.13 | 0.128 | 0.625 | 0.427 | 0.991 | 0.0401 | 0.502 | |||
| 330 | [-] | 0.144 | 0.164 | 4.49 | 0.0486 | -4.33 | 8.82 | 0.140 | 0.626 | 0.439 | 0.990 | 0.0488 | 0.509 | |||
| CMIP6_001 | [-] | 0.202 | 0.184 | 4.49 | 0.282 | -4.31 | 9.04 | 0.390 | 0.629 | 0.422 | 0.972 | 0.0714 | 0.503 |
Download Data |
Period Mean (original grids) [W m-2] |
Model Period Mean (intersection) [W m-2] |
Benchmark Period Mean (intersection) [W m-2] |
Model Period Mean (complement) [W m-2] |
Benchmark Period Mean (complement) [W m-2] |
Bias [W m-2] |
RMSE [W m-2] |
Phase Shift [months] |
Bias Score [1] |
RMSE Score [1] |
Seasonal Cycle Score [1] |
Spatial Distribution Score [1] |
Overall Score [1] |
|||
|---|---|---|---|---|---|---|---|---|---|---|---|---|---|---|---|---|
| Benchmark | [-] | -0.592 | ||||||||||||||
| 271 | [-] | 0.0230 | 0.00819 | -0.592 | 0.0431 | 0.604 | 0.928 | 1.76 | 0.299 | 0.438 | 0.754 | 0.00549 | 0.387 | |||
| 330 | [-] | 0.0341 | 0.0227 | -0.592 | 0.0495 | 0.618 | 0.898 | 1.86 | 0.296 | 0.458 | 0.741 | 0.00248 | 0.391 | |||
| CMIP6_001 | [-] | 0.0242 | 0.00825 | -0.592 | 0.0471 | -1.24 | 0.604 | 0.864 | 1.92 | 0.295 | 0.462 | 0.729 | 0.00421 | 0.391 |
Download Data |
Period Mean (original grids) [W m-2] |
Model Period Mean (intersection) [W m-2] |
Benchmark Period Mean (intersection) [W m-2] |
Model Period Mean (complement) [W m-2] |
Benchmark Period Mean (complement) [W m-2] |
Bias [W m-2] |
RMSE [W m-2] |
Phase Shift [months] |
Bias Score [1] |
RMSE Score [1] |
Seasonal Cycle Score [1] |
Spatial Distribution Score [1] |
Overall Score [1] |
|||
|---|---|---|---|---|---|---|---|---|---|---|---|---|---|---|---|---|
| Benchmark | [-] | 3.47 | ||||||||||||||
| 271 | [-] | 0.196 | 0.191 | 3.47 | 0.255 | -3.28 | 8.77 | 0.359 | 0.664 | 0.368 | 0.974 | 0.0639 | 0.488 | |||
| 330 | [-] | 0.134 | 0.130 | 3.47 | 0.157 | -3.34 | 8.76 | 0.307 | 0.659 | 0.368 | 0.978 | 0.0508 | 0.484 | |||
| CMIP6_001 | [-] | 0.309 | 0.313 | 3.47 | 0.247 | -3.16 | 7.41 | 0.493 | 0.676 | 0.433 | 0.964 | 0.0544 | 0.512 |
Download Data |
Period Mean (original grids) [W m-2] |
Model Period Mean (intersection) [W m-2] |
Benchmark Period Mean (intersection) [W m-2] |
Model Period Mean (complement) [W m-2] |
Benchmark Period Mean (complement) [W m-2] |
Bias [W m-2] |
RMSE [W m-2] |
Phase Shift [months] |
Bias Score [1] |
RMSE Score [1] |
Seasonal Cycle Score [1] |
Spatial Distribution Score [1] |
Overall Score [1] |
|||
|---|---|---|---|---|---|---|---|---|---|---|---|---|---|---|---|---|
| Benchmark | [-] | 2.09 | ||||||||||||||
| 271 | [-] | 0.198 | 0.197 | 2.09 | 0.200 | -1.90 | 6.08 | 1.06 | 0.798 | 0.487 | 0.886 | 0.00324 | 0.532 | |||
| 330 | [-] | 0.150 | 0.149 | 2.09 | 0.164 | -1.95 | 6.44 | 1.05 | 0.796 | 0.456 | 0.892 | 0.00441 | 0.521 | |||
| CMIP6_001 | [-] | 0.180 | 0.176 | 2.09 | 0.231 | -0.0567 | -1.92 | 6.29 | 1.13 | 0.797 | 0.465 | 0.869 | 0.0115 | 0.521 |
Download Data |
Period Mean (original grids) [W m-2] |
Model Period Mean (intersection) [W m-2] |
Benchmark Period Mean (intersection) [W m-2] |
Model Period Mean (complement) [W m-2] |
Benchmark Period Mean (complement) [W m-2] |
Bias [W m-2] |
RMSE [W m-2] |
Phase Shift [months] |
Bias Score [1] |
RMSE Score [1] |
Seasonal Cycle Score [1] |
Spatial Distribution Score [1] |
Overall Score [1] |
|||
|---|---|---|---|---|---|---|---|---|---|---|---|---|---|---|---|---|
| Benchmark | [-] | 0.215 | ||||||||||||||
| 271 | [-] | 0.0150 | 0.0174 | 0.215 | -0.00964 | -0.190 | 3.00 | 0.723 | 0.791 | 0.324 | 0.920 | 0.0300 | 0.478 | |||
| 330 | [-] | 0.0374 | 0.0360 | 0.215 | 0.0342 | -0.171 | 3.00 | 0.712 | 0.780 | 0.334 | 0.917 | 0.0151 | 0.476 | |||
| CMIP6_001 | [-] | -0.0191 | -0.0244 | 0.215 | 0.00627 | -0.610 | -0.230 | 3.02 | 0.857 | 0.800 | 0.320 | 0.919 | 0.0351 | 0.479 |
Download Data |
Period Mean (original grids) [W m-2] |
Model Period Mean (intersection) [W m-2] |
Benchmark Period Mean (intersection) [W m-2] |
Model Period Mean (complement) [W m-2] |
Benchmark Period Mean (complement) [W m-2] |
Bias [W m-2] |
RMSE [W m-2] |
Phase Shift [months] |
Bias Score [1] |
RMSE Score [1] |
Seasonal Cycle Score [1] |
Spatial Distribution Score [1] |
Overall Score [1] |
|||
|---|---|---|---|---|---|---|---|---|---|---|---|---|---|---|---|---|
| Benchmark | [-] | 4.41 | ||||||||||||||
| 271 | [-] | 0.288 | 0.309 | 4.41 | 0.181 | -4.10 | 10.4 | 0.265 | 0.611 | 0.322 | 0.982 | 0.113 | 0.470 | |||
| 330 | [-] | 0.118 | 0.113 | 4.41 | 0.140 | -4.29 | 11.0 | 0.273 | 0.598 | 0.301 | 0.981 | 0.0843 | 0.453 | |||
| CMIP6_001 | [-] | 0.230 | 0.219 | 4.41 | 0.285 | -0.935 | -4.19 | 9.54 | 0.301 | 0.606 | 0.361 | 0.979 | 0.0502 | 0.471 |
Download Data |
Period Mean (original grids) [W m-2] |
Model Period Mean (intersection) [W m-2] |
Benchmark Period Mean (intersection) [W m-2] |
Model Period Mean (complement) [W m-2] |
Benchmark Period Mean (complement) [W m-2] |
Bias [W m-2] |
RMSE [W m-2] |
Phase Shift [months] |
Bias Score [1] |
RMSE Score [1] |
Seasonal Cycle Score [1] |
Spatial Distribution Score [1] |
Overall Score [1] |
|||
|---|---|---|---|---|---|---|---|---|---|---|---|---|---|---|---|---|
| Benchmark | [-] | 0.0616 | ||||||||||||||
| 271 | [-] | 0.0382 | 0.0401 | 0.0616 | 0.0235 | -0.0207 | 2.59 | 0.641 | 0.930 | 0.337 | 0.954 | 0.0600 | 0.524 | |||
| 330 | [-] | 0.0599 | 0.0623 | 0.0616 | 0.0419 | 0.00167 | 2.55 | 0.548 | 0.924 | 0.344 | 0.958 | 0.0622 | 0.527 | |||
| CMIP6_001 | [-] | 0.0648 | 0.0717 | 0.0621 | 0.00864 | -0.375 | 0.00918 | 3.13 | 0.867 | 0.936 | 0.272 | 0.921 | 0.0954 | 0.499 |
Download Data |
Period Mean (original grids) [W m-2] |
Model Period Mean (intersection) [W m-2] |
Benchmark Period Mean (intersection) [W m-2] |
Model Period Mean (complement) [W m-2] |
Benchmark Period Mean (complement) [W m-2] |
Bias [W m-2] |
RMSE [W m-2] |
Phase Shift [months] |
Bias Score [1] |
RMSE Score [1] |
Seasonal Cycle Score [1] |
Spatial Distribution Score [1] |
Overall Score [1] |
|||
|---|---|---|---|---|---|---|---|---|---|---|---|---|---|---|---|---|
| Benchmark | [-] | -0.454 | ||||||||||||||
| 271 | [-] | 0.149 | 0.155 | -0.454 | 0.124 | 0.607 | 3.37 | 0.717 | 0.831 | 0.530 | 0.943 | 0.0231 | 0.571 | |||
| 330 | [-] | 0.0676 | 0.0686 | -0.454 | 0.0593 | 0.522 | 3.22 | 0.997 | 0.841 | 0.540 | 0.915 | 0.0268 | 0.573 | |||
| CMIP6_001 | [-] | 0.0838 | 0.0930 | -0.454 | 0.0406 | -1.73 | 0.545 | 3.25 | 0.824 | 0.839 | 0.534 | 0.935 | 0.0733 | 0.583 |
Download Data |
Period Mean (original grids) [W m-2] |
Model Period Mean (intersection) [W m-2] |
Benchmark Period Mean (intersection) [W m-2] |
Model Period Mean (complement) [W m-2] |
Benchmark Period Mean (complement) [W m-2] |
Bias [W m-2] |
RMSE [W m-2] |
Phase Shift [months] |
Bias Score [1] |
RMSE Score [1] |
Seasonal Cycle Score [1] |
Spatial Distribution Score [1] |
Overall Score [1] |
|||
|---|---|---|---|---|---|---|---|---|---|---|---|---|---|---|---|---|
| Benchmark | [-] | 1.08 | ||||||||||||||
| 271 | [-] | 0.135 | 0.148 | 1.08 | 0.0842 | -0.934 | 4.27 | 1.08 | 0.732 | 0.365 | 0.864 | 0.0166 | 0.468 | |||
| 330 | [-] | 0.109 | 0.117 | 1.08 | 0.0782 | -0.964 | 4.27 | 1.09 | 0.729 | 0.369 | 0.861 | 0.0138 | 0.468 | |||
| CMIP6_001 | [-] | 0.137 | 0.142 | 1.08 | 0.116 | -0.178 | -0.941 | 4.27 | 1.16 | 0.733 | 0.347 | 0.854 | 0.0223 | 0.461 |
Download Data |
Period Mean (original grids) [W m-2] |
Model Period Mean (intersection) [W m-2] |
Benchmark Period Mean (intersection) [W m-2] |
Model Period Mean (complement) [W m-2] |
Benchmark Period Mean (complement) [W m-2] |
Bias [W m-2] |
RMSE [W m-2] |
Phase Shift [months] |
Bias Score [1] |
RMSE Score [1] |
Seasonal Cycle Score [1] |
Spatial Distribution Score [1] |
Overall Score [1] |
|||
|---|---|---|---|---|---|---|---|---|---|---|---|---|---|---|---|---|
| Benchmark | [-] | -0.211 | ||||||||||||||
| 271 | [-] | 0.147 | 0.147 | -0.211 | 0.171 | 0.356 | 3.37 | 0.583 | 0.853 | 0.302 | 0.953 | 0.0687 | 0.496 | |||
| 330 | [-] | 0.139 | 0.138 | -0.211 | 0.160 | 0.347 | 3.34 | 0.463 | 0.856 | 0.306 | 0.965 | 0.0776 | 0.502 | |||
| CMIP6_001 | [-] | 0.147 | 0.149 | -0.211 | 0.158 | -0.126 | 0.357 | 3.35 | 0.736 | 0.853 | 0.305 | 0.942 | 0.0747 | 0.496 |
Download Data |
Period Mean (original grids) [W m-2] |
Model Period Mean (intersection) [W m-2] |
Benchmark Period Mean (intersection) [W m-2] |
Model Period Mean (complement) [W m-2] |
Benchmark Period Mean (complement) [W m-2] |
Bias [W m-2] |
RMSE [W m-2] |
Phase Shift [months] |
Bias Score [1] |
RMSE Score [1] |
Seasonal Cycle Score [1] |
Spatial Distribution Score [1] |
Overall Score [1] |
|||
|---|---|---|---|---|---|---|---|---|---|---|---|---|---|---|---|---|
| Benchmark | [-] | 3.22 | ||||||||||||||
| 271 | [-] | 0.204 | 0.215 | 3.22 | 0.177 | -3.02 | 9.82 | 0.303 | 0.662 | 0.316 | 0.971 | 0.0641 | 0.466 | |||
| 330 | [-] | 0.125 | 0.0968 | 3.22 | 0.171 | -3.13 | 10.2 | 0.450 | 0.653 | 0.301 | 0.962 | 0.0908 | 0.461 | |||
| CMIP6_001 | [-] | 0.324 | 0.297 | 3.22 | 0.377 | -1.28 | -2.93 | 8.96 | 0.534 | 0.668 | 0.344 | 0.956 | 0.0803 | 0.478 |
Download Data |
Period Mean (original grids) [W m-2] |
Model Period Mean (intersection) [W m-2] |
Benchmark Period Mean (intersection) [W m-2] |
Model Period Mean (complement) [W m-2] |
Benchmark Period Mean (complement) [W m-2] |
Bias [W m-2] |
RMSE [W m-2] |
Phase Shift [months] |
Bias Score [1] |
RMSE Score [1] |
Seasonal Cycle Score [1] |
Spatial Distribution Score [1] |
Overall Score [1] |
|||
|---|---|---|---|---|---|---|---|---|---|---|---|---|---|---|---|---|
| Benchmark | [-] | 0.267 | ||||||||||||||
| 271 | [-] | 0.0994 | 0.104 | 0.267 | 0.0718 | -0.168 | 2.04 | 0.932 | 0.778 | 0.317 | 0.874 | 0.0972 | 0.477 | |||
| 330 | [-] | 0.0874 | 0.0872 | 0.267 | 0.0771 | -0.184 | 1.96 | 0.860 | 0.778 | 0.336 | 0.880 | 0.0772 | 0.481 | |||
| CMIP6_001 | [-] | 0.123 | 0.127 | 0.267 | 0.102 | -0.0700 | -0.143 | 2.58 | 0.917 | 0.782 | 0.240 | 0.879 | 0.150 | 0.458 |
Download Data |
Period Mean (original grids) [W m-2] |
Model Period Mean (intersection) [W m-2] |
Benchmark Period Mean (intersection) [W m-2] |
Model Period Mean (complement) [W m-2] |
Benchmark Period Mean (complement) [W m-2] |
Bias [W m-2] |
RMSE [W m-2] |
Phase Shift [months] |
Bias Score [1] |
RMSE Score [1] |
Seasonal Cycle Score [1] |
Spatial Distribution Score [1] |
Overall Score [1] |
|||
|---|---|---|---|---|---|---|---|---|---|---|---|---|---|---|---|---|
| Benchmark | [-] | -0.474 | ||||||||||||||
| 271 | [-] | 0.316 | 0.336 | -0.474 | 0.171 | 0.812 | 3.83 | 0.979 | 0.853 | 0.545 | 0.902 | 0.116 | 0.592 | |||
| 330 | [-] | 0.174 | 0.195 | -0.474 | 0.0227 | 0.672 | 3.64 | 1.06 | 0.869 | 0.558 | 0.901 | 0.185 | 0.614 | |||
| CMIP6_001 | [-] | 0.227 | 0.262 | -0.474 | -0.0192 | 0.732 | 4.74 | 0.941 | 0.866 | 0.458 | 0.896 | 0.348 | 0.605 |
Download Data |
Period Mean (original grids) [W m-2] |
Model Period Mean (intersection) [W m-2] |
Benchmark Period Mean (intersection) [W m-2] |
Model Period Mean (complement) [W m-2] |
Benchmark Period Mean (complement) [W m-2] |
Bias [W m-2] |
RMSE [W m-2] |
Phase Shift [months] |
Bias Score [1] |
RMSE Score [1] |
Seasonal Cycle Score [1] |
Spatial Distribution Score [1] |
Overall Score [1] |
|||
|---|---|---|---|---|---|---|---|---|---|---|---|---|---|---|---|---|
| Benchmark | [-] | 2.48 | ||||||||||||||
| 271 | [-] | 0.363 | 0.369 | 2.48 | 0.334 | -2.10 | 6.65 | 0.702 | 0.734 | 0.420 | 0.940 | 0.0662 | 0.516 | |||
| 330 | [-] | 0.275 | 0.284 | 2.48 | 0.250 | -2.19 | 5.48 | 0.783 | 0.726 | 0.507 | 0.932 | 0.0875 | 0.552 | |||
| CMIP6_001 | [-] | 0.304 | 0.306 | 2.48 | 0.283 | -2.16 | 5.78 | 0.718 | 0.729 | 0.481 | 0.941 | 0.0675 | 0.540 |
Download Data |
Period Mean (original grids) [W m-2] |
Model Period Mean (intersection) [W m-2] |
Benchmark Period Mean (intersection) [W m-2] |
Model Period Mean (complement) [W m-2] |
Benchmark Period Mean (complement) [W m-2] |
Bias [W m-2] |
RMSE [W m-2] |
Phase Shift [months] |
Bias Score [1] |
RMSE Score [1] |
Seasonal Cycle Score [1] |
Spatial Distribution Score [1] |
Overall Score [1] |
|||
|---|---|---|---|---|---|---|---|---|---|---|---|---|---|---|---|---|
| Benchmark | [-] | 0.596 | ||||||||||||||
| 271 | [-] | 0.399 | 0.404 | 0.596 | 0.242 | -0.188 | 5.13 | 0.980 | 0.880 | 0.339 | 0.911 | 0.0835 | 0.511 | |||
| 330 | [-] | 0.343 | 0.345 | 0.596 | 0.260 | -0.247 | 4.81 | 1.13 | 0.877 | 0.362 | 0.893 | 0.0439 | 0.508 | |||
| CMIP6_001 | [-] | 0.295 | 0.299 | 0.597 | 0.169 | -0.557 | -0.296 | 5.40 | 1.17 | 0.884 | 0.312 | 0.881 | 0.109 | 0.500 |
Download Data |
Period Mean (original grids) [W m-2] |
Model Period Mean (intersection) [W m-2] |
Benchmark Period Mean (intersection) [W m-2] |
Model Period Mean (complement) [W m-2] |
Benchmark Period Mean (complement) [W m-2] |
Bias [W m-2] |
RMSE [W m-2] |
Phase Shift [months] |
Bias Score [1] |
RMSE Score [1] |
Seasonal Cycle Score [1] |
Spatial Distribution Score [1] |
Overall Score [1] |
|||
|---|---|---|---|---|---|---|---|---|---|---|---|---|---|---|---|---|
| Benchmark | [-] | 0.491 | ||||||||||||||
| 271 | [-] | 0.0585 | 0.0565 | 0.491 | 0.0848 | -0.428 | 1.36 | 1.96 | 0.467 | 0.312 | 0.701 | 0.00765 | 0.360 | |||
| 330 | [-] | 0.0429 | 0.0406 | 0.491 | 0.0741 | -0.444 | 1.34 | 2.47 | 0.458 | 0.321 | 0.616 | 0.00276 | 0.344 | |||
| CMIP6_001 | [-] | 0.0111 | 0.00859 | 0.491 | 0.0592 | 0.579 | -0.475 | 1.45 | 2.09 | 0.470 | 0.266 | 0.671 | 0.0106 | 0.337 |
Download Data |
Period Mean (original grids) [W m-2] |
Model Period Mean (intersection) [W m-2] |
Benchmark Period Mean (intersection) [W m-2] |
Model Period Mean (complement) [W m-2] |
Benchmark Period Mean (complement) [W m-2] |
Bias [W m-2] |
RMSE [W m-2] |
Phase Shift [months] |
Bias Score [1] |
RMSE Score [1] |
Seasonal Cycle Score [1] |
Spatial Distribution Score [1] |
Overall Score [1] |
|||
|---|---|---|---|---|---|---|---|---|---|---|---|---|---|---|---|---|
| Benchmark | [-] | 0.544 | ||||||||||||||
| 271 | [-] | 0.0809 | 0.0811 | 0.544 | 0.0639 | -0.461 | 2.04 | 2.08 | 0.736 | 0.354 | 0.689 | 0.0292 | 0.432 | |||
| 330 | [-] | 0.0566 | 0.0566 | 0.544 | 0.0574 | -0.485 | 2.11 | 2.14 | 0.723 | 0.338 | 0.678 | 0.0128 | 0.418 | |||
| CMIP6_001 | [-] | 0.121 | 0.121 | 0.544 | 0.103 | -0.422 | 2.38 | 2.11 | 0.736 | 0.289 | 0.694 | 0.0294 | 0.408 |
Download Data |
Period Mean (original grids) [W m-2] |
Model Period Mean (intersection) [W m-2] |
Benchmark Period Mean (intersection) [W m-2] |
Model Period Mean (complement) [W m-2] |
Benchmark Period Mean (complement) [W m-2] |
Bias [W m-2] |
RMSE [W m-2] |
Phase Shift [months] |
Bias Score [1] |
RMSE Score [1] |
Seasonal Cycle Score [1] |
Spatial Distribution Score [1] |
Overall Score [1] |
|||
|---|---|---|---|---|---|---|---|---|---|---|---|---|---|---|---|---|
| Benchmark | [-] | 1.15 | ||||||||||||||
| 271 | [-] | 0.0702 | 0.0752 | 1.15 | 0.0576 | -1.09 | 3.19 | 2.08 | 0.617 | 0.413 | 0.687 | 0.00365 | 0.426 | |||
| 330 | [-] | 0.108 | 0.115 | 1.15 | 0.0872 | -1.05 | 3.08 | 1.88 | 0.612 | 0.436 | 0.726 | 0.00521 | 0.443 | |||
| CMIP6_001 | [-] | 0.0870 | 0.0876 | 1.15 | 0.0848 | -0.660 | -1.08 | 3.32 | 1.91 | 0.619 | 0.396 | 0.720 | 0.00567 | 0.427 |
Temporally integrated period mean