Mean State
Download Data |
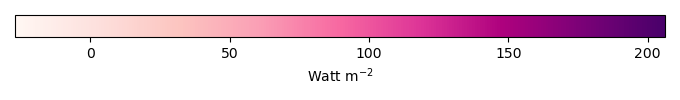
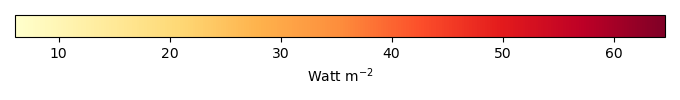
Period Mean (original grids) [Watt m-2] |
Model Period Mean (intersection) [Watt m-2] |
Benchmark Period Mean (intersection) [Watt m-2] |
Model Period Mean (complement) [Watt m-2] |
Benchmark Period Mean (complement) [Watt m-2] |
Bias [Watt m-2] |
RMSE [Watt m-2] |
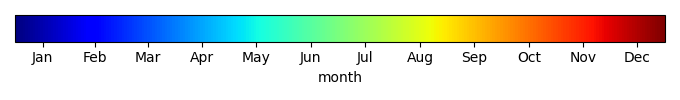
Phase Shift [months] |
Bias Score [1] |
RMSE Score [1] |
Seasonal Cycle Score [1] |
Spatial Distribution Score [1] |
Overall Score [1] |
|||
|---|---|---|---|---|---|---|---|---|---|---|---|---|---|---|---|---|
| Benchmark | [-] | 122. | ||||||||||||||
| 271 | [-] | 114. | 114. | 121. | 167. | -8.56 | 20.6 | 1.23 | 0.331 | 0.644 | 0.839 | 0.562 | 0.604 | |||
| 330 | [-] | 111. | 111. | 121. | 167. | -11.4 | 23.7 | 1.29 | 0.192 | 0.612 | 0.827 | 0.564 | 0.561 | |||
| CMIP6_001 | [-] | 123. | 122. | 120. | 164. | 2.66 | 18.9 | 2.10 | 0.505 | 0.554 | 0.677 | 0.519 | 0.562 |
Download Data |
Period Mean (original grids) [Watt m-2] |
Model Period Mean (intersection) [Watt m-2] |
Benchmark Period Mean (intersection) [Watt m-2] |
Model Period Mean (complement) [Watt m-2] |
Benchmark Period Mean (complement) [Watt m-2] |
Bias [Watt m-2] |
RMSE [Watt m-2] |
Phase Shift [months] |
Bias Score [1] |
RMSE Score [1] |
Seasonal Cycle Score [1] |
Spatial Distribution Score [1] |
Overall Score [1] |
|||
|---|---|---|---|---|---|---|---|---|---|---|---|---|---|---|---|---|
| Benchmark | [-] | 102. | ||||||||||||||
| 271 | [-] | 106. | 106. | 102. | 158. | 4.52 | 20.4 | 1.48 | 0.364 | 0.533 | 0.787 | 0.656 | 0.575 | |||
| 330 | [-] | 105. | 105. | 102. | 158. | 3.84 | 21.4 | 1.46 | 0.359 | 0.482 | 0.792 | 0.662 | 0.555 | |||
| CMIP6_001 | [-] | 104. | 103. | 101. | 165. | 2.99 | 16.4 | 1.33 | 0.488 | 0.551 | 0.810 | 0.820 | 0.644 |
Download Data |
Period Mean (original grids) [Watt m-2] |
Model Period Mean (intersection) [Watt m-2] |
Benchmark Period Mean (intersection) [Watt m-2] |
Model Period Mean (complement) [Watt m-2] |
Benchmark Period Mean (complement) [Watt m-2] |
Bias [Watt m-2] |
RMSE [Watt m-2] |
Phase Shift [months] |
Bias Score [1] |
RMSE Score [1] |
Seasonal Cycle Score [1] |
Spatial Distribution Score [1] |
Overall Score [1] |
|||
|---|---|---|---|---|---|---|---|---|---|---|---|---|---|---|---|---|
| Benchmark | [-] | 112. | ||||||||||||||
| 271 | [-] | 114. | 114. | 112. | 162. | 2.88 | 18.2 | 1.66 | 0.501 | 0.652 | 0.749 | 0.615 | 0.634 | |||
| 330 | [-] | 113. | 112. | 112. | 162. | 1.71 | 18.4 | 1.75 | 0.514 | 0.630 | 0.741 | 0.620 | 0.627 | |||
| CMIP6_001 | [-] | 118. | 118. | 110. | 159. | 8.63 | 20.0 | 2.01 | 0.384 | 0.570 | 0.686 | 0.871 | 0.616 |
Download Data |
Period Mean (original grids) [Watt m-2] |
Model Period Mean (intersection) [Watt m-2] |
Benchmark Period Mean (intersection) [Watt m-2] |
Model Period Mean (complement) [Watt m-2] |
Benchmark Period Mean (complement) [Watt m-2] |
Bias [Watt m-2] |
RMSE [Watt m-2] |
Phase Shift [months] |
Bias Score [1] |
RMSE Score [1] |
Seasonal Cycle Score [1] |
Spatial Distribution Score [1] |
Overall Score [1] |
|||
|---|---|---|---|---|---|---|---|---|---|---|---|---|---|---|---|---|
| Benchmark | [-] | 43.3 | ||||||||||||||
| 271 | [-] | 23.9 | 24.0 | 43.3 | 44.7 | -19.6 | 22.2 | 0.242 | 0.0934 | 0.467 | 0.984 | 0.909 | 0.584 | |||
| 330 | [-] | 23.9 | 23.9 | 43.3 | 44.7 | -19.6 | 22.0 | 0.261 | 0.0956 | 0.487 | 0.983 | 0.905 | 0.591 | |||
| CMIP6_001 | [-] | 25.3 | 25.3 | 43.2 | 44.3 | -18.3 | 22.2 | 0.269 | 0.137 | 0.436 | 0.982 | 0.909 | 0.580 |
Download Data |
Period Mean (original grids) [Watt m-2] |
Model Period Mean (intersection) [Watt m-2] |
Benchmark Period Mean (intersection) [Watt m-2] |
Model Period Mean (complement) [Watt m-2] |
Benchmark Period Mean (complement) [Watt m-2] |
Bias [Watt m-2] |
RMSE [Watt m-2] |
Phase Shift [months] |
Bias Score [1] |
RMSE Score [1] |
Seasonal Cycle Score [1] |
Spatial Distribution Score [1] |
Overall Score [1] |
|||
|---|---|---|---|---|---|---|---|---|---|---|---|---|---|---|---|---|
| Benchmark | [-] | 144. | ||||||||||||||
| 271 | [-] | 123. | 123. | 143. | 165. | -15.4 | 20.7 | 1.47 | 0.494 | 0.677 | 0.799 | 0.618 | 0.653 | |||
| 330 | [-] | 118. | 118. | 143. | 165. | -20.4 | 24.2 | 1.44 | 0.367 | 0.673 | 0.810 | 0.643 | 0.633 | |||
| CMIP6_001 | [-] | 130. | 130. | 140. | 160. | -4.75 | 16.7 | 1.55 | 0.576 | 0.626 | 0.794 | 0.805 | 0.685 |
Download Data |
Period Mean (original grids) [Watt m-2] |
Model Period Mean (intersection) [Watt m-2] |
Benchmark Period Mean (intersection) [Watt m-2] |
Model Period Mean (complement) [Watt m-2] |
Benchmark Period Mean (complement) [Watt m-2] |
Bias [Watt m-2] |
RMSE [Watt m-2] |
Phase Shift [months] |
Bias Score [1] |
RMSE Score [1] |
Seasonal Cycle Score [1] |
Spatial Distribution Score [1] |
Overall Score [1] |
|||
|---|---|---|---|---|---|---|---|---|---|---|---|---|---|---|---|---|
| Benchmark | [-] | 62.5 | ||||||||||||||
| 271 | [-] | 42.7 | 42.6 | 62.5 | 75.9 | -19.3 | 24.6 | 0.404 | 0.0678 | 0.380 | 0.972 | 0.965 | 0.553 | |||
| 330 | [-] | 44.4 | 44.3 | 62.5 | 75.9 | -17.7 | 21.5 | 0.151 | 0.0880 | 0.505 | 0.990 | 0.992 | 0.616 | |||
| CMIP6_001 | [-] | 48.3 | 48.3 | 62.3 | 75.7 | -13.7 | 19.9 | 0.273 | 0.228 | 0.422 | 0.982 | 0.943 | 0.599 |
Download Data |
Period Mean (original grids) [Watt m-2] |
Model Period Mean (intersection) [Watt m-2] |
Benchmark Period Mean (intersection) [Watt m-2] |
Model Period Mean (complement) [Watt m-2] |
Benchmark Period Mean (complement) [Watt m-2] |
Bias [Watt m-2] |
RMSE [Watt m-2] |
Phase Shift [months] |
Bias Score [1] |
RMSE Score [1] |
Seasonal Cycle Score [1] |
Spatial Distribution Score [1] |
Overall Score [1] |
|||
|---|---|---|---|---|---|---|---|---|---|---|---|---|---|---|---|---|
| Benchmark | [-] | 72.7 | ||||||||||||||
| 271 | [-] | 66.7 | 66.5 | 72.6 | 112. | -4.88 | 22.6 | 0.803 | 0.426 | 0.220 | 0.922 | 0.986 | 0.555 | |||
| 330 | [-] | 66.3 | 66.1 | 72.6 | 112. | -5.29 | 22.7 | 0.694 | 0.430 | 0.223 | 0.935 | 0.981 | 0.558 | |||
| CMIP6_001 | [-] | 70.4 | 70.2 | 72.2 | 105. | -0.786 | 22.5 | 0.524 | 0.449 | 0.207 | 0.958 | 0.985 | 0.561 |
Download Data |
Period Mean (original grids) [Watt m-2] |
Model Period Mean (intersection) [Watt m-2] |
Benchmark Period Mean (intersection) [Watt m-2] |
Model Period Mean (complement) [Watt m-2] |
Benchmark Period Mean (complement) [Watt m-2] |
Bias [Watt m-2] |
RMSE [Watt m-2] |
Phase Shift [months] |
Bias Score [1] |
RMSE Score [1] |
Seasonal Cycle Score [1] |
Spatial Distribution Score [1] |
Overall Score [1] |
|||
|---|---|---|---|---|---|---|---|---|---|---|---|---|---|---|---|---|
| Benchmark | [-] | 109. | ||||||||||||||
| 271 | [-] | 96.6 | 96.6 | 108. | 163. | -7.08 | 19.7 | 0.763 | 0.534 | 0.527 | 0.913 | 0.822 | 0.665 | |||
| 330 | [-] | 94.4 | 94.4 | 108. | 163. | -9.62 | 21.0 | 0.801 | 0.512 | 0.512 | 0.906 | 0.761 | 0.641 | |||
| CMIP6_001 | [-] | 103. | 103. | 105. | 157. | 2.30 | 19.8 | 0.710 | 0.463 | 0.464 | 0.936 | 0.961 | 0.657 |
Download Data |
Period Mean (original grids) [Watt m-2] |
Model Period Mean (intersection) [Watt m-2] |
Benchmark Period Mean (intersection) [Watt m-2] |
Model Period Mean (complement) [Watt m-2] |
Benchmark Period Mean (complement) [Watt m-2] |
Bias [Watt m-2] |
RMSE [Watt m-2] |
Phase Shift [months] |
Bias Score [1] |
RMSE Score [1] |
Seasonal Cycle Score [1] |
Spatial Distribution Score [1] |
Overall Score [1] |
|||
|---|---|---|---|---|---|---|---|---|---|---|---|---|---|---|---|---|
| Benchmark | [-] | 41.8 | ||||||||||||||
| 271 | [-] | 17.4 | 17.7 | 41.8 | 45.2 | -25.2 | 25.0 | 0.289 | 0.0224 | 0.383 | 0.981 | 0.963 | 0.546 | |||
| 330 | [-] | 18.2 | 18.5 | 41.8 | 45.2 | -24.5 | 24.0 | 0.198 | 0.0264 | 0.419 | 0.987 | 0.960 | 0.562 | |||
| CMIP6_001 | [-] | 18.0 | 18.3 | 41.9 | 41.5 | -24.3 | 26.9 | 0.352 | 0.0367 | 0.290 | 0.977 | 0.955 | 0.510 |
Download Data |
Period Mean (original grids) [Watt m-2] |
Model Period Mean (intersection) [Watt m-2] |
Benchmark Period Mean (intersection) [Watt m-2] |
Model Period Mean (complement) [Watt m-2] |
Benchmark Period Mean (complement) [Watt m-2] |
Bias [Watt m-2] |
RMSE [Watt m-2] |
Phase Shift [months] |
Bias Score [1] |
RMSE Score [1] |
Seasonal Cycle Score [1] |
Spatial Distribution Score [1] |
Overall Score [1] |
|||
|---|---|---|---|---|---|---|---|---|---|---|---|---|---|---|---|---|
| Benchmark | [-] | 96.5 | ||||||||||||||
| 271 | [-] | 107. | 107. | 95.5 | 153. | 10.7 | 27.2 | 0.536 | 0.196 | 0.503 | 0.957 | 0.782 | 0.588 | |||
| 330 | [-] | 106. | 106. | 95.5 | 153. | 10.1 | 27.6 | 0.521 | 0.201 | 0.498 | 0.955 | 0.765 | 0.583 | |||
| CMIP6_001 | [-] | 105. | 105. | 93.2 | 138. | 12.4 | 24.6 | 0.515 | 0.222 | 0.500 | 0.962 | 0.794 | 0.595 |
Download Data |
Period Mean (original grids) [Watt m-2] |
Model Period Mean (intersection) [Watt m-2] |
Benchmark Period Mean (intersection) [Watt m-2] |
Model Period Mean (complement) [Watt m-2] |
Benchmark Period Mean (complement) [Watt m-2] |
Bias [Watt m-2] |
RMSE [Watt m-2] |
Phase Shift [months] |
Bias Score [1] |
RMSE Score [1] |
Seasonal Cycle Score [1] |
Spatial Distribution Score [1] |
Overall Score [1] |
|||
|---|---|---|---|---|---|---|---|---|---|---|---|---|---|---|---|---|
| Benchmark | [-] | 64.4 | ||||||||||||||
| 271 | [-] | 56.9 | 56.9 | 64.0 | 92.7 | -5.45 | 15.7 | 0.323 | 0.568 | 0.508 | 0.979 | 0.986 | 0.710 | |||
| 330 | [-] | 57.7 | 57.7 | 64.0 | 92.7 | -4.72 | 15.0 | 0.298 | 0.577 | 0.535 | 0.980 | 0.984 | 0.722 | |||
| CMIP6_001 | [-] | 61.1 | 61.1 | 61.9 | 90.5 | 0.693 | 15.7 | 0.324 | 0.479 | 0.473 | 0.979 | 0.980 | 0.677 |
Download Data |
Period Mean (original grids) [Watt m-2] |
Model Period Mean (intersection) [Watt m-2] |
Benchmark Period Mean (intersection) [Watt m-2] |
Model Period Mean (complement) [Watt m-2] |
Benchmark Period Mean (complement) [Watt m-2] |
Bias [Watt m-2] |
RMSE [Watt m-2] |
Phase Shift [months] |
Bias Score [1] |
RMSE Score [1] |
Seasonal Cycle Score [1] |
Spatial Distribution Score [1] |
Overall Score [1] |
|||
|---|---|---|---|---|---|---|---|---|---|---|---|---|---|---|---|---|
| Benchmark | [-] | 79.1 | ||||||||||||||
| 271 | [-] | 69.6 | 69.5 | 78.5 | 143. | -7.16 | 21.8 | 0.794 | 0.360 | 0.484 | 0.907 | 0.917 | 0.631 | |||
| 330 | [-] | 69.0 | 69.0 | 78.5 | 143. | -7.79 | 21.8 | 0.796 | 0.351 | 0.496 | 0.908 | 0.924 | 0.635 | |||
| CMIP6_001 | [-] | 71.8 | 71.8 | 76.7 | 126. | -3.19 | 21.5 | 0.839 | 0.360 | 0.458 | 0.899 | 0.883 | 0.612 |
Download Data |
Period Mean (original grids) [Watt m-2] |
Model Period Mean (intersection) [Watt m-2] |
Benchmark Period Mean (intersection) [Watt m-2] |
Model Period Mean (complement) [Watt m-2] |
Benchmark Period Mean (complement) [Watt m-2] |
Bias [Watt m-2] |
RMSE [Watt m-2] |
Phase Shift [months] |
Bias Score [1] |
RMSE Score [1] |
Seasonal Cycle Score [1] |
Spatial Distribution Score [1] |
Overall Score [1] |
|||
|---|---|---|---|---|---|---|---|---|---|---|---|---|---|---|---|---|
| Benchmark | [-] | 54.9 | ||||||||||||||
| 271 | [-] | 60.3 | 60.4 | 54.3 | 157. | 8.11 | 26.0 | 1.18 | 0.279 | 0.490 | 0.859 | 0.579 | 0.539 | |||
| 330 | [-] | 60.6 | 60.7 | 54.3 | 157. | 8.44 | 26.2 | 1.12 | 0.271 | 0.485 | 0.872 | 0.582 | 0.539 | |||
| CMIP6_001 | [-] | 64.7 | 64.8 | 51.4 | 144. | 15.0 | 27.7 | 1.29 | 0.203 | 0.446 | 0.848 | 0.759 | 0.540 |
Download Data |
Period Mean (original grids) [Watt m-2] |
Model Period Mean (intersection) [Watt m-2] |
Benchmark Period Mean (intersection) [Watt m-2] |
Model Period Mean (complement) [Watt m-2] |
Benchmark Period Mean (complement) [Watt m-2] |
Bias [Watt m-2] |
RMSE [Watt m-2] |
Phase Shift [months] |
Bias Score [1] |
RMSE Score [1] |
Seasonal Cycle Score [1] |
Spatial Distribution Score [1] |
Overall Score [1] |
|||
|---|---|---|---|---|---|---|---|---|---|---|---|---|---|---|---|---|
| Benchmark | [-] | 44.9 | ||||||||||||||
| 271 | [-] | 23.7 | 23.5 | 44.9 | 44.6 | -22.7 | 24.9 | 0.185 | 0.0468 | 0.424 | 0.988 | 0.931 | 0.563 | |||
| 330 | [-] | 23.8 | 23.7 | 44.9 | 44.6 | -22.7 | 24.4 | 0.145 | 0.0490 | 0.464 | 0.990 | 0.925 | 0.578 | |||
| CMIP6_001 | [-] | 23.6 | 23.6 | 44.8 | 45.6 | -22.4 | 26.7 | 0.262 | 0.0709 | 0.331 | 0.983 | 0.927 | 0.529 |
Download Data |
Period Mean (original grids) [Watt m-2] |
Model Period Mean (intersection) [Watt m-2] |
Benchmark Period Mean (intersection) [Watt m-2] |
Model Period Mean (complement) [Watt m-2] |
Benchmark Period Mean (complement) [Watt m-2] |
Bias [Watt m-2] |
RMSE [Watt m-2] |
Phase Shift [months] |
Bias Score [1] |
RMSE Score [1] |
Seasonal Cycle Score [1] |
Spatial Distribution Score [1] |
Overall Score [1] |
|||
|---|---|---|---|---|---|---|---|---|---|---|---|---|---|---|---|---|
| Benchmark | [-] | 134. | ||||||||||||||
| 271 | [-] | 119. | 119. | 133. | 172. | -9.95 | 22.9 | 1.05 | 0.446 | 0.595 | 0.873 | 0.546 | 0.611 | |||
| 330 | [-] | 117. | 117. | 133. | 172. | -12.4 | 24.0 | 1.04 | 0.422 | 0.595 | 0.866 | 0.496 | 0.595 | |||
| CMIP6_001 | [-] | 122. | 123. | 127. | 169. | -0.434 | 20.3 | 1.11 | 0.405 | 0.561 | 0.870 | 0.841 | 0.647 |
Download Data |
Period Mean (original grids) [Watt m-2] |
Model Period Mean (intersection) [Watt m-2] |
Benchmark Period Mean (intersection) [Watt m-2] |
Model Period Mean (complement) [Watt m-2] |
Benchmark Period Mean (complement) [Watt m-2] |
Bias [Watt m-2] |
RMSE [Watt m-2] |
Phase Shift [months] |
Bias Score [1] |
RMSE Score [1] |
Seasonal Cycle Score [1] |
Spatial Distribution Score [1] |
Overall Score [1] |
|||
|---|---|---|---|---|---|---|---|---|---|---|---|---|---|---|---|---|
| Benchmark | [-] | 99.6 | ||||||||||||||
| 271 | [-] | 87.9 | 88.1 | 99.1 | 142. | -8.83 | 14.8 | 0.485 | 0.472 | 0.532 | 0.965 | 0.998 | 0.699 | |||
| 330 | [-] | 87.5 | 87.7 | 99.1 | 142. | -9.38 | 14.9 | 0.667 | 0.453 | 0.541 | 0.952 | 0.994 | 0.696 | |||
| CMIP6_001 | [-] | 88.7 | 88.9 | 97.8 | 136. | -7.21 | 14.9 | 0.409 | 0.498 | 0.494 | 0.971 | 0.989 | 0.689 |
Download Data |
Period Mean (original grids) [Watt m-2] |
Model Period Mean (intersection) [Watt m-2] |
Benchmark Period Mean (intersection) [Watt m-2] |
Model Period Mean (complement) [Watt m-2] |
Benchmark Period Mean (complement) [Watt m-2] |
Bias [Watt m-2] |
RMSE [Watt m-2] |
Phase Shift [months] |
Bias Score [1] |
RMSE Score [1] |
Seasonal Cycle Score [1] |
Spatial Distribution Score [1] |
Overall Score [1] |
|||
|---|---|---|---|---|---|---|---|---|---|---|---|---|---|---|---|---|
| Benchmark | [-] | 72.2 | ||||||||||||||
| 271 | [-] | 57.2 | 57.4 | 72.2 | 96.6 | -14.1 | 20.6 | 0.224 | 0.197 | 0.386 | 0.984 | 0.996 | 0.590 | |||
| 330 | [-] | 58.2 | 58.3 | 72.2 | 96.6 | -13.4 | 17.8 | 0.502 | 0.206 | 0.538 | 0.967 | 0.998 | 0.649 | |||
| CMIP6_001 | [-] | 61.0 | 61.0 | 72.0 | 77.2 | -10.7 | 17.3 | 0.293 | 0.338 | 0.483 | 0.980 | 0.991 | 0.655 |
Download Data |
Period Mean (original grids) [Watt m-2] |
Model Period Mean (intersection) [Watt m-2] |
Benchmark Period Mean (intersection) [Watt m-2] |
Model Period Mean (complement) [Watt m-2] |
Benchmark Period Mean (complement) [Watt m-2] |
Bias [Watt m-2] |
RMSE [Watt m-2] |
Phase Shift [months] |
Bias Score [1] |
RMSE Score [1] |
Seasonal Cycle Score [1] |
Spatial Distribution Score [1] |
Overall Score [1] |
|||
|---|---|---|---|---|---|---|---|---|---|---|---|---|---|---|---|---|
| Benchmark | [-] | 81.6 | ||||||||||||||
| 271 | [-] | 78.8 | 79.2 | 81.6 | 124. | -1.59 | 18.4 | 0.488 | 0.486 | 0.346 | 0.964 | 0.978 | 0.624 | |||
| 330 | [-] | 79.4 | 79.7 | 81.6 | 124. | -1.08 | 18.3 | 0.472 | 0.504 | 0.348 | 0.965 | 0.972 | 0.627 | |||
| CMIP6_001 | [-] | 77.8 | 78.1 | 81.1 | 116. | -2.25 | 17.7 | 0.562 | 0.426 | 0.409 | 0.959 | 0.977 | 0.636 |
Download Data |
Period Mean (original grids) [Watt m-2] |
Model Period Mean (intersection) [Watt m-2] |
Benchmark Period Mean (intersection) [Watt m-2] |
Model Period Mean (complement) [Watt m-2] |
Benchmark Period Mean (complement) [Watt m-2] |
Bias [Watt m-2] |
RMSE [Watt m-2] |
Phase Shift [months] |
Bias Score [1] |
RMSE Score [1] |
Seasonal Cycle Score [1] |
Spatial Distribution Score [1] |
Overall Score [1] |
|||
|---|---|---|---|---|---|---|---|---|---|---|---|---|---|---|---|---|
| Benchmark | [-] | 132. | ||||||||||||||
| 271 | [-] | 130. | 130. | 132. | 185. | -1.37 | 12.6 | 1.24 | 0.671 | 0.704 | 0.824 | 0.704 | 0.721 | |||
| 330 | [-] | 126. | 126. | 132. | 185. | -5.53 | 13.6 | 1.35 | 0.610 | 0.697 | 0.810 | 0.774 | 0.718 | |||
| CMIP6_001 | [-] | 138. | 138. | 131. | 178. | 7.87 | 15.3 | 1.47 | 0.527 | 0.649 | 0.783 | 0.895 | 0.701 |
Download Data |
Period Mean (original grids) [Watt m-2] |
Model Period Mean (intersection) [Watt m-2] |
Benchmark Period Mean (intersection) [Watt m-2] |
Model Period Mean (complement) [Watt m-2] |
Benchmark Period Mean (complement) [Watt m-2] |
Bias [Watt m-2] |
RMSE [Watt m-2] |
Phase Shift [months] |
Bias Score [1] |
RMSE Score [1] |
Seasonal Cycle Score [1] |
Spatial Distribution Score [1] |
Overall Score [1] |
|||
|---|---|---|---|---|---|---|---|---|---|---|---|---|---|---|---|---|
| Benchmark | [-] | 117. | ||||||||||||||
| 271 | [-] | 117. | 117. | 117. | 149. | 0.616 | 12.4 | 0.892 | 0.637 | 0.646 | 0.890 | 0.997 | 0.763 | |||
| 330 | [-] | 116. | 116. | 117. | 149. | -0.637 | 12.0 | 0.910 | 0.651 | 0.659 | 0.890 | 0.998 | 0.772 | |||
| CMIP6_001 | [-] | 116. | 116. | 117. | 145. | -0.576 | 12.4 | 1.26 | 0.633 | 0.641 | 0.827 | 0.982 | 0.745 |
Download Data |
Period Mean (original grids) [Watt m-2] |
Model Period Mean (intersection) [Watt m-2] |
Benchmark Period Mean (intersection) [Watt m-2] |
Model Period Mean (complement) [Watt m-2] |
Benchmark Period Mean (complement) [Watt m-2] |
Bias [Watt m-2] |
RMSE [Watt m-2] |
Phase Shift [months] |
Bias Score [1] |
RMSE Score [1] |
Seasonal Cycle Score [1] |
Spatial Distribution Score [1] |
Overall Score [1] |
|||
|---|---|---|---|---|---|---|---|---|---|---|---|---|---|---|---|---|
| Benchmark | [-] | 95.7 | ||||||||||||||
| 271 | [-] | 94.2 | 93.5 | 95.0 | 143. | -1.57 | 21.5 | 0.685 | 0.392 | 0.526 | 0.916 | 0.971 | 0.666 | |||
| 330 | [-] | 92.9 | 92.2 | 95.0 | 143. | -2.80 | 21.7 | 0.797 | 0.404 | 0.513 | 0.899 | 0.961 | 0.658 | |||
| CMIP6_001 | [-] | 98.5 | 98.0 | 92.5 | 124. | 4.36 | 21.2 | 0.760 | 0.354 | 0.493 | 0.905 | 0.956 | 0.640 |
Temporally integrated period mean