Mean State
Download Data |
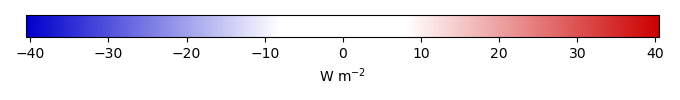
Period Mean (original grids) [W m-2] |
Model Period Mean (intersection) [W m-2] |
Benchmark Period Mean (intersection) [W m-2] |
Model Period Mean (complement) [W m-2] |
Benchmark Period Mean (complement) [W m-2] |
Bias [W m-2] |
RMSE [W m-2] |
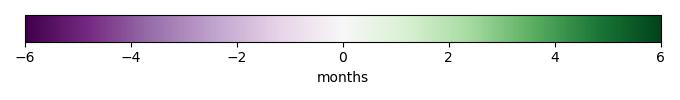
Phase Shift [months] |
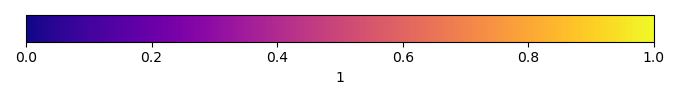
Bias Score [1] |
RMSE Score [1] |
Seasonal Cycle Score [1] |
Spatial Distribution Score [1] |
Overall Score [1] |
|||
|---|---|---|---|---|---|---|---|---|---|---|---|---|---|---|---|---|
| Benchmark | [-] | 185. | ||||||||||||||
| 271 | [-] | 170. | 169. | 184. | 205. | -15.4 | 25.2 | 0.863 | 0.308 | 0.432 | 0.905 | 0.937 | 0.603 | |||
| 330 | [-] | 166. | 166. | 184. | 205. | -19.1 | 26.7 | 0.847 | 0.226 | 0.475 | 0.893 | 0.928 | 0.599 | |||
| CMIP6_001 | [-] | 176. | 176. | 184. | 205. | -7.30 | 19.4 | 1.37 | 0.511 | 0.465 | 0.810 | 0.999 | 0.650 |
Download Data |
Period Mean (original grids) [W m-2] |
Model Period Mean (intersection) [W m-2] |
Benchmark Period Mean (intersection) [W m-2] |
Model Period Mean (complement) [W m-2] |
Benchmark Period Mean (complement) [W m-2] |
Bias [W m-2] |
RMSE [W m-2] |
Phase Shift [months] |
Bias Score [1] |
RMSE Score [1] |
Seasonal Cycle Score [1] |
Spatial Distribution Score [1] |
Overall Score [1] |
|||
|---|---|---|---|---|---|---|---|---|---|---|---|---|---|---|---|---|
| Benchmark | [-] | 198. | ||||||||||||||
| 271 | [-] | 189. | 190. | 198. | 196. | -8.46 | 18.2 | 1.29 | 0.428 | 0.498 | 0.831 | 0.984 | 0.648 | |||
| 330 | [-] | 188. | 188. | 198. | 197. | -9.61 | 18.5 | 1.14 | 0.422 | 0.503 | 0.858 | 0.986 | 0.655 | |||
| CMIP6_001 | [-] | 187. | 187. | 198. | 216. | -10.1 | 17.6 | 1.27 | 0.399 | 0.551 | 0.839 | 0.965 | 0.661 |
Download Data |
Period Mean (original grids) [W m-2] |
Model Period Mean (intersection) [W m-2] |
Benchmark Period Mean (intersection) [W m-2] |
Model Period Mean (complement) [W m-2] |
Benchmark Period Mean (complement) [W m-2] |
Bias [W m-2] |
RMSE [W m-2] |
Phase Shift [months] |
Bias Score [1] |
RMSE Score [1] |
Seasonal Cycle Score [1] |
Spatial Distribution Score [1] |
Overall Score [1] |
|||
|---|---|---|---|---|---|---|---|---|---|---|---|---|---|---|---|---|
| Benchmark | [-] | 201. | ||||||||||||||
| 271 | [-] | 199. | 199. | 200. | 219. | -2.29 | 15.8 | 0.956 | 0.608 | 0.577 | 0.871 | 0.988 | 0.724 | |||
| 330 | [-] | 195. | 195. | 200. | 220. | -5.82 | 16.2 | 0.990 | 0.580 | 0.589 | 0.873 | 0.977 | 0.721 | |||
| CMIP6_001 | [-] | 195. | 195. | 200. | 220. | -4.60 | 18.6 | 1.09 | 0.611 | 0.481 | 0.842 | 0.941 | 0.671 |
Download Data |
Period Mean (original grids) [W m-2] |
Model Period Mean (intersection) [W m-2] |
Benchmark Period Mean (intersection) [W m-2] |
Model Period Mean (complement) [W m-2] |
Benchmark Period Mean (complement) [W m-2] |
Bias [W m-2] |
RMSE [W m-2] |
Phase Shift [months] |
Bias Score [1] |
RMSE Score [1] |
Seasonal Cycle Score [1] |
Spatial Distribution Score [1] |
Overall Score [1] |
|||
|---|---|---|---|---|---|---|---|---|---|---|---|---|---|---|---|---|
| Benchmark | [-] | 69.9 | ||||||||||||||
| 271 | [-] | 63.4 | 63.5 | 69.9 | 67.2 | -7.11 | 14.8 | 0.350 | 0.583 | 0.564 | 0.977 | 0.965 | 0.731 | |||
| 330 | [-] | 63.4 | 63.5 | 70.1 | 68.0 | -7.23 | 14.5 | 0.412 | 0.585 | 0.565 | 0.973 | 0.971 | 0.732 | |||
| CMIP6_001 | [-] | 62.3 | 62.5 | 69.6 | 71.5 | -8.07 | 17.9 | 0.275 | 0.542 | 0.447 | 0.982 | 0.937 | 0.671 |
Download Data |
Period Mean (original grids) [W m-2] |
Model Period Mean (intersection) [W m-2] |
Benchmark Period Mean (intersection) [W m-2] |
Model Period Mean (complement) [W m-2] |
Benchmark Period Mean (complement) [W m-2] |
Bias [W m-2] |
RMSE [W m-2] |
Phase Shift [months] |
Bias Score [1] |
RMSE Score [1] |
Seasonal Cycle Score [1] |
Spatial Distribution Score [1] |
Overall Score [1] |
|||
|---|---|---|---|---|---|---|---|---|---|---|---|---|---|---|---|---|
| Benchmark | [-] | 191. | ||||||||||||||
| 271 | [-] | 164. | 164. | 190. | 208. | -19.9 | 24.0 | 1.35 | 0.336 | 0.667 | 0.817 | 0.959 | 0.689 | |||
| 330 | [-] | 158. | 158. | 190. | 209. | -25.6 | 28.3 | 1.49 | 0.205 | 0.686 | 0.796 | 0.963 | 0.667 | |||
| CMIP6_001 | [-] | 164. | 164. | 187. | 204. | -16.9 | 22.7 | 1.50 | 0.390 | 0.597 | 0.796 | 0.998 | 0.676 |
Download Data |
Period Mean (original grids) [W m-2] |
Model Period Mean (intersection) [W m-2] |
Benchmark Period Mean (intersection) [W m-2] |
Model Period Mean (complement) [W m-2] |
Benchmark Period Mean (complement) [W m-2] |
Bias [W m-2] |
RMSE [W m-2] |
Phase Shift [months] |
Bias Score [1] |
RMSE Score [1] |
Seasonal Cycle Score [1] |
Spatial Distribution Score [1] |
Overall Score [1] |
|||
|---|---|---|---|---|---|---|---|---|---|---|---|---|---|---|---|---|
| Benchmark | [-] | 98.8 | ||||||||||||||
| 271 | [-] | 97.7 | 97.6 | 98.8 | 117. | -0.637 | 13.2 | 0.483 | 0.692 | 0.521 | 0.968 | 0.946 | 0.730 | |||
| 330 | [-] | 98.2 | 98.1 | 99.0 | 118. | -0.393 | 9.96 | 0.371 | 0.733 | 0.648 | 0.975 | 0.981 | 0.797 | |||
| CMIP6_001 | [-] | 100. | 100. | 98.7 | 116. | 1.63 | 11.3 | 0.527 | 0.689 | 0.601 | 0.964 | 0.942 | 0.759 |
Download Data |
Period Mean (original grids) [W m-2] |
Model Period Mean (intersection) [W m-2] |
Benchmark Period Mean (intersection) [W m-2] |
Model Period Mean (complement) [W m-2] |
Benchmark Period Mean (complement) [W m-2] |
Bias [W m-2] |
RMSE [W m-2] |
Phase Shift [months] |
Bias Score [1] |
RMSE Score [1] |
Seasonal Cycle Score [1] |
Spatial Distribution Score [1] |
Overall Score [1] |
|||
|---|---|---|---|---|---|---|---|---|---|---|---|---|---|---|---|---|
| Benchmark | [-] | 139. | ||||||||||||||
| 271 | [-] | 149. | 148. | 139. | 156. | 9.17 | 18.6 | 0.596 | 0.292 | 0.495 | 0.949 | 0.992 | 0.644 | |||
| 330 | [-] | 148. | 148. | 140. | 158. | 8.19 | 17.8 | 0.541 | 0.311 | 0.515 | 0.952 | 0.992 | 0.657 | |||
| CMIP6_001 | [-] | 149. | 148. | 139. | 153. | 9.28 | 17.9 | 0.537 | 0.318 | 0.467 | 0.955 | 0.997 | 0.641 |
Download Data |
Period Mean (original grids) [W m-2] |
Model Period Mean (intersection) [W m-2] |
Benchmark Period Mean (intersection) [W m-2] |
Model Period Mean (complement) [W m-2] |
Benchmark Period Mean (complement) [W m-2] |
Bias [W m-2] |
RMSE [W m-2] |
Phase Shift [months] |
Bias Score [1] |
RMSE Score [1] |
Seasonal Cycle Score [1] |
Spatial Distribution Score [1] |
Overall Score [1] |
|||
|---|---|---|---|---|---|---|---|---|---|---|---|---|---|---|---|---|
| Benchmark | [-] | 181. | ||||||||||||||
| 271 | [-] | 178. | 178. | 181. | 210. | -2.34 | 20.5 | 0.419 | 0.503 | 0.464 | 0.963 | 0.983 | 0.675 | |||
| 330 | [-] | 177. | 177. | 181. | 211. | -3.41 | 20.1 | 0.356 | 0.478 | 0.517 | 0.966 | 0.976 | 0.691 | |||
| CMIP6_001 | [-] | 178. | 178. | 179. | 204. | -0.465 | 18.0 | 0.462 | 0.626 | 0.463 | 0.959 | 0.985 | 0.699 |
Download Data |
Period Mean (original grids) [W m-2] |
Model Period Mean (intersection) [W m-2] |
Benchmark Period Mean (intersection) [W m-2] |
Model Period Mean (complement) [W m-2] |
Benchmark Period Mean (complement) [W m-2] |
Bias [W m-2] |
RMSE [W m-2] |
Phase Shift [months] |
Bias Score [1] |
RMSE Score [1] |
Seasonal Cycle Score [1] |
Spatial Distribution Score [1] |
Overall Score [1] |
|||
|---|---|---|---|---|---|---|---|---|---|---|---|---|---|---|---|---|
| Benchmark | [-] | 62.3 | ||||||||||||||
| 271 | [-] | 52.4 | 52.8 | 62.4 | 57.7 | -11.8 | 20.3 | 0.494 | 0.368 | 0.363 | 0.967 | 0.993 | 0.611 | |||
| 330 | [-] | 52.5 | 53.0 | 62.4 | 58.1 | -11.6 | 20.2 | 0.372 | 0.382 | 0.372 | 0.975 | 0.987 | 0.618 | |||
| CMIP6_001 | [-] | 48.7 | 49.1 | 62.5 | 52.5 | -14.8 | 24.7 | 0.416 | 0.254 | 0.257 | 0.972 | 0.952 | 0.538 |
Download Data |
Period Mean (original grids) [W m-2] |
Model Period Mean (intersection) [W m-2] |
Benchmark Period Mean (intersection) [W m-2] |
Model Period Mean (complement) [W m-2] |
Benchmark Period Mean (complement) [W m-2] |
Bias [W m-2] |
RMSE [W m-2] |
Phase Shift [months] |
Bias Score [1] |
RMSE Score [1] |
Seasonal Cycle Score [1] |
Spatial Distribution Score [1] |
Overall Score [1] |
|||
|---|---|---|---|---|---|---|---|---|---|---|---|---|---|---|---|---|
| Benchmark | [-] | 200. | ||||||||||||||
| 271 | [-] | 201. | 201. | 199. | 213. | -2.33 | 13.8 | 0.449 | 0.586 | 0.611 | 0.969 | 0.956 | 0.747 | |||
| 330 | [-] | 199. | 199. | 199. | 213. | -4.84 | 13.1 | 0.368 | 0.607 | 0.659 | 0.975 | 0.963 | 0.773 | |||
| CMIP6_001 | [-] | 197. | 197. | 200. | 198. | -5.88 | 12.2 | 0.511 | 0.638 | 0.658 | 0.957 | 0.958 | 0.774 |
Download Data |
Period Mean (original grids) [W m-2] |
Model Period Mean (intersection) [W m-2] |
Benchmark Period Mean (intersection) [W m-2] |
Model Period Mean (complement) [W m-2] |
Benchmark Period Mean (complement) [W m-2] |
Bias [W m-2] |
RMSE [W m-2] |
Phase Shift [months] |
Bias Score [1] |
RMSE Score [1] |
Seasonal Cycle Score [1] |
Spatial Distribution Score [1] |
Overall Score [1] |
|||
|---|---|---|---|---|---|---|---|---|---|---|---|---|---|---|---|---|
| Benchmark | [-] | 121. | ||||||||||||||
| 271 | [-] | 120. | 120. | 121. | 146. | 2.04 | 12.8 | 0.184 | 0.459 | 0.617 | 0.988 | 0.998 | 0.736 | |||
| 330 | [-] | 119. | 119. | 122. | 146. | 0.687 | 11.3 | 0.199 | 0.508 | 0.676 | 0.987 | 0.998 | 0.769 | |||
| CMIP6_001 | [-] | 122. | 122. | 119. | 146. | 6.14 | 13.7 | 0.354 | 0.376 | 0.608 | 0.976 | 0.981 | 0.710 |
Download Data |
Period Mean (original grids) [W m-2] |
Model Period Mean (intersection) [W m-2] |
Benchmark Period Mean (intersection) [W m-2] |
Model Period Mean (complement) [W m-2] |
Benchmark Period Mean (complement) [W m-2] |
Bias [W m-2] |
RMSE [W m-2] |
Phase Shift [months] |
Bias Score [1] |
RMSE Score [1] |
Seasonal Cycle Score [1] |
Spatial Distribution Score [1] |
Overall Score [1] |
|||
|---|---|---|---|---|---|---|---|---|---|---|---|---|---|---|---|---|
| Benchmark | [-] | 143. | ||||||||||||||
| 271 | [-] | 142. | 142. | 143. | 190. | -0.224 | 16.5 | 0.560 | 0.446 | 0.558 | 0.942 | 0.994 | 0.700 | |||
| 330 | [-] | 141. | 141. | 143. | 190. | -1.99 | 16.0 | 0.559 | 0.466 | 0.592 | 0.941 | 0.996 | 0.717 | |||
| CMIP6_001 | [-] | 141. | 141. | 142. | 174. | -0.295 | 16.6 | 0.637 | 0.455 | 0.534 | 0.931 | 0.994 | 0.689 |
Download Data |
Period Mean (original grids) [W m-2] |
Model Period Mean (intersection) [W m-2] |
Benchmark Period Mean (intersection) [W m-2] |
Model Period Mean (complement) [W m-2] |
Benchmark Period Mean (complement) [W m-2] |
Bias [W m-2] |
RMSE [W m-2] |
Phase Shift [months] |
Bias Score [1] |
RMSE Score [1] |
Seasonal Cycle Score [1] |
Spatial Distribution Score [1] |
Overall Score [1] |
|||
|---|---|---|---|---|---|---|---|---|---|---|---|---|---|---|---|---|
| Benchmark | [-] | 177. | ||||||||||||||
| 271 | [-] | 178. | 178. | 176. | 227. | 2.96 | 13.2 | 0.458 | 0.458 | 0.733 | 0.964 | 0.968 | 0.771 | |||
| 330 | [-] | 177. | 178. | 177. | 228. | 2.14 | 12.7 | 0.436 | 0.477 | 0.759 | 0.964 | 0.968 | 0.785 | |||
| CMIP6_001 | [-] | 176. | 176. | 175. | 221. | 1.61 | 13.9 | 0.633 | 0.446 | 0.697 | 0.946 | 0.987 | 0.755 |
Download Data |
Period Mean (original grids) [W m-2] |
Model Period Mean (intersection) [W m-2] |
Benchmark Period Mean (intersection) [W m-2] |
Model Period Mean (complement) [W m-2] |
Benchmark Period Mean (complement) [W m-2] |
Bias [W m-2] |
RMSE [W m-2] |
Phase Shift [months] |
Bias Score [1] |
RMSE Score [1] |
Seasonal Cycle Score [1] |
Spatial Distribution Score [1] |
Overall Score [1] |
|||
|---|---|---|---|---|---|---|---|---|---|---|---|---|---|---|---|---|
| Benchmark | [-] | 68.8 | ||||||||||||||
| 271 | [-] | 61.9 | 61.7 | 68.9 | 61.7 | -9.17 | 19.1 | 0.183 | 0.456 | 0.404 | 0.988 | 0.976 | 0.646 | |||
| 330 | [-] | 61.9 | 61.7 | 69.0 | 62.2 | -9.47 | 19.2 | 0.223 | 0.457 | 0.390 | 0.985 | 0.984 | 0.641 | |||
| CMIP6_001 | [-] | 56.4 | 56.4 | 68.8 | 70.0 | -14.3 | 25.5 | 0.270 | 0.299 | 0.251 | 0.982 | 0.957 | 0.548 |
Download Data |
Period Mean (original grids) [W m-2] |
Model Period Mean (intersection) [W m-2] |
Benchmark Period Mean (intersection) [W m-2] |
Model Period Mean (complement) [W m-2] |
Benchmark Period Mean (complement) [W m-2] |
Bias [W m-2] |
RMSE [W m-2] |
Phase Shift [months] |
Bias Score [1] |
RMSE Score [1] |
Seasonal Cycle Score [1] |
Spatial Distribution Score [1] |
Overall Score [1] |
|||
|---|---|---|---|---|---|---|---|---|---|---|---|---|---|---|---|---|
| Benchmark | [-] | 204. | ||||||||||||||
| 271 | [-] | 199. | 199. | 203. | 218. | -3.55 | 16.5 | 0.591 | 0.504 | 0.629 | 0.930 | 0.946 | 0.728 | |||
| 330 | [-] | 195. | 195. | 204. | 219. | -8.03 | 18.0 | 0.598 | 0.491 | 0.625 | 0.926 | 0.963 | 0.726 | |||
| CMIP6_001 | [-] | 200. | 200. | 201. | 219. | 1.03 | 17.8 | 0.616 | 0.468 | 0.520 | 0.941 | 0.941 | 0.678 |
Download Data |
Period Mean (original grids) [W m-2] |
Model Period Mean (intersection) [W m-2] |
Benchmark Period Mean (intersection) [W m-2] |
Model Period Mean (complement) [W m-2] |
Benchmark Period Mean (complement) [W m-2] |
Bias [W m-2] |
RMSE [W m-2] |
Phase Shift [months] |
Bias Score [1] |
RMSE Score [1] |
Seasonal Cycle Score [1] |
Spatial Distribution Score [1] |
Overall Score [1] |
|||
|---|---|---|---|---|---|---|---|---|---|---|---|---|---|---|---|---|
| Benchmark | [-] | 152. | ||||||||||||||
| 271 | [-] | 163. | 163. | 151. | 199. | 13.6 | 16.8 | 0.462 | 0.201 | 0.681 | 0.966 | 0.954 | 0.697 | |||
| 330 | [-] | 162. | 162. | 151. | 198. | 13.2 | 16.8 | 0.523 | 0.222 | 0.697 | 0.964 | 0.941 | 0.704 | |||
| CMIP6_001 | [-] | 160. | 160. | 149. | 192. | 12.2 | 16.1 | 0.376 | 0.228 | 0.627 | 0.974 | 0.959 | 0.683 |
Download Data |
Period Mean (original grids) [W m-2] |
Model Period Mean (intersection) [W m-2] |
Benchmark Period Mean (intersection) [W m-2] |
Model Period Mean (complement) [W m-2] |
Benchmark Period Mean (complement) [W m-2] |
Bias [W m-2] |
RMSE [W m-2] |
Phase Shift [months] |
Bias Score [1] |
RMSE Score [1] |
Seasonal Cycle Score [1] |
Spatial Distribution Score [1] |
Overall Score [1] |
|||
|---|---|---|---|---|---|---|---|---|---|---|---|---|---|---|---|---|
| Benchmark | [-] | 110. | ||||||||||||||
| 271 | [-] | 116. | 116. | 110. | 134. | 5.76 | 14.2 | 0.313 | 0.502 | 0.534 | 0.978 | 0.960 | 0.702 | |||
| 330 | [-] | 114. | 114. | 110. | 136. | 3.67 | 11.1 | 0.456 | 0.542 | 0.659 | 0.967 | 0.921 | 0.750 | |||
| CMIP6_001 | [-] | 115. | 115. | 110. | 116. | 4.66 | 13.9 | 0.470 | 0.449 | 0.568 | 0.969 | 0.888 | 0.688 |
Download Data |
Period Mean (original grids) [W m-2] |
Model Period Mean (intersection) [W m-2] |
Benchmark Period Mean (intersection) [W m-2] |
Model Period Mean (complement) [W m-2] |
Benchmark Period Mean (complement) [W m-2] |
Bias [W m-2] |
RMSE [W m-2] |
Phase Shift [months] |
Bias Score [1] |
RMSE Score [1] |
Seasonal Cycle Score [1] |
Spatial Distribution Score [1] |
Overall Score [1] |
|||
|---|---|---|---|---|---|---|---|---|---|---|---|---|---|---|---|---|
| Benchmark | [-] | 164. | ||||||||||||||
| 271 | [-] | 175. | 175. | 163. | 173. | 12.1 | 17.7 | 0.246 | 0.274 | 0.494 | 0.983 | 0.995 | 0.648 | |||
| 330 | [-] | 174. | 175. | 164. | 174. | 11.0 | 15.8 | 0.165 | 0.312 | 0.593 | 0.989 | 0.985 | 0.694 | |||
| CMIP6_001 | [-] | 173. | 173. | 163. | 166. | 9.52 | 14.6 | 0.210 | 0.396 | 0.563 | 0.986 | 0.987 | 0.699 |
Download Data |
Period Mean (original grids) [W m-2] |
Model Period Mean (intersection) [W m-2] |
Benchmark Period Mean (intersection) [W m-2] |
Model Period Mean (complement) [W m-2] |
Benchmark Period Mean (complement) [W m-2] |
Bias [W m-2] |
RMSE [W m-2] |
Phase Shift [months] |
Bias Score [1] |
RMSE Score [1] |
Seasonal Cycle Score [1] |
Spatial Distribution Score [1] |
Overall Score [1] |
|||
|---|---|---|---|---|---|---|---|---|---|---|---|---|---|---|---|---|
| Benchmark | [-] | 175. | ||||||||||||||
| 271 | [-] | 180. | 180. | 175. | 227. | 5.28 | 19.2 | 1.19 | 0.499 | 0.567 | 0.846 | 0.998 | 0.695 | |||
| 330 | [-] | 173. | 172. | 175. | 228. | -1.90 | 17.3 | 1.51 | 0.603 | 0.584 | 0.796 | 0.998 | 0.713 | |||
| CMIP6_001 | [-] | 186. | 186. | 174. | 219. | 11.9 | 23.0 | 1.48 | 0.378 | 0.482 | 0.795 | 0.989 | 0.625 |
Download Data |
Period Mean (original grids) [W m-2] |
Model Period Mean (intersection) [W m-2] |
Benchmark Period Mean (intersection) [W m-2] |
Model Period Mean (complement) [W m-2] |
Benchmark Period Mean (complement) [W m-2] |
Bias [W m-2] |
RMSE [W m-2] |
Phase Shift [months] |
Bias Score [1] |
RMSE Score [1] |
Seasonal Cycle Score [1] |
Spatial Distribution Score [1] |
Overall Score [1] |
|||
|---|---|---|---|---|---|---|---|---|---|---|---|---|---|---|---|---|
| Benchmark | [-] | 184. | ||||||||||||||
| 271 | [-] | 197. | 197. | 184. | 212. | 12.6 | 19.3 | 0.744 | 0.309 | 0.620 | 0.922 | 0.993 | 0.693 | |||
| 330 | [-] | 191. | 192. | 184. | 212. | 7.25 | 16.2 | 0.661 | 0.480 | 0.659 | 0.931 | 0.963 | 0.739 | |||
| CMIP6_001 | [-] | 189. | 189. | 184. | 204. | 5.70 | 16.8 | 0.933 | 0.518 | 0.577 | 0.885 | 0.995 | 0.710 |
Download Data |
Period Mean (original grids) [W m-2] |
Model Period Mean (intersection) [W m-2] |
Benchmark Period Mean (intersection) [W m-2] |
Model Period Mean (complement) [W m-2] |
Benchmark Period Mean (complement) [W m-2] |
Bias [W m-2] |
RMSE [W m-2] |
Phase Shift [months] |
Bias Score [1] |
RMSE Score [1] |
Seasonal Cycle Score [1] |
Spatial Distribution Score [1] |
Overall Score [1] |
|||
|---|---|---|---|---|---|---|---|---|---|---|---|---|---|---|---|---|
| Benchmark | [-] | 178. | ||||||||||||||
| 271 | [-] | 180. | 179. | 178. | 187. | -1.45 | 24.2 | 0.683 | 0.295 | 0.446 | 0.914 | 0.949 | 0.610 | |||
| 330 | [-] | 177. | 176. | 179. | 188. | -4.65 | 24.5 | 0.735 | 0.316 | 0.431 | 0.910 | 0.954 | 0.608 | |||
| CMIP6_001 | [-] | 185. | 184. | 179. | 171. | -0.767 | 20.7 | 0.746 | 0.360 | 0.510 | 0.906 | 0.973 | 0.652 |
Temporally integrated period mean