Mean State
Download Data |
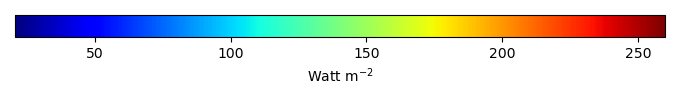
Period Mean (original grids) [Watt m-2] |
Model Period Mean (intersection) [Watt m-2] |
Benchmark Period Mean (intersection) [Watt m-2] |
Model Period Mean (complement) [Watt m-2] |
Benchmark Period Mean (complement) [Watt m-2] |
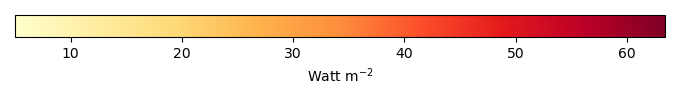
Bias [Watt m-2] |
RMSE [Watt m-2] |
Phase Shift [months] |
Bias Score [1] |
RMSE Score [1] |
Seasonal Cycle Score [1] |
Spatial Distribution Score [1] |
Overall Score [1] |
|||
|---|---|---|---|---|---|---|---|---|---|---|---|---|---|---|---|---|
| Benchmark | [-] | 179. | ||||||||||||||
| 271 | [-] | 172. | 171. | 178. | 218. | -7.79 | 21.6 | 0.758 | 0.351 | 0.577 | 0.913 | 0.910 | 0.666 | |||
| 330 | [-] | 167. | 166. | 178. | 218. | -12.6 | 24.9 | 0.947 | 0.228 | 0.539 | 0.900 | 0.883 | 0.618 | |||
| CMIP6_001 | [-] | 176. | 176. | 177. | 216. | -0.676 | 18.1 | 1.20 | 0.518 | 0.536 | 0.833 | 0.980 | 0.680 |
Download Data |
Period Mean (original grids) [Watt m-2] |
Model Period Mean (intersection) [Watt m-2] |
Benchmark Period Mean (intersection) [Watt m-2] |
Model Period Mean (complement) [Watt m-2] |
Benchmark Period Mean (complement) [Watt m-2] |
Bias [Watt m-2] |
RMSE [Watt m-2] |
Phase Shift [months] |
Bias Score [1] |
RMSE Score [1] |
Seasonal Cycle Score [1] |
Spatial Distribution Score [1] |
Overall Score [1] |
|||
|---|---|---|---|---|---|---|---|---|---|---|---|---|---|---|---|---|
| Benchmark | [-] | 189. | ||||||||||||||
| 271 | [-] | 191. | 191. | 189. | 210. | 2.59 | 16.1 | 0.604 | 0.486 | 0.594 | 0.940 | 0.954 | 0.714 | |||
| 330 | [-] | 189. | 189. | 189. | 210. | 0.695 | 17.2 | 0.528 | 0.477 | 0.549 | 0.960 | 0.947 | 0.696 | |||
| CMIP6_001 | [-] | 188. | 188. | 188. | 224. | 0.205 | 14.3 | 0.652 | 0.552 | 0.598 | 0.930 | 0.999 | 0.735 |
Download Data |
Period Mean (original grids) [Watt m-2] |
Model Period Mean (intersection) [Watt m-2] |
Benchmark Period Mean (intersection) [Watt m-2] |
Model Period Mean (complement) [Watt m-2] |
Benchmark Period Mean (complement) [Watt m-2] |
Bias [Watt m-2] |
RMSE [Watt m-2] |
Phase Shift [months] |
Bias Score [1] |
RMSE Score [1] |
Seasonal Cycle Score [1] |
Spatial Distribution Score [1] |
Overall Score [1] |
|||
|---|---|---|---|---|---|---|---|---|---|---|---|---|---|---|---|---|
| Benchmark | [-] | 194. | ||||||||||||||
| 271 | [-] | 199. | 199. | 193. | 223. | 5.05 | 18.9 | 0.847 | 0.449 | 0.553 | 0.911 | 0.996 | 0.692 | |||
| 330 | [-] | 195. | 195. | 193. | 223. | 1.28 | 18.7 | 0.985 | 0.498 | 0.532 | 0.892 | 0.998 | 0.690 | |||
| CMIP6_001 | [-] | 195. | 195. | 192. | 221. | 2.23 | 20.9 | 0.898 | 0.507 | 0.444 | 0.901 | 0.986 | 0.656 |
Download Data |
Period Mean (original grids) [Watt m-2] |
Model Period Mean (intersection) [Watt m-2] |
Benchmark Period Mean (intersection) [Watt m-2] |
Model Period Mean (complement) [Watt m-2] |
Benchmark Period Mean (complement) [Watt m-2] |
Bias [Watt m-2] |
RMSE [Watt m-2] |
Phase Shift [months] |
Bias Score [1] |
RMSE Score [1] |
Seasonal Cycle Score [1] |
Spatial Distribution Score [1] |
Overall Score [1] |
|||
|---|---|---|---|---|---|---|---|---|---|---|---|---|---|---|---|---|
| Benchmark | [-] | 81.3 | ||||||||||||||
| 271 | [-] | 63.7 | 63.8 | 81.3 | 84.8 | -18.2 | 21.2 | 0.375 | 0.170 | 0.477 | 0.975 | 0.859 | 0.592 | |||
| 330 | [-] | 63.0 | 63.1 | 81.3 | 84.8 | -18.8 | 21.5 | 0.395 | 0.156 | 0.474 | 0.974 | 0.860 | 0.588 | |||
| CMIP6_001 | [-] | 60.0 | 60.1 | 80.9 | 86.2 | -21.8 | 27.6 | 0.357 | 0.113 | 0.307 | 0.976 | 0.782 | 0.497 |
Download Data |
Period Mean (original grids) [Watt m-2] |
Model Period Mean (intersection) [Watt m-2] |
Benchmark Period Mean (intersection) [Watt m-2] |
Model Period Mean (complement) [Watt m-2] |
Benchmark Period Mean (complement) [Watt m-2] |
Bias [Watt m-2] |
RMSE [Watt m-2] |
Phase Shift [months] |
Bias Score [1] |
RMSE Score [1] |
Seasonal Cycle Score [1] |
Spatial Distribution Score [1] |
Overall Score [1] |
|||
|---|---|---|---|---|---|---|---|---|---|---|---|---|---|---|---|---|
| Benchmark | [-] | 189. | ||||||||||||||
| 271 | [-] | 163. | 163. | 188. | 215. | -18.5 | 24.2 | 1.18 | 0.458 | 0.675 | 0.849 | 0.760 | 0.683 | |||
| 330 | [-] | 158. | 158. | 188. | 215. | -23.1 | 27.7 | 1.27 | 0.353 | 0.665 | 0.839 | 0.827 | 0.670 | |||
| CMIP6_001 | [-] | 164. | 164. | 183. | 210. | -12.9 | 22.1 | 1.58 | 0.512 | 0.585 | 0.783 | 0.914 | 0.676 |
Download Data |
Period Mean (original grids) [Watt m-2] |
Model Period Mean (intersection) [Watt m-2] |
Benchmark Period Mean (intersection) [Watt m-2] |
Model Period Mean (complement) [Watt m-2] |
Benchmark Period Mean (complement) [Watt m-2] |
Bias [Watt m-2] |
RMSE [Watt m-2] |
Phase Shift [months] |
Bias Score [1] |
RMSE Score [1] |
Seasonal Cycle Score [1] |
Spatial Distribution Score [1] |
Overall Score [1] |
|||
|---|---|---|---|---|---|---|---|---|---|---|---|---|---|---|---|---|
| Benchmark | [-] | 105. | ||||||||||||||
| 271 | [-] | 95.3 | 95.2 | 105. | 130. | -8.74 | 16.2 | 0.398 | 0.470 | 0.484 | 0.974 | 0.900 | 0.663 | |||
| 330 | [-] | 96.5 | 96.4 | 105. | 130. | -7.59 | 13.0 | 0.258 | 0.507 | 0.612 | 0.983 | 0.924 | 0.728 | |||
| CMIP6_001 | [-] | 96.3 | 96.2 | 104. | 127. | -7.66 | 14.9 | 0.388 | 0.482 | 0.542 | 0.974 | 0.838 | 0.676 |
Download Data |
Period Mean (original grids) [Watt m-2] |
Model Period Mean (intersection) [Watt m-2] |
Benchmark Period Mean (intersection) [Watt m-2] |
Model Period Mean (complement) [Watt m-2] |
Benchmark Period Mean (complement) [Watt m-2] |
Bias [Watt m-2] |
RMSE [Watt m-2] |
Phase Shift [months] |
Bias Score [1] |
RMSE Score [1] |
Seasonal Cycle Score [1] |
Spatial Distribution Score [1] |
Overall Score [1] |
|||
|---|---|---|---|---|---|---|---|---|---|---|---|---|---|---|---|---|
| Benchmark | [-] | 140. | ||||||||||||||
| 271 | [-] | 147. | 147. | 140. | 166. | 7.18 | 21.2 | 0.654 | 0.306 | 0.373 | 0.939 | 0.980 | 0.594 | |||
| 330 | [-] | 147. | 146. | 140. | 166. | 6.56 | 21.8 | 0.634 | 0.302 | 0.347 | 0.941 | 0.975 | 0.583 | |||
| CMIP6_001 | [-] | 148. | 148. | 139. | 162. | 8.72 | 20.4 | 0.553 | 0.299 | 0.382 | 0.953 | 0.996 | 0.603 |
Download Data |
Period Mean (original grids) [Watt m-2] |
Model Period Mean (intersection) [Watt m-2] |
Benchmark Period Mean (intersection) [Watt m-2] |
Model Period Mean (complement) [Watt m-2] |
Benchmark Period Mean (complement) [Watt m-2] |
Bias [Watt m-2] |
RMSE [Watt m-2] |
Phase Shift [months] |
Bias Score [1] |
RMSE Score [1] |
Seasonal Cycle Score [1] |
Spatial Distribution Score [1] |
Overall Score [1] |
|||
|---|---|---|---|---|---|---|---|---|---|---|---|---|---|---|---|---|
| Benchmark | [-] | 180. | ||||||||||||||
| 271 | [-] | 181. | 181. | 180. | 216. | 1.14 | 22.8 | 0.501 | 0.409 | 0.458 | 0.963 | 0.979 | 0.654 | |||
| 330 | [-] | 179. | 179. | 180. | 216. | -0.961 | 23.7 | 0.494 | 0.405 | 0.445 | 0.962 | 0.984 | 0.648 | |||
| CMIP6_001 | [-] | 180. | 180. | 178. | 210. | 3.31 | 23.1 | 0.569 | 0.430 | 0.386 | 0.955 | 0.990 | 0.630 |
Download Data |
Period Mean (original grids) [Watt m-2] |
Model Period Mean (intersection) [Watt m-2] |
Benchmark Period Mean (intersection) [Watt m-2] |
Model Period Mean (complement) [Watt m-2] |
Benchmark Period Mean (complement) [Watt m-2] |
Bias [Watt m-2] |
RMSE [Watt m-2] |
Phase Shift [months] |
Bias Score [1] |
RMSE Score [1] |
Seasonal Cycle Score [1] |
Spatial Distribution Score [1] |
Overall Score [1] |
|||
|---|---|---|---|---|---|---|---|---|---|---|---|---|---|---|---|---|
| Benchmark | [-] | 74.6 | ||||||||||||||
| 271 | [-] | 50.8 | 51.2 | 74.5 | 81.8 | -25.1 | 27.1 | 0.311 | 0.0560 | 0.274 | 0.979 | 0.905 | 0.498 | |||
| 330 | [-] | 52.5 | 52.9 | 74.5 | 81.8 | -23.5 | 24.8 | 0.237 | 0.0778 | 0.329 | 0.984 | 0.887 | 0.521 | |||
| CMIP6_001 | [-] | 46.6 | 47.0 | 74.6 | 74.8 | -28.7 | 33.8 | 0.361 | 0.0428 | 0.174 | 0.976 | 0.827 | 0.439 |
Download Data |
Period Mean (original grids) [Watt m-2] |
Model Period Mean (intersection) [Watt m-2] |
Benchmark Period Mean (intersection) [Watt m-2] |
Model Period Mean (complement) [Watt m-2] |
Benchmark Period Mean (complement) [Watt m-2] |
Bias [Watt m-2] |
RMSE [Watt m-2] |
Phase Shift [months] |
Bias Score [1] |
RMSE Score [1] |
Seasonal Cycle Score [1] |
Spatial Distribution Score [1] |
Overall Score [1] |
|||
|---|---|---|---|---|---|---|---|---|---|---|---|---|---|---|---|---|
| Benchmark | [-] | 193. | ||||||||||||||
| 271 | [-] | 202. | 202. | 193. | 219. | 4.96 | 19.8 | 0.488 | 0.339 | 0.496 | 0.967 | 0.979 | 0.656 | |||
| 330 | [-] | 200. | 200. | 193. | 219. | 3.08 | 19.1 | 0.523 | 0.378 | 0.507 | 0.963 | 0.983 | 0.668 | |||
| CMIP6_001 | [-] | 197. | 197. | 193. | 202. | 2.00 | 17.5 | 0.580 | 0.439 | 0.517 | 0.961 | 0.981 | 0.683 |
Download Data |
Period Mean (original grids) [Watt m-2] |
Model Period Mean (intersection) [Watt m-2] |
Benchmark Period Mean (intersection) [Watt m-2] |
Model Period Mean (complement) [Watt m-2] |
Benchmark Period Mean (complement) [Watt m-2] |
Bias [Watt m-2] |
RMSE [Watt m-2] |
Phase Shift [months] |
Bias Score [1] |
RMSE Score [1] |
Seasonal Cycle Score [1] |
Spatial Distribution Score [1] |
Overall Score [1] |
|||
|---|---|---|---|---|---|---|---|---|---|---|---|---|---|---|---|---|
| Benchmark | [-] | 120. | ||||||||||||||
| 271 | [-] | 117. | 117. | 120. | 152. | 0.0458 | 17.1 | 0.293 | 0.367 | 0.483 | 0.980 | 0.989 | 0.661 | |||
| 330 | [-] | 117. | 117. | 120. | 152. | 0.0414 | 15.9 | 0.202 | 0.366 | 0.545 | 0.985 | 0.991 | 0.686 | |||
| CMIP6_001 | [-] | 119. | 119. | 117. | 151. | 4.27 | 17.7 | 0.364 | 0.313 | 0.475 | 0.976 | 0.944 | 0.637 |
Download Data |
Period Mean (original grids) [Watt m-2] |
Model Period Mean (intersection) [Watt m-2] |
Benchmark Period Mean (intersection) [Watt m-2] |
Model Period Mean (complement) [Watt m-2] |
Benchmark Period Mean (complement) [Watt m-2] |
Bias [Watt m-2] |
RMSE [Watt m-2] |
Phase Shift [months] |
Bias Score [1] |
RMSE Score [1] |
Seasonal Cycle Score [1] |
Spatial Distribution Score [1] |
Overall Score [1] |
|||
|---|---|---|---|---|---|---|---|---|---|---|---|---|---|---|---|---|
| Benchmark | [-] | 145. | ||||||||||||||
| 271 | [-] | 142. | 142. | 144. | 197. | -2.10 | 19.6 | 0.529 | 0.365 | 0.514 | 0.948 | 0.948 | 0.658 | |||
| 330 | [-] | 140. | 140. | 144. | 197. | -3.66 | 19.3 | 0.564 | 0.380 | 0.523 | 0.944 | 0.956 | 0.665 | |||
| CMIP6_001 | [-] | 140. | 140. | 143. | 181. | -2.13 | 19.8 | 0.608 | 0.382 | 0.487 | 0.939 | 0.942 | 0.647 |
Download Data |
Period Mean (original grids) [Watt m-2] |
Model Period Mean (intersection) [Watt m-2] |
Benchmark Period Mean (intersection) [Watt m-2] |
Model Period Mean (complement) [Watt m-2] |
Benchmark Period Mean (complement) [Watt m-2] |
Bias [Watt m-2] |
RMSE [Watt m-2] |
Phase Shift [months] |
Bias Score [1] |
RMSE Score [1] |
Seasonal Cycle Score [1] |
Spatial Distribution Score [1] |
Overall Score [1] |
|||
|---|---|---|---|---|---|---|---|---|---|---|---|---|---|---|---|---|
| Benchmark | [-] | 175. | ||||||||||||||
| 271 | [-] | 178. | 178. | 175. | 233. | 3.88 | 17.6 | 0.432 | 0.391 | 0.638 | 0.964 | 0.989 | 0.724 | |||
| 330 | [-] | 177. | 177. | 175. | 233. | 3.20 | 17.4 | 0.469 | 0.403 | 0.634 | 0.960 | 0.988 | 0.724 | |||
| CMIP6_001 | [-] | 176. | 176. | 173. | 226. | 3.26 | 17.6 | 0.659 | 0.371 | 0.633 | 0.933 | 0.996 | 0.713 |
Download Data |
Period Mean (original grids) [Watt m-2] |
Model Period Mean (intersection) [Watt m-2] |
Benchmark Period Mean (intersection) [Watt m-2] |
Model Period Mean (complement) [Watt m-2] |
Benchmark Period Mean (complement) [Watt m-2] |
Bias [Watt m-2] |
RMSE [Watt m-2] |
Phase Shift [months] |
Bias Score [1] |
RMSE Score [1] |
Seasonal Cycle Score [1] |
Spatial Distribution Score [1] |
Overall Score [1] |
|||
|---|---|---|---|---|---|---|---|---|---|---|---|---|---|---|---|---|
| Benchmark | [-] | 80.0 | ||||||||||||||
| 271 | [-] | 60.5 | 60.3 | 80.0 | 78.6 | -21.6 | 26.3 | 0.214 | 0.138 | 0.317 | 0.986 | 0.889 | 0.529 | |||
| 330 | [-] | 60.8 | 60.6 | 80.0 | 78.6 | -21.3 | 26.3 | 0.201 | 0.133 | 0.310 | 0.987 | 0.889 | 0.526 | |||
| CMIP6_001 | [-] | 53.7 | 53.6 | 79.8 | 82.9 | -27.8 | 35.4 | 0.341 | 0.0611 | 0.155 | 0.977 | 0.858 | 0.441 |
Download Data |
Period Mean (original grids) [Watt m-2] |
Model Period Mean (intersection) [Watt m-2] |
Benchmark Period Mean (intersection) [Watt m-2] |
Model Period Mean (complement) [Watt m-2] |
Benchmark Period Mean (complement) [Watt m-2] |
Bias [Watt m-2] |
RMSE [Watt m-2] |
Phase Shift [months] |
Bias Score [1] |
RMSE Score [1] |
Seasonal Cycle Score [1] |
Spatial Distribution Score [1] |
Overall Score [1] |
|||
|---|---|---|---|---|---|---|---|---|---|---|---|---|---|---|---|---|
| Benchmark | [-] | 205. | ||||||||||||||
| 271 | [-] | 198. | 198. | 204. | 226. | -5.04 | 20.7 | 0.519 | 0.400 | 0.623 | 0.943 | 0.806 | 0.679 | |||
| 330 | [-] | 195. | 195. | 204. | 226. | -8.86 | 22.0 | 0.585 | 0.395 | 0.616 | 0.930 | 0.858 | 0.683 | |||
| CMIP6_001 | [-] | 200. | 200. | 200. | 227. | 1.08 | 21.2 | 0.646 | 0.360 | 0.503 | 0.943 | 0.839 | 0.629 |
Download Data |
Period Mean (original grids) [Watt m-2] |
Model Period Mean (intersection) [Watt m-2] |
Benchmark Period Mean (intersection) [Watt m-2] |
Model Period Mean (complement) [Watt m-2] |
Benchmark Period Mean (complement) [Watt m-2] |
Bias [Watt m-2] |
RMSE [Watt m-2] |
Phase Shift [months] |
Bias Score [1] |
RMSE Score [1] |
Seasonal Cycle Score [1] |
Spatial Distribution Score [1] |
Overall Score [1] |
|||
|---|---|---|---|---|---|---|---|---|---|---|---|---|---|---|---|---|
| Benchmark | [-] | 153. | ||||||||||||||
| 271 | [-] | 160. | 160. | 152. | 202. | 9.98 | 14.8 | 0.224 | 0.268 | 0.692 | 0.985 | 0.991 | 0.726 | |||
| 330 | [-] | 160. | 160. | 152. | 202. | 9.12 | 14.4 | 0.299 | 0.298 | 0.689 | 0.979 | 0.975 | 0.726 | |||
| CMIP6_001 | [-] | 157. | 157. | 151. | 194. | 7.54 | 13.7 | 0.256 | 0.428 | 0.625 | 0.983 | 0.998 | 0.732 |
Download Data |
Period Mean (original grids) [Watt m-2] |
Model Period Mean (intersection) [Watt m-2] |
Benchmark Period Mean (intersection) [Watt m-2] |
Model Period Mean (complement) [Watt m-2] |
Benchmark Period Mean (complement) [Watt m-2] |
Bias [Watt m-2] |
RMSE [Watt m-2] |
Phase Shift [months] |
Bias Score [1] |
RMSE Score [1] |
Seasonal Cycle Score [1] |
Spatial Distribution Score [1] |
Overall Score [1] |
|||
|---|---|---|---|---|---|---|---|---|---|---|---|---|---|---|---|---|
| Benchmark | [-] | 115. | ||||||||||||||
| 271 | [-] | 114. | 114. | 115. | 142. | -0.821 | 14.1 | 0.217 | 0.629 | 0.489 | 0.986 | 0.942 | 0.707 | |||
| 330 | [-] | 112. | 113. | 115. | 142. | -2.23 | 11.2 | 0.515 | 0.605 | 0.642 | 0.966 | 0.919 | 0.755 | |||
| CMIP6_001 | [-] | 112. | 112. | 114. | 123. | -2.49 | 13.0 | 0.457 | 0.577 | 0.575 | 0.967 | 0.882 | 0.715 |
Download Data |
Period Mean (original grids) [Watt m-2] |
Model Period Mean (intersection) [Watt m-2] |
Benchmark Period Mean (intersection) [Watt m-2] |
Model Period Mean (complement) [Watt m-2] |
Benchmark Period Mean (complement) [Watt m-2] |
Bias [Watt m-2] |
RMSE [Watt m-2] |
Phase Shift [months] |
Bias Score [1] |
RMSE Score [1] |
Seasonal Cycle Score [1] |
Spatial Distribution Score [1] |
Overall Score [1] |
|||
|---|---|---|---|---|---|---|---|---|---|---|---|---|---|---|---|---|
| Benchmark | [-] | 162. | ||||||||||||||
| 271 | [-] | 173. | 173. | 162. | 181. | 11.2 | 18.2 | 0.298 | 0.313 | 0.470 | 0.980 | 0.984 | 0.643 | |||
| 330 | [-] | 172. | 172. | 162. | 181. | 10.5 | 17.9 | 0.261 | 0.304 | 0.478 | 0.982 | 0.992 | 0.647 | |||
| CMIP6_001 | [-] | 171. | 171. | 162. | 171. | 9.55 | 15.7 | 0.283 | 0.405 | 0.526 | 0.981 | 0.988 | 0.685 |
Download Data |
Period Mean (original grids) [Watt m-2] |
Model Period Mean (intersection) [Watt m-2] |
Benchmark Period Mean (intersection) [Watt m-2] |
Model Period Mean (complement) [Watt m-2] |
Benchmark Period Mean (complement) [Watt m-2] |
Bias [Watt m-2] |
RMSE [Watt m-2] |
Phase Shift [months] |
Bias Score [1] |
RMSE Score [1] |
Seasonal Cycle Score [1] |
Spatial Distribution Score [1] |
Overall Score [1] |
|||
|---|---|---|---|---|---|---|---|---|---|---|---|---|---|---|---|---|
| Benchmark | [-] | 176. | ||||||||||||||
| 271 | [-] | 180. | 180. | 175. | 232. | 5.16 | 18.1 | 1.24 | 0.519 | 0.620 | 0.835 | 0.998 | 0.718 | |||
| 330 | [-] | 172. | 172. | 175. | 232. | -2.45 | 17.1 | 1.37 | 0.597 | 0.620 | 0.818 | 0.996 | 0.730 | |||
| CMIP6_001 | [-] | 185. | 185. | 174. | 226. | 11.2 | 21.4 | 1.40 | 0.383 | 0.546 | 0.808 | 0.999 | 0.657 |
Download Data |
Period Mean (original grids) [Watt m-2] |
Model Period Mean (intersection) [Watt m-2] |
Benchmark Period Mean (intersection) [Watt m-2] |
Model Period Mean (complement) [Watt m-2] |
Benchmark Period Mean (complement) [Watt m-2] |
Bias [Watt m-2] |
RMSE [Watt m-2] |
Phase Shift [months] |
Bias Score [1] |
RMSE Score [1] |
Seasonal Cycle Score [1] |
Spatial Distribution Score [1] |
Overall Score [1] |
|||
|---|---|---|---|---|---|---|---|---|---|---|---|---|---|---|---|---|
| Benchmark | [-] | 182. | ||||||||||||||
| 271 | [-] | 196. | 197. | 182. | 207. | 14.4 | 20.5 | 0.768 | 0.262 | 0.602 | 0.915 | 0.995 | 0.675 | |||
| 330 | [-] | 191. | 192. | 182. | 207. | 9.48 | 17.1 | 0.880 | 0.431 | 0.624 | 0.899 | 0.980 | 0.712 | |||
| CMIP6_001 | [-] | 189. | 189. | 181. | 201. | 7.18 | 16.1 | 0.864 | 0.507 | 0.614 | 0.909 | 0.974 | 0.724 |
Download Data |
Period Mean (original grids) [Watt m-2] |
Model Period Mean (intersection) [Watt m-2] |
Benchmark Period Mean (intersection) [Watt m-2] |
Model Period Mean (complement) [Watt m-2] |
Benchmark Period Mean (complement) [Watt m-2] |
Bias [Watt m-2] |
RMSE [Watt m-2] |
Phase Shift [months] |
Bias Score [1] |
RMSE Score [1] |
Seasonal Cycle Score [1] |
Spatial Distribution Score [1] |
Overall Score [1] |
|||
|---|---|---|---|---|---|---|---|---|---|---|---|---|---|---|---|---|
| Benchmark | [-] | 176. | ||||||||||||||
| 271 | [-] | 180. | 179. | 175. | 198. | 2.46 | 26.7 | 0.933 | 0.225 | 0.450 | 0.878 | 0.934 | 0.588 | |||
| 330 | [-] | 177. | 176. | 175. | 198. | -0.474 | 27.3 | 0.968 | 0.232 | 0.425 | 0.872 | 0.942 | 0.579 | |||
| CMIP6_001 | [-] | 185. | 184. | 176. | 178. | 4.23 | 26.1 | 0.954 | 0.211 | 0.471 | 0.884 | 0.963 | 0.600 |
Temporally integrated period mean