Mean State
Download Data |
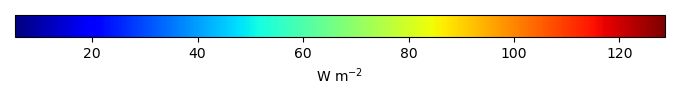
Period Mean (original grids) [W m-2] |
Model Period Mean (intersection) [W m-2] |
Benchmark Period Mean (intersection) [W m-2] |
Model Period Mean (complement) [W m-2] |
Benchmark Period Mean (complement) [W m-2] |
Bias [W m-2] |
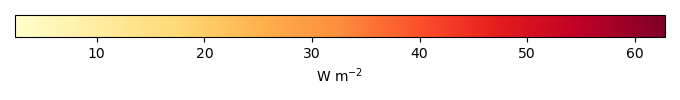
RMSE [W m-2] |
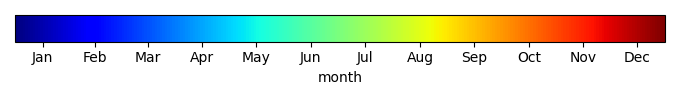
Phase Shift [months] |
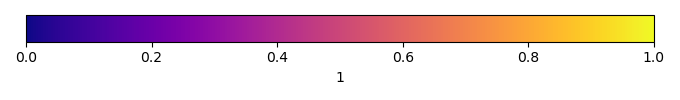
Bias Score [1] |
RMSE Score [1] |
Seasonal Cycle Score [1] |
Spatial Distribution Score [1] |
Overall Score [1] |
|||
|---|---|---|---|---|---|---|---|---|---|---|---|---|---|---|---|---|
| Benchmark | [-] | 29.7 | ||||||||||||||
| 271 | [-] | 37.2 | 36.9 | 30.2 | 10.9 | 7.25 | 11.0 | 1.86 | 0.361 | 0.544 | 0.733 | 0.960 | 0.629 | |||
| 330 | [-] | 37.0 | 36.6 | 30.1 | 10.9 | 7.21 | 10.7 | 1.95 | 0.379 | 0.557 | 0.704 | 0.970 | 0.633 | |||
| CMIP6_001 | [-] | 33.3 | 32.9 | 30.8 | 12.1 | 2.98 | 7.07 | 2.03 | 0.686 | 0.656 | 0.696 | 0.981 | 0.735 |
Download Data |
Period Mean (original grids) [W m-2] |
Model Period Mean (intersection) [W m-2] |
Benchmark Period Mean (intersection) [W m-2] |
Model Period Mean (complement) [W m-2] |
Benchmark Period Mean (complement) [W m-2] |
Bias [W m-2] |
RMSE [W m-2] |
Phase Shift [months] |
Bias Score [1] |
RMSE Score [1] |
Seasonal Cycle Score [1] |
Spatial Distribution Score [1] |
Overall Score [1] |
|||
|---|---|---|---|---|---|---|---|---|---|---|---|---|---|---|---|---|
| Benchmark | [-] | 43.8 | ||||||||||||||
| 271 | [-] | 45.0 | 45.5 | 43.9 | 11.9 | 0.585 | 10.3 | 1.46 | 0.577 | 0.423 | 0.786 | 0.954 | 0.633 | |||
| 330 | [-] | 45.1 | 45.6 | 43.9 | 11.9 | 0.605 | 10.2 | 1.35 | 0.580 | 0.434 | 0.802 | 0.962 | 0.642 | |||
| CMIP6_001 | [-] | 45.3 | 45.8 | 44.3 | 14.3 | 0.716 | 9.02 | 1.46 | 0.622 | 0.506 | 0.788 | 0.991 | 0.683 |
Download Data |
Period Mean (original grids) [W m-2] |
Model Period Mean (intersection) [W m-2] |
Benchmark Period Mean (intersection) [W m-2] |
Model Period Mean (complement) [W m-2] |
Benchmark Period Mean (complement) [W m-2] |
Bias [W m-2] |
RMSE [W m-2] |
Phase Shift [months] |
Bias Score [1] |
RMSE Score [1] |
Seasonal Cycle Score [1] |
Spatial Distribution Score [1] |
Overall Score [1] |
|||
|---|---|---|---|---|---|---|---|---|---|---|---|---|---|---|---|---|
| Benchmark | [-] | 33.2 | ||||||||||||||
| 271 | [-] | 39.7 | 39.7 | 33.3 | 14.1 | 6.24 | 9.38 | 1.45 | 0.452 | 0.643 | 0.785 | 0.922 | 0.689 | |||
| 330 | [-] | 39.7 | 39.7 | 33.4 | 14.1 | 6.00 | 9.02 | 1.41 | 0.477 | 0.657 | 0.795 | 0.940 | 0.705 | |||
| CMIP6_001 | [-] | 36.0 | 36.0 | 33.8 | 16.0 | 2.13 | 8.24 | 1.64 | 0.562 | 0.633 | 0.746 | 0.937 | 0.702 |
Download Data |
Period Mean (original grids) [W m-2] |
Model Period Mean (intersection) [W m-2] |
Benchmark Period Mean (intersection) [W m-2] |
Model Period Mean (complement) [W m-2] |
Benchmark Period Mean (complement) [W m-2] |
Bias [W m-2] |
RMSE [W m-2] |
Phase Shift [months] |
Bias Score [1] |
RMSE Score [1] |
Seasonal Cycle Score [1] |
Spatial Distribution Score [1] |
Overall Score [1] |
|||
|---|---|---|---|---|---|---|---|---|---|---|---|---|---|---|---|---|
| Benchmark | [-] | 39.0 | ||||||||||||||
| 271 | [-] | 43.5 | 43.5 | 39.2 | 38.4 | 4.54 | 12.9 | 0.179 | 0.638 | 0.642 | 0.988 | 0.972 | 0.776 | |||
| 330 | [-] | 45.0 | 44.9 | 39.1 | 36.7 | 6.29 | 13.3 | 0.185 | 0.602 | 0.646 | 0.987 | 0.979 | 0.772 | |||
| CMIP6_001 | [-] | 37.2 | 37.2 | 39.6 | 34.7 | -1.98 | 15.3 | 0.270 | 0.495 | 0.554 | 0.982 | 0.923 | 0.702 |
Download Data |
Period Mean (original grids) [W m-2] |
Model Period Mean (intersection) [W m-2] |
Benchmark Period Mean (intersection) [W m-2] |
Model Period Mean (complement) [W m-2] |
Benchmark Period Mean (complement) [W m-2] |
Bias [W m-2] |
RMSE [W m-2] |
Phase Shift [months] |
Bias Score [1] |
RMSE Score [1] |
Seasonal Cycle Score [1] |
Spatial Distribution Score [1] |
Overall Score [1] |
|||
|---|---|---|---|---|---|---|---|---|---|---|---|---|---|---|---|---|
| Benchmark | [-] | 18.1 | ||||||||||||||
| 271 | [-] | 34.4 | 34.3 | 18.5 | 12.2 | 16.5 | 16.9 | 2.06 | 0.0646 | 0.713 | 0.686 | 0.223 | 0.480 | |||
| 330 | [-] | 33.3 | 33.3 | 18.5 | 12.2 | 15.5 | 15.9 | 2.06 | 0.105 | 0.734 | 0.688 | 0.268 | 0.506 | |||
| CMIP6_001 | [-] | 26.1 | 26.0 | 19.7 | 13.0 | 7.23 | 8.82 | 1.98 | 0.425 | 0.771 | 0.698 | 0.463 | 0.626 |
Download Data |
Period Mean (original grids) [W m-2] |
Model Period Mean (intersection) [W m-2] |
Benchmark Period Mean (intersection) [W m-2] |
Model Period Mean (complement) [W m-2] |
Benchmark Period Mean (complement) [W m-2] |
Bias [W m-2] |
RMSE [W m-2] |
Phase Shift [months] |
Bias Score [1] |
RMSE Score [1] |
Seasonal Cycle Score [1] |
Spatial Distribution Score [1] |
Overall Score [1] |
|||
|---|---|---|---|---|---|---|---|---|---|---|---|---|---|---|---|---|
| Benchmark | [-] | 25.9 | ||||||||||||||
| 271 | [-] | 31.8 | 31.7 | 26.3 | 23.3 | 5.22 | 11.8 | 0.348 | 0.481 | 0.496 | 0.961 | 0.967 | 0.680 | |||
| 330 | [-] | 28.7 | 28.6 | 25.9 | 22.4 | 2.58 | 7.56 | 0.308 | 0.655 | 0.667 | 0.965 | 0.986 | 0.788 | |||
| CMIP6_001 | [-] | 23.9 | 23.7 | 26.2 | 21.0 | -2.71 | 7.80 | 0.289 | 0.601 | 0.643 | 0.968 | 0.991 | 0.769 |
Download Data |
Period Mean (original grids) [W m-2] |
Model Period Mean (intersection) [W m-2] |
Benchmark Period Mean (intersection) [W m-2] |
Model Period Mean (complement) [W m-2] |
Benchmark Period Mean (complement) [W m-2] |
Bias [W m-2] |
RMSE [W m-2] |
Phase Shift [months] |
Bias Score [1] |
RMSE Score [1] |
Seasonal Cycle Score [1] |
Spatial Distribution Score [1] |
Overall Score [1] |
|||
|---|---|---|---|---|---|---|---|---|---|---|---|---|---|---|---|---|
| Benchmark | [-] | 34.3 | ||||||||||||||
| 271 | [-] | 41.8 | 41.8 | 34.4 | 8.42 | 6.28 | 13.4 | 1.15 | 0.379 | 0.449 | 0.847 | 0.986 | 0.622 | |||
| 330 | [-] | 42.0 | 42.0 | 34.3 | 8.47 | 6.50 | 12.6 | 1.04 | 0.376 | 0.491 | 0.871 | 0.987 | 0.643 | |||
| CMIP6_001 | [-] | 40.0 | 39.9 | 34.7 | 9.64 | 4.05 | 12.0 | 1.09 | 0.492 | 0.488 | 0.859 | 0.980 | 0.661 |
Download Data |
Period Mean (original grids) [W m-2] |
Model Period Mean (intersection) [W m-2] |
Benchmark Period Mean (intersection) [W m-2] |
Model Period Mean (complement) [W m-2] |
Benchmark Period Mean (complement) [W m-2] |
Bias [W m-2] |
RMSE [W m-2] |
Phase Shift [months] |
Bias Score [1] |
RMSE Score [1] |
Seasonal Cycle Score [1] |
Spatial Distribution Score [1] |
Overall Score [1] |
|||
|---|---|---|---|---|---|---|---|---|---|---|---|---|---|---|---|---|
| Benchmark | [-] | 27.4 | ||||||||||||||
| 271 | [-] | 40.7 | 40.6 | 27.9 | 12.6 | 11.8 | 14.1 | 0.951 | 0.196 | 0.489 | 0.892 | 0.984 | 0.610 | |||
| 330 | [-] | 40.6 | 40.5 | 27.6 | 12.6 | 12.0 | 14.1 | 0.886 | 0.189 | 0.496 | 0.899 | 0.984 | 0.613 | |||
| CMIP6_001 | [-] | 36.2 | 36.2 | 28.7 | 13.2 | 6.69 | 9.52 | 1.03 | 0.468 | 0.617 | 0.884 | 0.932 | 0.704 |
Download Data |
Period Mean (original grids) [W m-2] |
Model Period Mean (intersection) [W m-2] |
Benchmark Period Mean (intersection) [W m-2] |
Model Period Mean (complement) [W m-2] |
Benchmark Period Mean (complement) [W m-2] |
Bias [W m-2] |
RMSE [W m-2] |
Phase Shift [months] |
Bias Score [1] |
RMSE Score [1] |
Seasonal Cycle Score [1] |
Spatial Distribution Score [1] |
Overall Score [1] |
|||
|---|---|---|---|---|---|---|---|---|---|---|---|---|---|---|---|---|
| Benchmark | [-] | 34.8 | ||||||||||||||
| 271 | [-] | 42.1 | 41.9 | 35.6 | 22.9 | 6.67 | 16.0 | 0.253 | 0.494 | 0.470 | 0.983 | 0.951 | 0.674 | |||
| 330 | [-] | 42.9 | 42.6 | 34.9 | 21.5 | 8.16 | 16.3 | 0.224 | 0.441 | 0.489 | 0.985 | 0.994 | 0.679 | |||
| CMIP6_001 | [-] | 39.3 | 39.1 | 35.4 | 35.5 | 4.00 | 18.7 | 0.372 | 0.487 | 0.391 | 0.975 | 0.939 | 0.637 |
Download Data |
Period Mean (original grids) [W m-2] |
Model Period Mean (intersection) [W m-2] |
Benchmark Period Mean (intersection) [W m-2] |
Model Period Mean (complement) [W m-2] |
Benchmark Period Mean (complement) [W m-2] |
Bias [W m-2] |
RMSE [W m-2] |
Phase Shift [months] |
Bias Score [1] |
RMSE Score [1] |
Seasonal Cycle Score [1] |
Spatial Distribution Score [1] |
Overall Score [1] |
|||
|---|---|---|---|---|---|---|---|---|---|---|---|---|---|---|---|---|
| Benchmark | [-] | 36.2 | ||||||||||||||
| 271 | [-] | 40.9 | 41.0 | 36.3 | 12.0 | 3.56 | 8.01 | 0.653 | 0.644 | 0.772 | 0.949 | 0.748 | 0.777 | |||
| 330 | [-] | 42.1 | 42.1 | 36.7 | 12.0 | 4.17 | 7.94 | 0.594 | 0.636 | 0.789 | 0.954 | 0.796 | 0.793 | |||
| CMIP6_001 | [-] | 39.7 | 39.7 | 37.7 | 13.3 | 1.15 | 6.49 | 0.463 | 0.660 | 0.811 | 0.960 | 0.911 | 0.831 |
Download Data |
Period Mean (original grids) [W m-2] |
Model Period Mean (intersection) [W m-2] |
Benchmark Period Mean (intersection) [W m-2] |
Model Period Mean (complement) [W m-2] |
Benchmark Period Mean (complement) [W m-2] |
Bias [W m-2] |
RMSE [W m-2] |
Phase Shift [months] |
Bias Score [1] |
RMSE Score [1] |
Seasonal Cycle Score [1] |
Spatial Distribution Score [1] |
Overall Score [1] |
|||
|---|---|---|---|---|---|---|---|---|---|---|---|---|---|---|---|---|
| Benchmark | [-] | 19.2 | ||||||||||||||
| 271 | [-] | 27.6 | 27.6 | 19.3 | 8.97 | 8.24 | 11.6 | 0.578 | 0.301 | 0.494 | 0.935 | 0.890 | 0.623 | |||
| 330 | [-] | 26.9 | 26.9 | 19.3 | 9.00 | 7.79 | 10.8 | 0.481 | 0.327 | 0.566 | 0.953 | 0.888 | 0.660 | |||
| CMIP6_001 | [-] | 23.6 | 23.7 | 20.0 | 10.4 | 3.87 | 8.07 | 0.956 | 0.530 | 0.592 | 0.890 | 0.976 | 0.716 |
Download Data |
Period Mean (original grids) [W m-2] |
Model Period Mean (intersection) [W m-2] |
Benchmark Period Mean (intersection) [W m-2] |
Model Period Mean (complement) [W m-2] |
Benchmark Period Mean (complement) [W m-2] |
Bias [W m-2] |
RMSE [W m-2] |
Phase Shift [months] |
Bias Score [1] |
RMSE Score [1] |
Seasonal Cycle Score [1] |
Spatial Distribution Score [1] |
Overall Score [1] |
|||
|---|---|---|---|---|---|---|---|---|---|---|---|---|---|---|---|---|
| Benchmark | [-] | 43.0 | ||||||||||||||
| 271 | [-] | 52.2 | 52.2 | 43.4 | 15.4 | 7.46 | 12.8 | 0.868 | 0.401 | 0.572 | 0.889 | 0.992 | 0.685 | |||
| 330 | [-] | 51.9 | 51.9 | 43.3 | 15.3 | 7.33 | 12.2 | 0.809 | 0.418 | 0.603 | 0.898 | 0.992 | 0.703 | |||
| CMIP6_001 | [-] | 48.6 | 48.6 | 44.4 | 18.5 | 3.08 | 10.4 | 0.915 | 0.538 | 0.601 | 0.882 | 0.993 | 0.723 |
Download Data |
Period Mean (original grids) [W m-2] |
Model Period Mean (intersection) [W m-2] |
Benchmark Period Mean (intersection) [W m-2] |
Model Period Mean (complement) [W m-2] |
Benchmark Period Mean (complement) [W m-2] |
Bias [W m-2] |
RMSE [W m-2] |
Phase Shift [months] |
Bias Score [1] |
RMSE Score [1] |
Seasonal Cycle Score [1] |
Spatial Distribution Score [1] |
Overall Score [1] |
|||
|---|---|---|---|---|---|---|---|---|---|---|---|---|---|---|---|---|
| Benchmark | [-] | 72.3 | ||||||||||||||
| 271 | [-] | 84.9 | 84.7 | 72.9 | 13.0 | 8.98 | 14.6 | 0.709 | 0.443 | 0.679 | 0.931 | 0.965 | 0.739 | |||
| 330 | [-] | 85.4 | 85.2 | 72.6 | 12.9 | 9.75 | 14.6 | 0.621 | 0.435 | 0.696 | 0.937 | 0.969 | 0.747 | |||
| CMIP6_001 | [-] | 84.7 | 84.4 | 74.7 | 17.8 | 7.42 | 13.5 | 0.822 | 0.433 | 0.699 | 0.918 | 0.988 | 0.747 |
Download Data |
Period Mean (original grids) [W m-2] |
Model Period Mean (intersection) [W m-2] |
Benchmark Period Mean (intersection) [W m-2] |
Model Period Mean (complement) [W m-2] |
Benchmark Period Mean (complement) [W m-2] |
Bias [W m-2] |
RMSE [W m-2] |
Phase Shift [months] |
Bias Score [1] |
RMSE Score [1] |
Seasonal Cycle Score [1] |
Spatial Distribution Score [1] |
Overall Score [1] |
|||
|---|---|---|---|---|---|---|---|---|---|---|---|---|---|---|---|---|
| Benchmark | [-] | 43.3 | ||||||||||||||
| 271 | [-] | 47.9 | 47.9 | 43.6 | 46.9 | 5.56 | 16.0 | 0.158 | 0.466 | 0.481 | 0.988 | 0.982 | 0.680 | |||
| 330 | [-] | 47.7 | 47.7 | 43.3 | 45.4 | 6.12 | 16.1 | 0.170 | 0.459 | 0.498 | 0.987 | 0.958 | 0.680 | |||
| CMIP6_001 | [-] | 43.4 | 43.3 | 43.7 | 41.8 | 0.851 | 18.3 | 0.228 | 0.444 | 0.403 | 0.984 | 0.885 | 0.624 |
Download Data |
Period Mean (original grids) [W m-2] |
Model Period Mean (intersection) [W m-2] |
Benchmark Period Mean (intersection) [W m-2] |
Model Period Mean (complement) [W m-2] |
Benchmark Period Mean (complement) [W m-2] |
Bias [W m-2] |
RMSE [W m-2] |
Phase Shift [months] |
Bias Score [1] |
RMSE Score [1] |
Seasonal Cycle Score [1] |
Spatial Distribution Score [1] |
Overall Score [1] |
|||
|---|---|---|---|---|---|---|---|---|---|---|---|---|---|---|---|---|
| Benchmark | [-] | 25.7 | ||||||||||||||
| 271 | [-] | 38.4 | 38.4 | 26.5 | 11.2 | 11.7 | 14.1 | 0.940 | 0.312 | 0.677 | 0.877 | 0.468 | 0.602 | |||
| 330 | [-] | 38.7 | 38.7 | 26.2 | 11.2 | 11.9 | 13.9 | 0.973 | 0.318 | 0.683 | 0.879 | 0.543 | 0.621 | |||
| CMIP6_001 | [-] | 34.9 | 34.9 | 28.4 | 13.7 | 5.99 | 10.3 | 0.929 | 0.436 | 0.698 | 0.894 | 0.711 | 0.687 |
Download Data |
Period Mean (original grids) [W m-2] |
Model Period Mean (intersection) [W m-2] |
Benchmark Period Mean (intersection) [W m-2] |
Model Period Mean (complement) [W m-2] |
Benchmark Period Mean (complement) [W m-2] |
Bias [W m-2] |
RMSE [W m-2] |
Phase Shift [months] |
Bias Score [1] |
RMSE Score [1] |
Seasonal Cycle Score [1] |
Spatial Distribution Score [1] |
Overall Score [1] |
|||
|---|---|---|---|---|---|---|---|---|---|---|---|---|---|---|---|---|
| Benchmark | [-] | 25.7 | ||||||||||||||
| 271 | [-] | 35.7 | 35.6 | 26.0 | 11.1 | 9.18 | 10.1 | 0.741 | 0.131 | 0.671 | 0.901 | 0.829 | 0.641 | |||
| 330 | [-] | 36.0 | 35.9 | 25.9 | 11.0 | 9.51 | 10.5 | 0.781 | 0.111 | 0.660 | 0.899 | 0.855 | 0.637 | |||
| CMIP6_001 | [-] | 31.8 | 31.6 | 26.5 | 12.2 | 4.77 | 7.46 | 1.07 | 0.457 | 0.573 | 0.863 | 0.992 | 0.691 |
Download Data |
Period Mean (original grids) [W m-2] |
Model Period Mean (intersection) [W m-2] |
Benchmark Period Mean (intersection) [W m-2] |
Model Period Mean (complement) [W m-2] |
Benchmark Period Mean (complement) [W m-2] |
Bias [W m-2] |
RMSE [W m-2] |
Phase Shift [months] |
Bias Score [1] |
RMSE Score [1] |
Seasonal Cycle Score [1] |
Spatial Distribution Score [1] |
Overall Score [1] |
|||
|---|---|---|---|---|---|---|---|---|---|---|---|---|---|---|---|---|
| Benchmark | [-] | 24.6 | ||||||||||||||
| 271 | [-] | 33.2 | 33.4 | 24.5 | 8.02 | 8.43 | 12.6 | 0.403 | 0.261 | 0.460 | 0.960 | 0.979 | 0.624 | |||
| 330 | [-] | 30.4 | 30.6 | 24.6 | 8.10 | 5.78 | 10.1 | 0.394 | 0.412 | 0.526 | 0.957 | 0.977 | 0.680 | |||
| CMIP6_001 | [-] | 24.3 | 24.5 | 25.2 | 10.9 | -0.724 | 9.23 | 0.335 | 0.495 | 0.491 | 0.963 | 0.962 | 0.680 |
Download Data |
Period Mean (original grids) [W m-2] |
Model Period Mean (intersection) [W m-2] |
Benchmark Period Mean (intersection) [W m-2] |
Model Period Mean (complement) [W m-2] |
Benchmark Period Mean (complement) [W m-2] |
Bias [W m-2] |
RMSE [W m-2] |
Phase Shift [months] |
Bias Score [1] |
RMSE Score [1] |
Seasonal Cycle Score [1] |
Spatial Distribution Score [1] |
Overall Score [1] |
|||
|---|---|---|---|---|---|---|---|---|---|---|---|---|---|---|---|---|
| Benchmark | [-] | 38.5 | ||||||||||||||
| 271 | [-] | 43.2 | 43.2 | 38.8 | 10.5 | 4.00 | 9.95 | 1.07 | 0.488 | 0.552 | 0.844 | 0.959 | 0.679 | |||
| 330 | [-] | 42.7 | 42.7 | 38.6 | 10.6 | 3.72 | 8.77 | 1.00 | 0.503 | 0.599 | 0.858 | 0.949 | 0.702 | |||
| CMIP6_001 | [-] | 39.9 | 39.9 | 39.1 | 13.7 | 0.465 | 8.39 | 1.18 | 0.591 | 0.567 | 0.839 | 0.992 | 0.711 |
Download Data |
Period Mean (original grids) [W m-2] |
Model Period Mean (intersection) [W m-2] |
Benchmark Period Mean (intersection) [W m-2] |
Model Period Mean (complement) [W m-2] |
Benchmark Period Mean (complement) [W m-2] |
Bias [W m-2] |
RMSE [W m-2] |
Phase Shift [months] |
Bias Score [1] |
RMSE Score [1] |
Seasonal Cycle Score [1] |
Spatial Distribution Score [1] |
Overall Score [1] |
|||
|---|---|---|---|---|---|---|---|---|---|---|---|---|---|---|---|---|
| Benchmark | [-] | 26.2 | ||||||||||||||
| 271 | [-] | 35.6 | 35.6 | 26.3 | 10.6 | 9.36 | 10.6 | 1.87 | 0.212 | 0.615 | 0.739 | 0.811 | 0.598 | |||
| 330 | [-] | 35.9 | 35.9 | 26.3 | 10.6 | 9.68 | 10.7 | 1.66 | 0.163 | 0.631 | 0.774 | 0.835 | 0.607 | |||
| CMIP6_001 | [-] | 28.9 | 28.9 | 26.6 | 11.9 | 2.56 | 5.11 | 1.92 | 0.703 | 0.669 | 0.729 | 0.879 | 0.730 |
Download Data |
Period Mean (original grids) [W m-2] |
Model Period Mean (intersection) [W m-2] |
Benchmark Period Mean (intersection) [W m-2] |
Model Period Mean (complement) [W m-2] |
Benchmark Period Mean (complement) [W m-2] |
Bias [W m-2] |
RMSE [W m-2] |
Phase Shift [months] |
Bias Score [1] |
RMSE Score [1] |
Seasonal Cycle Score [1] |
Spatial Distribution Score [1] |
Overall Score [1] |
|||
|---|---|---|---|---|---|---|---|---|---|---|---|---|---|---|---|---|
| Benchmark | [-] | 30.6 | ||||||||||||||
| 271 | [-] | 37.9 | 37.8 | 30.7 | 11.8 | 6.92 | 8.55 | 1.26 | 0.403 | 0.657 | 0.848 | 0.711 | 0.655 | |||
| 330 | [-] | 36.9 | 36.9 | 30.8 | 11.8 | 5.84 | 7.89 | 1.04 | 0.492 | 0.668 | 0.872 | 0.546 | 0.649 | |||
| CMIP6_001 | [-] | 34.3 | 34.3 | 31.1 | 12.3 | 3.00 | 6.61 | 1.40 | 0.658 | 0.580 | 0.804 | 0.904 | 0.705 |
Download Data |
Period Mean (original grids) [W m-2] |
Model Period Mean (intersection) [W m-2] |
Benchmark Period Mean (intersection) [W m-2] |
Model Period Mean (complement) [W m-2] |
Benchmark Period Mean (complement) [W m-2] |
Bias [W m-2] |
RMSE [W m-2] |
Phase Shift [months] |
Bias Score [1] |
RMSE Score [1] |
Seasonal Cycle Score [1] |
Spatial Distribution Score [1] |
Overall Score [1] |
|||
|---|---|---|---|---|---|---|---|---|---|---|---|---|---|---|---|---|
| Benchmark | [-] | 29.5 | ||||||||||||||
| 271 | [-] | 34.0 | 33.9 | 29.9 | 12.3 | 4.12 | 10.7 | 0.889 | 0.454 | 0.669 | 0.896 | 0.954 | 0.728 | |||
| 330 | [-] | 34.6 | 34.5 | 29.7 | 12.3 | 4.84 | 11.1 | 0.860 | 0.436 | 0.653 | 0.904 | 0.953 | 0.720 | |||
| CMIP6_001 | [-] | 34.7 | 34.7 | 31.4 | 14.0 | 2.30 | 8.65 | 0.941 | 0.530 | 0.663 | 0.885 | 0.976 | 0.744 |
Temporally integrated period mean