 b.e15.B5505C5WCCML45BGCR.f09_g16.control.EM1-20
and
OBS data (info)
b.e15.B5505C5WCCML45BGCR.f09_g16.control.EM1-20
and
OBS data (info)
DIAG WSET3 - WAWG vertical profile seasonal cycle plots for selected latitude bands
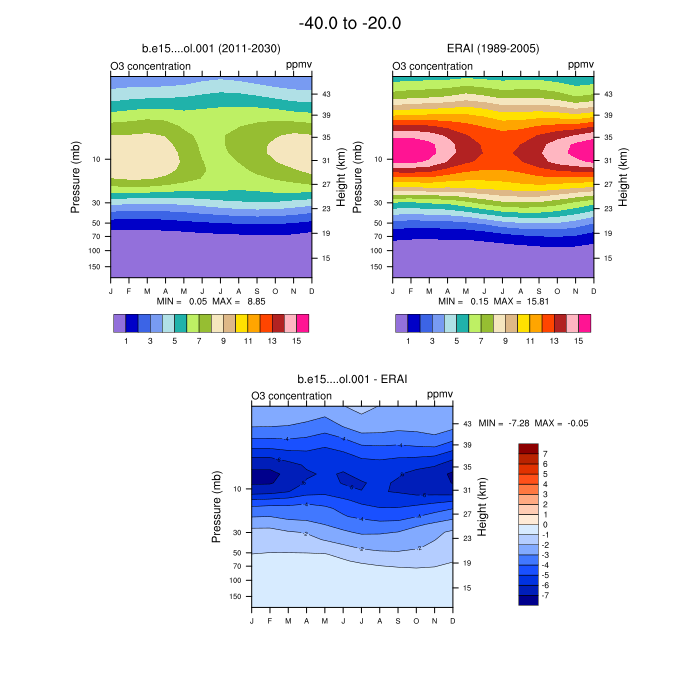
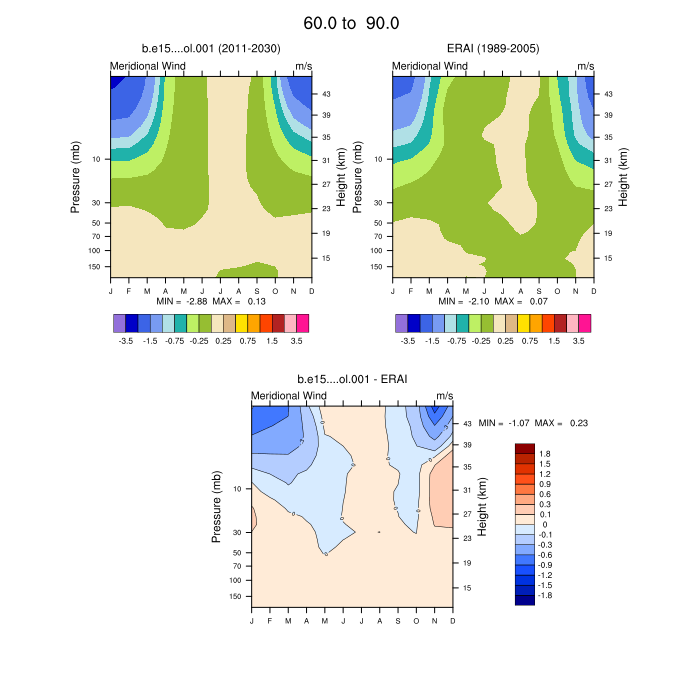
| ERA-Interim Reanalysis 1989-2005 | 60S-90S | 55S-65S | 20S-40S | 10S-10N | 20N-40N | 55N-65N | 60N-90N | |||
|---|---|---|---|---|---|---|---|---|---|---|
| Stratosphere | ||||||||||
| H2O | Water Vapor | plot | plot | plot | plot | plot | plot | plot | ||
| O3 | Ozone | plot | plot | plot | plot | plot | plot | plot | ||
| RELHUM | Relative Humidity | plot | plot | plot | plot | plot | plot | plot | ||
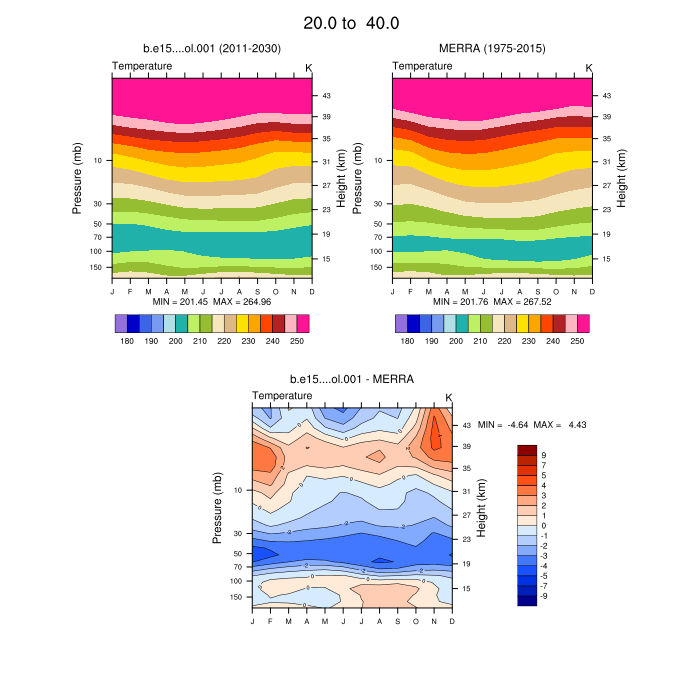
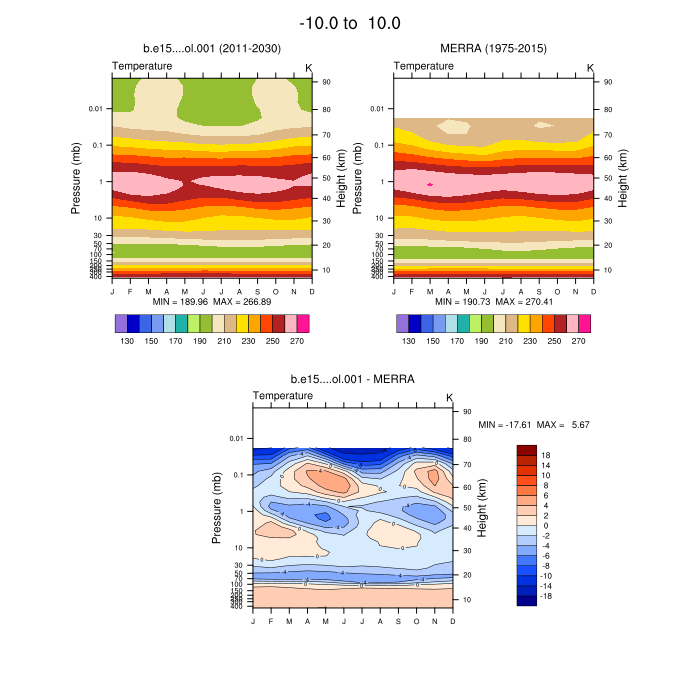
| T | Temperature | plot | plot | plot | plot | plot | plot | plot | ||
| U | Zonal Wind | plot | plot | plot | plot | plot | plot | plot | ||
| V | Meridional Wind | plot | plot | plot | plot | plot | plot | plot | ||
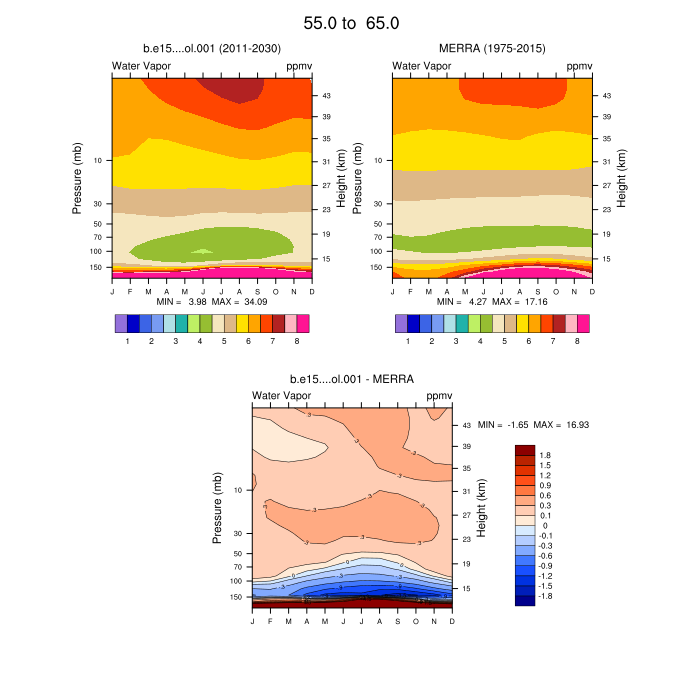
| MERRA Reanalysis 1975-2015 | 60S-90S | 55S-65S | 20S-40S | 10S-10N | 20N-40N | 55N-65N | 60N-90N | |||
| Stratosphere | ||||||||||
| H2O | Water Vapor | plot | plot | plot | plot | plot | plot | plot | ||
| T | Temperature | plot | plot | plot | plot | plot | plot | plot | ||
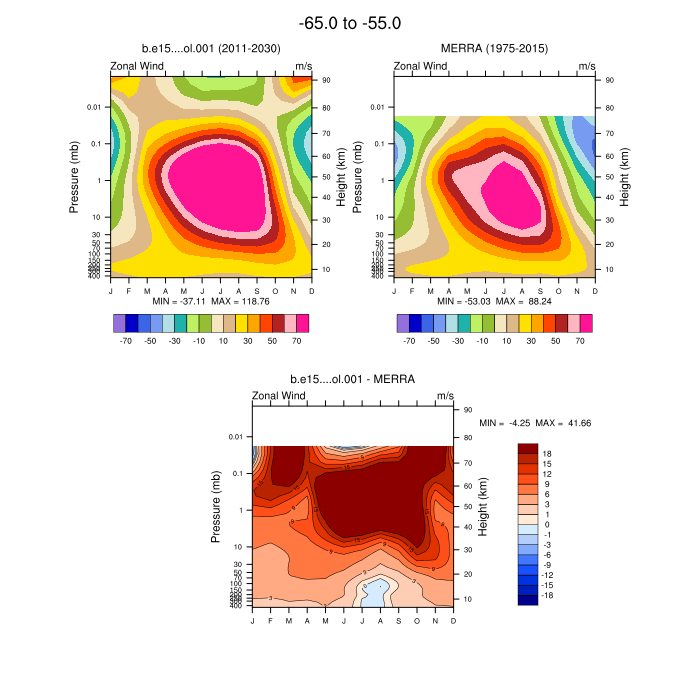
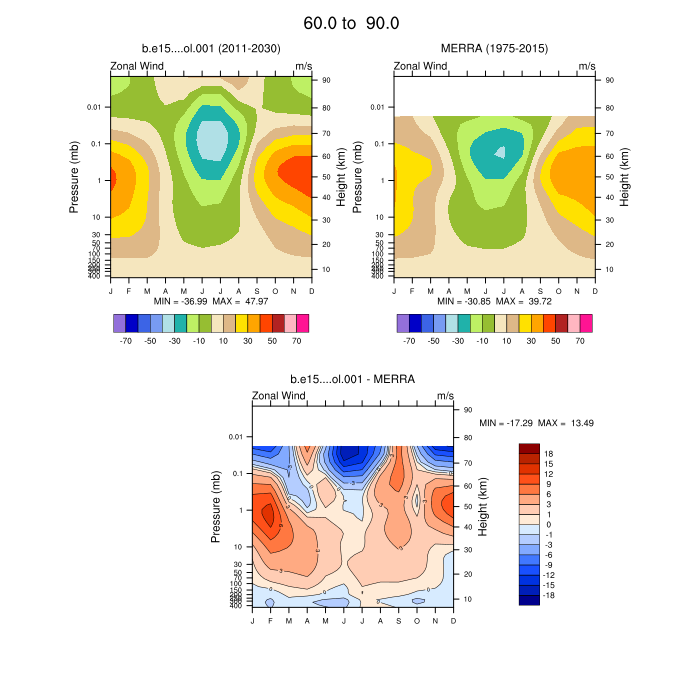
| U | Zonal Wind | plot | plot | plot | plot | plot | plot | plot | ||
| V | Meridional Wind | plot | plot | plot | plot | plot | plot | plot | ||
| Middle Atmosphere | ||||||||||
| H2O | Water Vapor | plot | plot | plot | plot | plot | plot | plot | ||
| T | Temperature | plot | plot | plot | plot | plot | plot | plot | ||
| U | Zonal Wind | plot | plot | plot | plot | plot | plot | plot | ||
| V | Meridional Wind | plot | plot | plot | plot | plot | plot | plot | ||
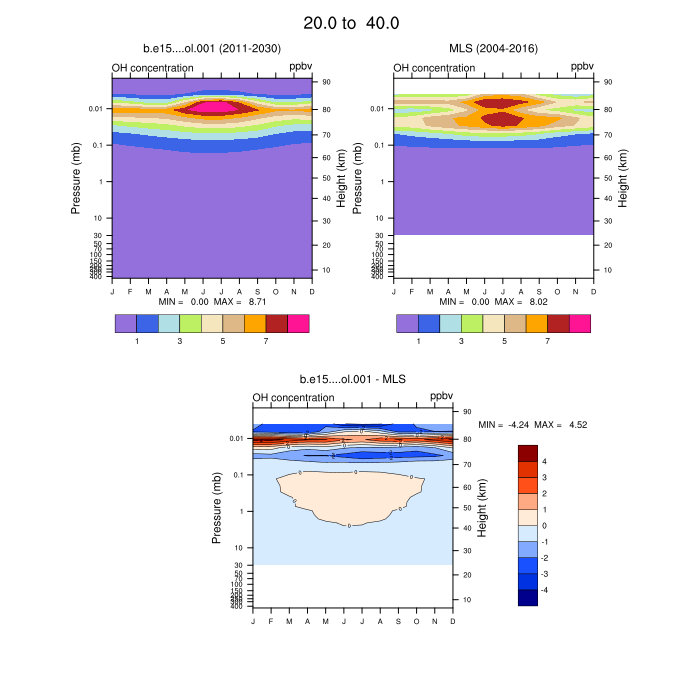
| MLS 2004-2016 | 60S-90S | 55S-65S | 20S-40S | 10S-10N | 20N-40N | 55N-65N | 60N-90N | |||
| Stratosphere | ||||||||||
| CH3Cl | Methyl Chloride | plot | plot | plot | plot | plot | plot | plot | ||
| ClO | Chlorine Monoxide | plot | plot | plot | plot | plot | plot | plot | ||
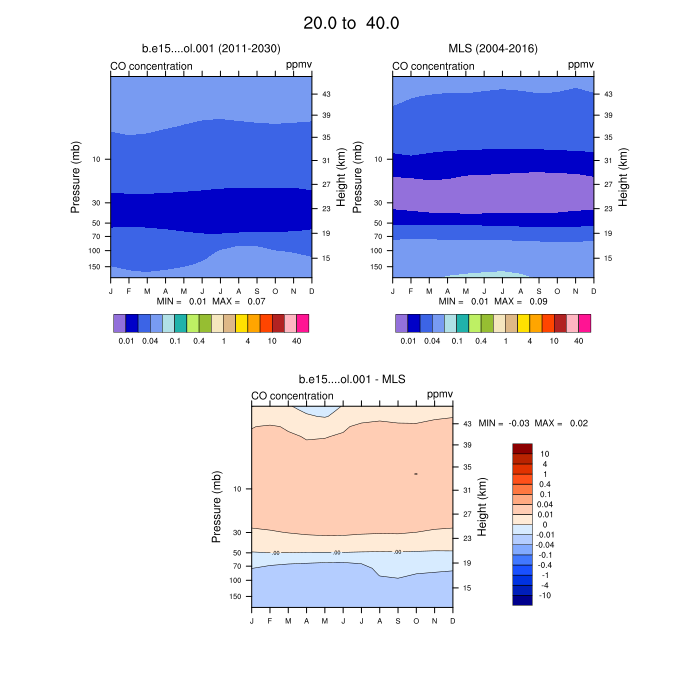
| CO | Carbon Monoxide | plot | plot | plot | plot | plot | plot | plot | ||
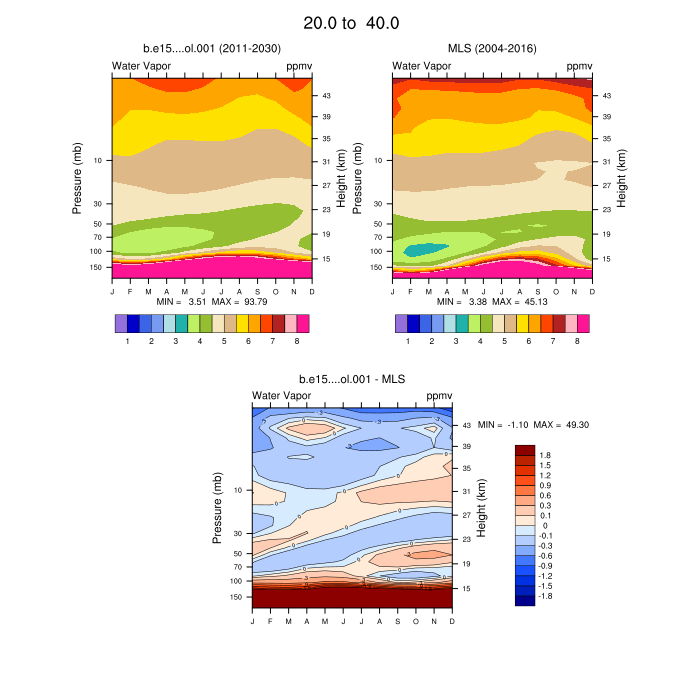
| H2O | Water Vapor | plot | plot | plot | plot | plot | plot | plot | ||
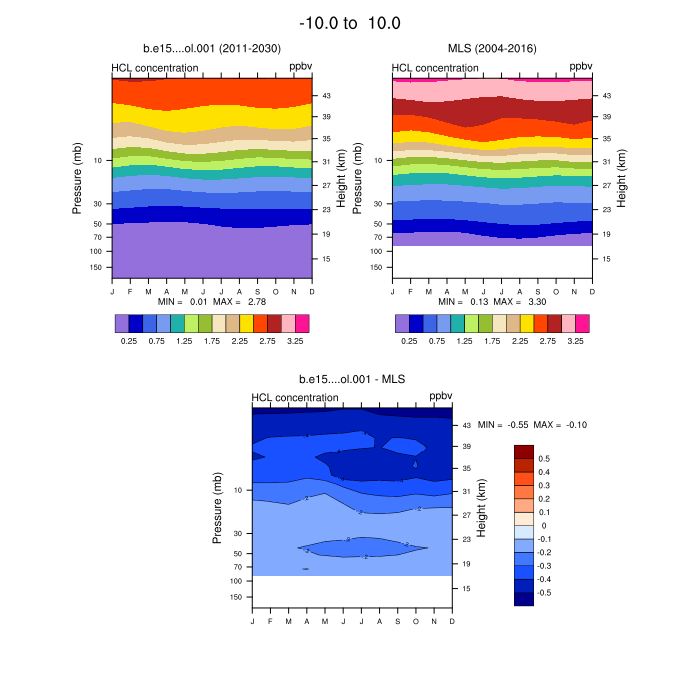
| HCl | Hydrochloric Acid | plot | plot | plot | plot | plot | plot | plot | ||
| HNO3 | Nitric Acid | plot | plot | plot | plot | plot | plot | plot | ||
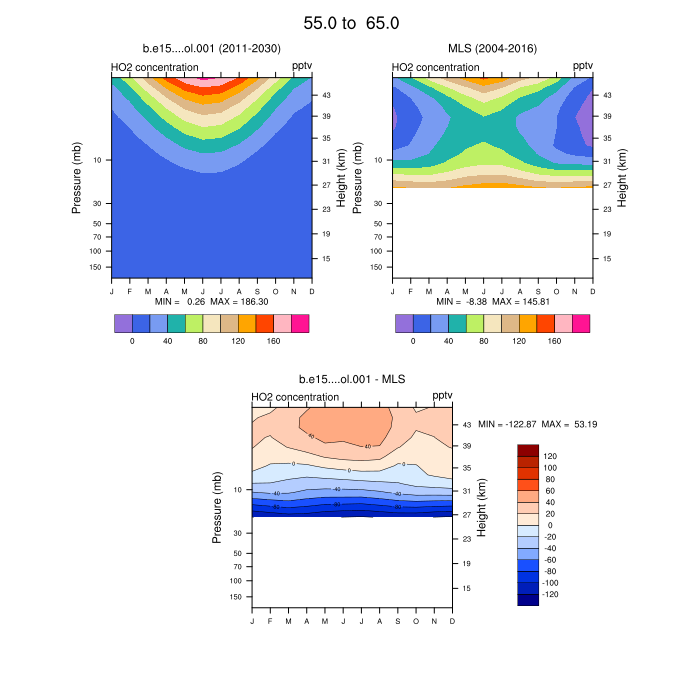
| HO2 | Hydroperoxyl | plot | plot | plot | plot | plot | plot | plot | ||
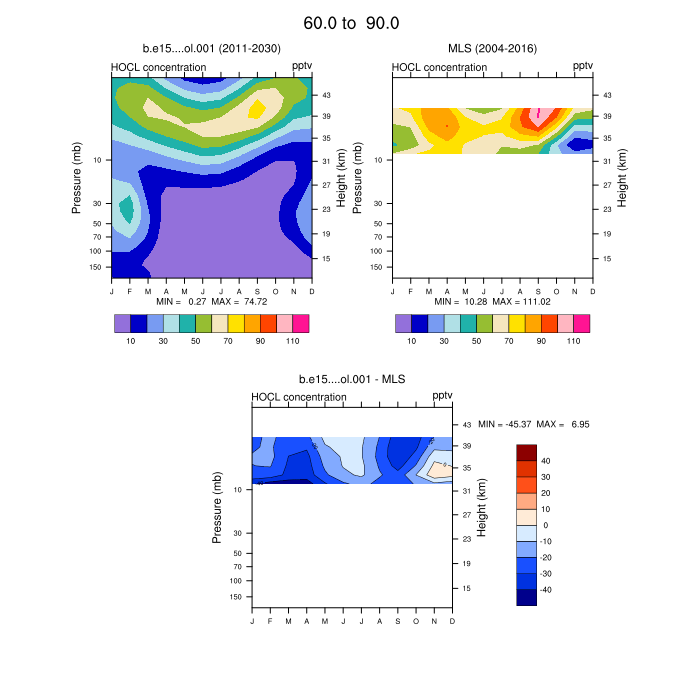
| HOCl | Chlorine Hydroxide | plot | plot | plot | plot | plot | plot | plot | ||
| N2O | Nitrous Oxide | plot | plot | plot | plot | plot | plot | plot | ||
| O3 | Ozone | plot | plot | plot | plot | plot | plot | plot | ||
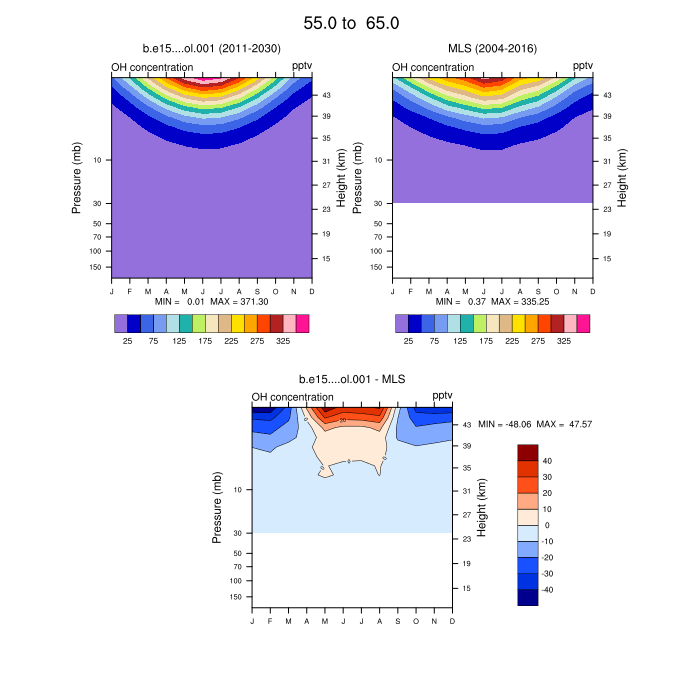
| OH | Hydroxyl | plot | plot | plot | plot | plot | plot | plot | ||
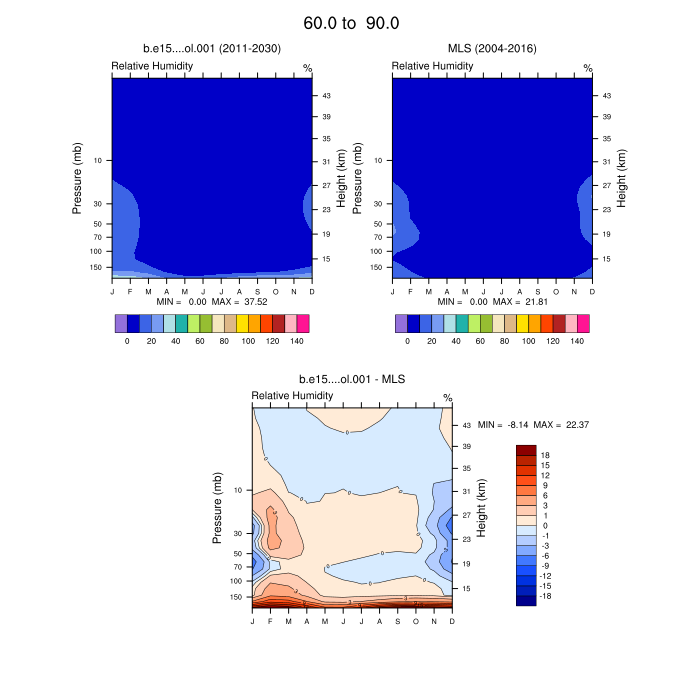
| RELHUM | Relative Humidity | plot | plot | plot | plot | plot | plot | plot | ||
| T | Temperature | plot | plot | plot | plot | plot | plot | plot | ||
| Z3 | Geopotential Height | plot | plot | plot | plot | plot | plot | plot | ||
| Middle Atmosphere | ||||||||||
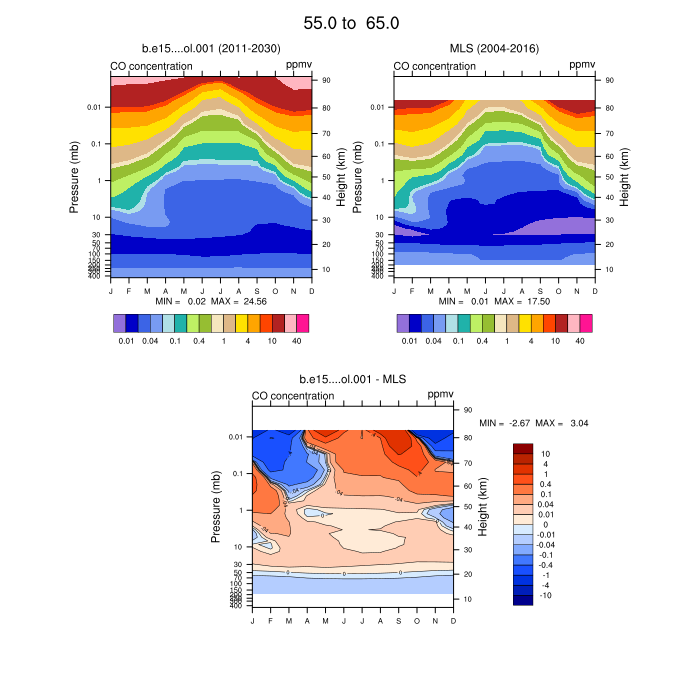
| CO | Carbon Monoxide | plot | plot | plot | plot | plot | plot | plot | ||
| H2O | Water Vapor | plot | plot | plot | plot | plot | plot | plot | ||
| HO2 | Hydroperoxyl | plot | plot | plot | plot | plot | plot | plot | ||
| O3 | Ozone | plot | plot | plot | plot | plot | plot | plot | ||
| OH | Hydroxyl | plot | plot | plot | plot | plot | plot | plot | ||
| RELHUM | Relative Humidity | plot | plot | plot | plot | plot | plot | plot | ||
| T | Temperature | plot | plot | plot | plot | plot | plot | plot | ||
| Z3 | Geopotential Height | plot | plot | plot | plot | plot | plot | plot |