 b.e21.BW1850.f09_g17.CMIP6-piControl.001
and
b.e20.B1850.f09_g17.pi_control.all.299
b.e21.BW1850.f09_g17.CMIP6-piControl.001
and
b.e20.B1850.f09_g17.pi_control.all.299
DIAG WSET2 - WAWG seasonal cycle line plots
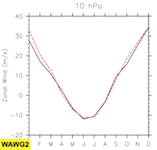
| 10 hPa | 60S-90S | 55S-65S | 10S-10N | 55N-65N | 60N-90N | |||
|---|---|---|---|---|---|---|---|---|
| U | Zonal Wind | plot | plot | plot | plot | plot | ||
| 85 hPa | 60S-90S | 55S-65S | 10S-10N | 55N-65N | 60N-90N | |||
| H2O | Water Vapor | plot | plot | plot | plot | plot | ||
| T | Temperature | plot | plot | plot | plot | plot | ||
| Tropopause | 60S-90S | 55S-65S | 10S-10N | 55N-65N | 60N-90N | |||
| T | Temperature | plot | plot | plot | plot | plot | ||
| Mesopause | 60S-90S | 55S-65S | 10S-10N | 55N-65N | 60N-90N | |||
| T | Temperature | plot | plot | plot | plot | plot | ||