cam6_3_015.clubb_F2000climo_ne30pg3_ne30pg3_mg17_1800pes_210404_3macmic_deepcunl_2yrs
and
cam6_3_015_F2000climo_ne30pg3_ne30pg3_mg17_1800pes_210401_3macmic_5yrs
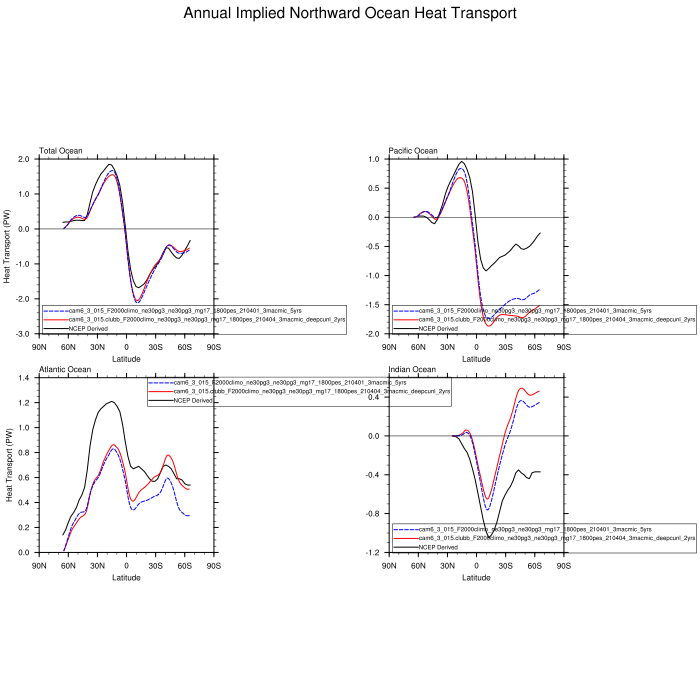
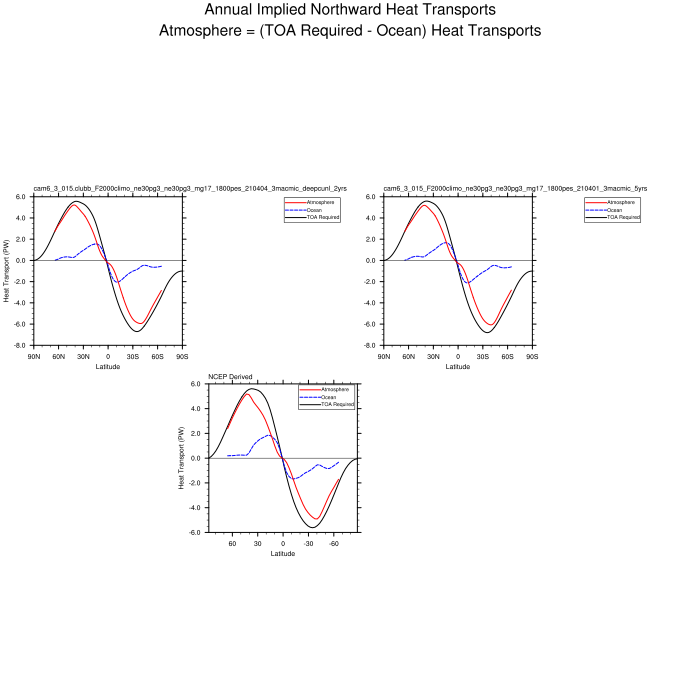
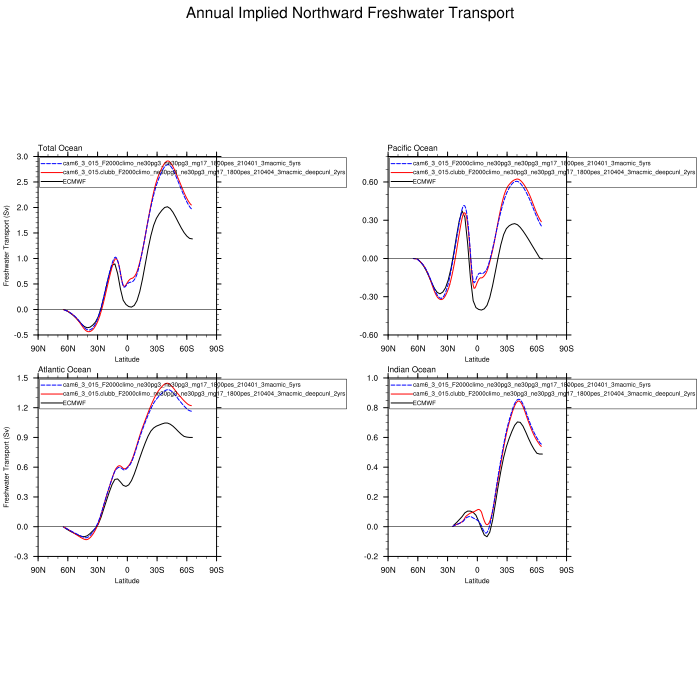
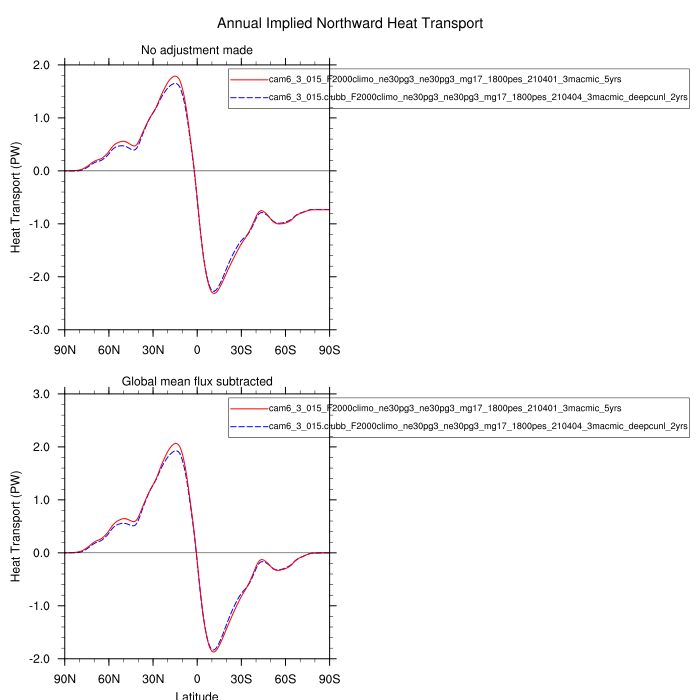
DIAG Set 2 - Line plots of annual implied transports
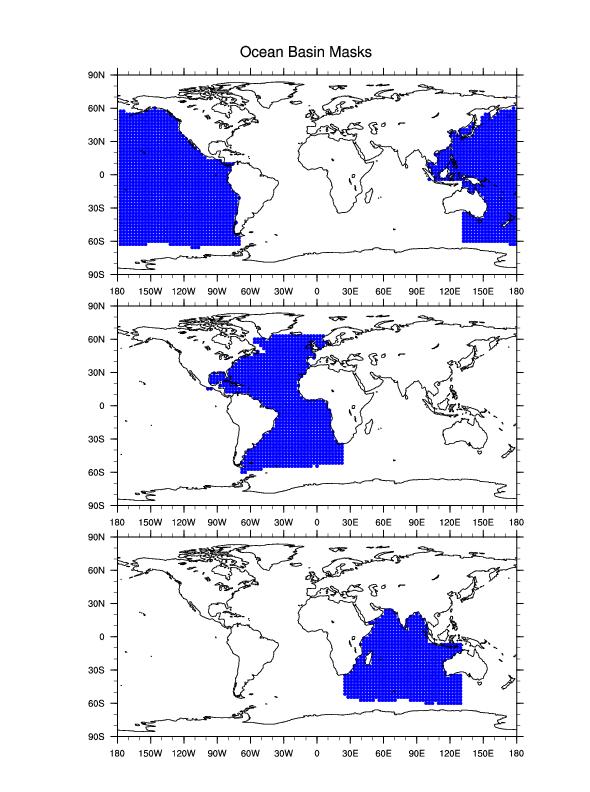
The computation of the implied northward transports follows the conventions described
in the paper by Trenberth and Caron (2001). Their corrections applied to the southern
oceans poleward of 30S are not used in the calculations, and the NCEP derived values
plotted here are their unadjusted values. Webpage about the NCEP derived data.
A plot of the ocean basins used in the calculations.
| Annual Implied Northward Transports | |
|---|---|
| Ocean Heat | plot |
| Atmospheric Heat | plot |
| Ocean Freshwater | plot |
| Surface Heat | plot |