 f.e21.ne30_ne30_F2000climo.cesm2_1.opt_se_cslam.se_phys_dyn_cp1
and
f.e21.ne30_ne30_F2000climo.cesm2_1.opt_se_cslam.001
f.e21.ne30_ne30_F2000climo.cesm2_1.opt_se_cslam.se_phys_dyn_cp1
and
f.e21.ne30_ne30_F2000climo.cesm2_1.opt_se_cslam.001
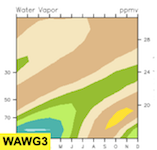
DIAG WSET3 - WAWG vertical profile seasonal cycle plots for selected latitude bands
| Middle Atmosphere | 60S-90S | 55S-65S | 20S-40S | 10S-10N | 20N-40N | 55N-65N | 60N-90N | |
|---|---|---|---|---|---|---|---|---|
| CH4 | Methane | plot | plot | plot | plot | plot | plot | plot |
| CO | Carbon Monoxide | plot | plot | plot | plot | plot | plot | plot |
| CO2 | Carbon Dioxide | plot | plot | plot | plot | plot | plot | plot |
| H2O | Water Vapor | plot | plot | plot | plot | plot | plot | plot |
| O3 | Ozone | plot | plot | plot | plot | plot | plot | plot |
| OH | Hydroxyl | plot | plot | plot | plot | plot | plot | plot |
| QRL_TOT | Merged LW Heating | plot | plot | plot | plot | plot | plot | plot |
| QRS_TOT | Merged SW Heating | plot | plot | plot | plot | plot | plot | plot |
| RELHUM | Relative Humidity | plot | plot | plot | plot | plot | plot | plot |
| SO2 | Sulfur Dioxide | plot | plot | plot | plot | plot | plot | plot |
| T | Temperature | plot | plot | plot | plot | plot | plot | plot |
| U | Zonal Wind | plot | plot | plot | plot | plot | plot | plot |
| V | Meridional Wind | plot | plot | plot | plot | plot | plot | plot |
| Z3 | Geopotential Height | plot | plot | plot | plot | plot | plot | plot |
| Stratosphere | 60S-90S | 55S-65S | 20S-40S | 10S-10N | 20N-40N | 55N-65N | 60N-90N | |
| CH4 | Methane | plot | plot | plot | plot | plot | plot | plot |
| CO | Carbon Monoxide | plot | plot | plot | plot | plot | plot | plot |
| CO2 | Carbon Dioxide | plot | plot | plot | plot | plot | plot | plot |
| H2O | Water Vapor | plot | plot | plot | plot | plot | plot | plot |
| N2O | Nitrous Oxide | plot | plot | plot | plot | plot | plot | plot |
| O3 | Ozone | plot | plot | plot | plot | plot | plot | plot |
| OH | Hydroxyl | plot | plot | plot | plot | plot | plot | plot |
| RELHUM | Relative Humidity | plot | plot | plot | plot | plot | plot | plot |
| SO2 | Sulfur Dioxide | plot | plot | plot | plot | plot | plot | plot |
| T | Temperature | plot | plot | plot | plot | plot | plot | plot |