 cam5.1_amip_2d_001
 and
OBS data
cam5.1_amip_2d_001
and
OBS data
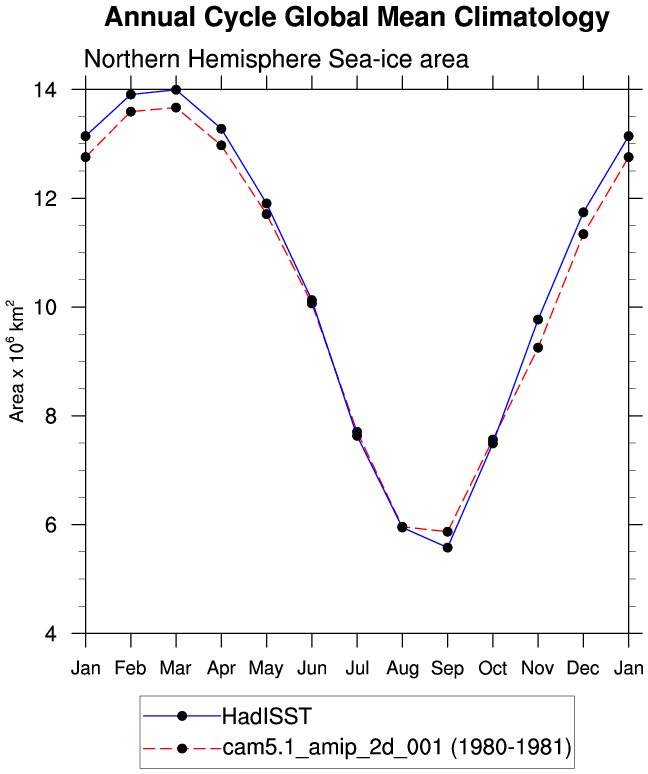
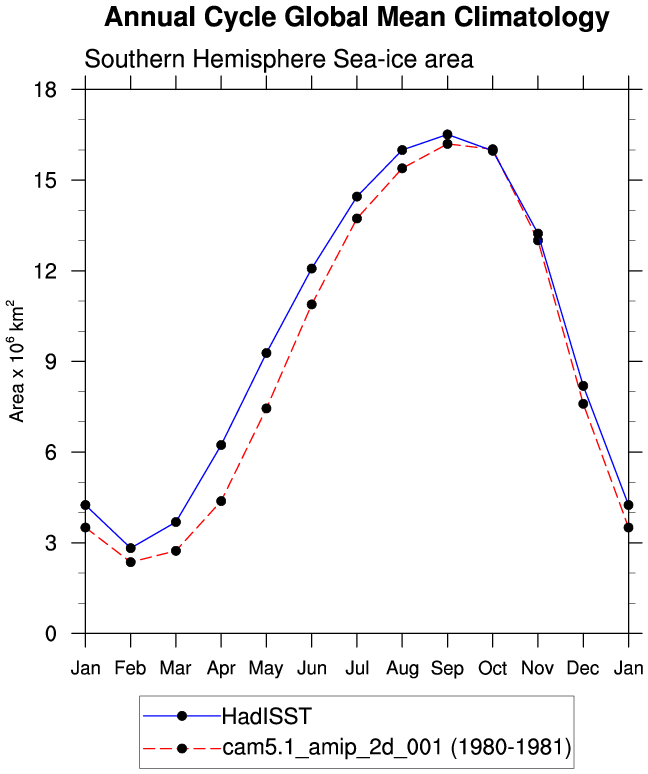
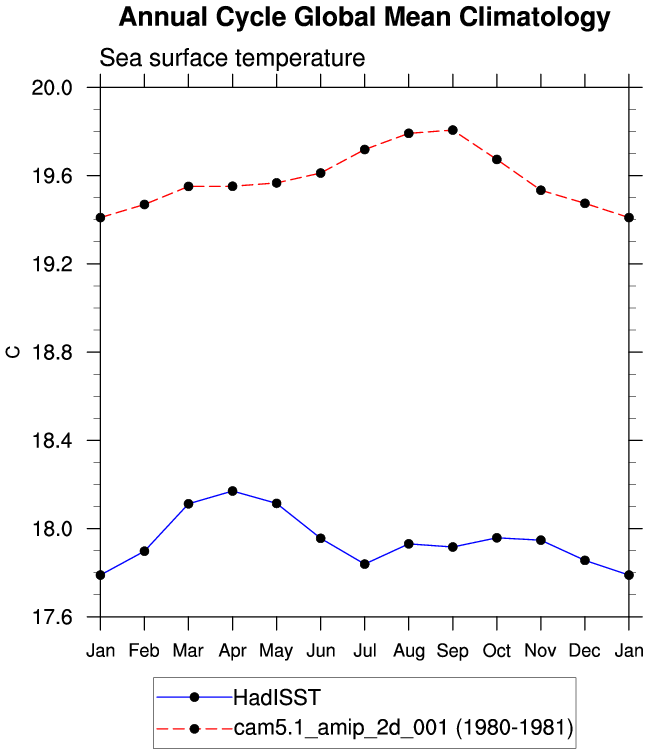
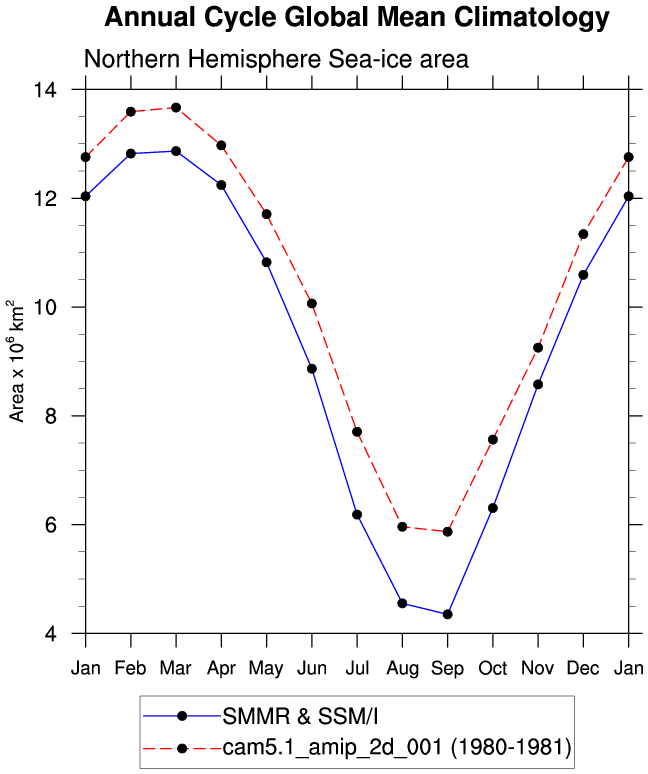
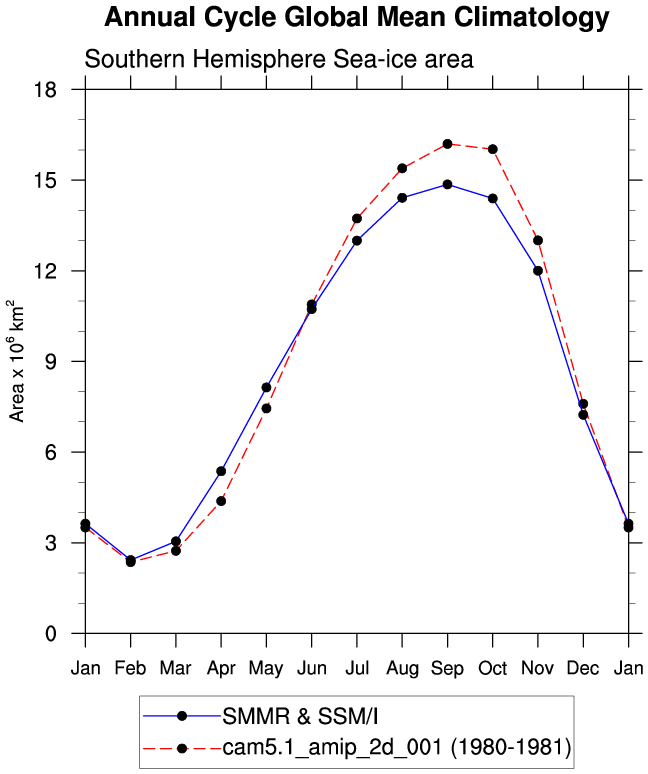
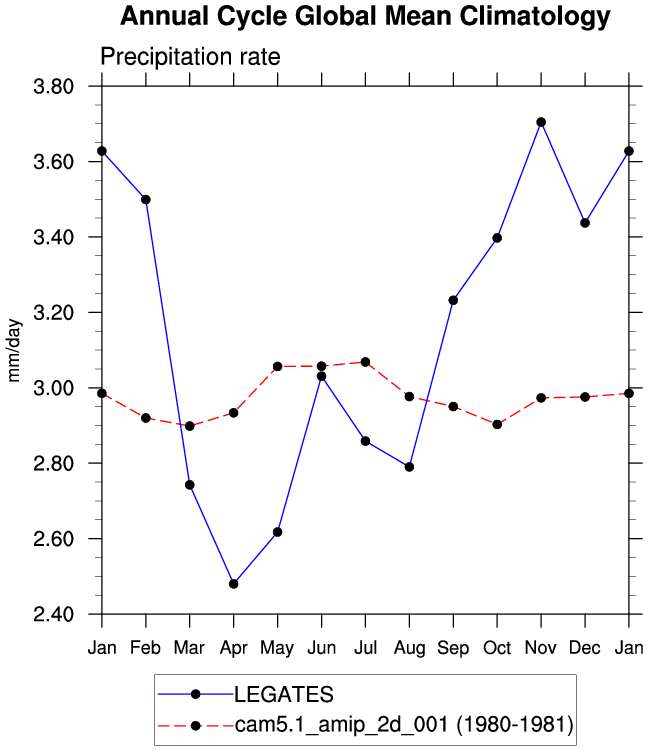
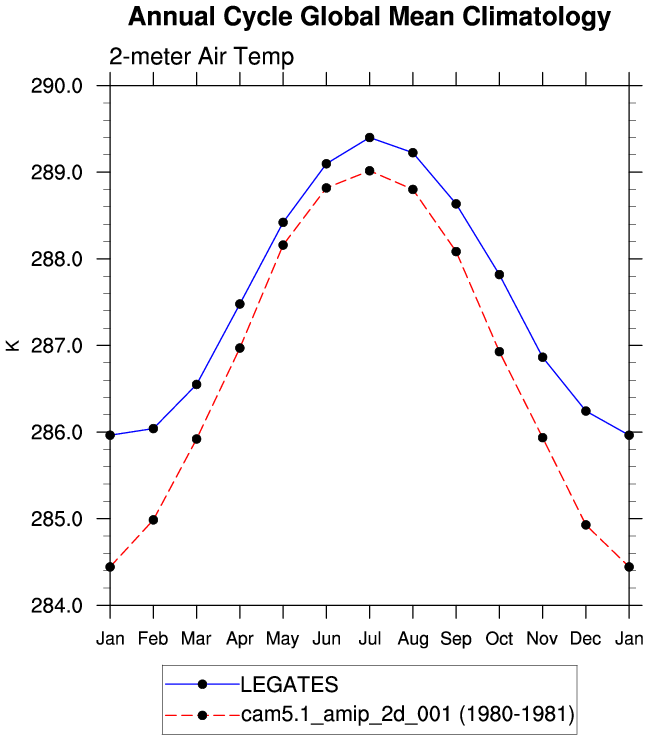
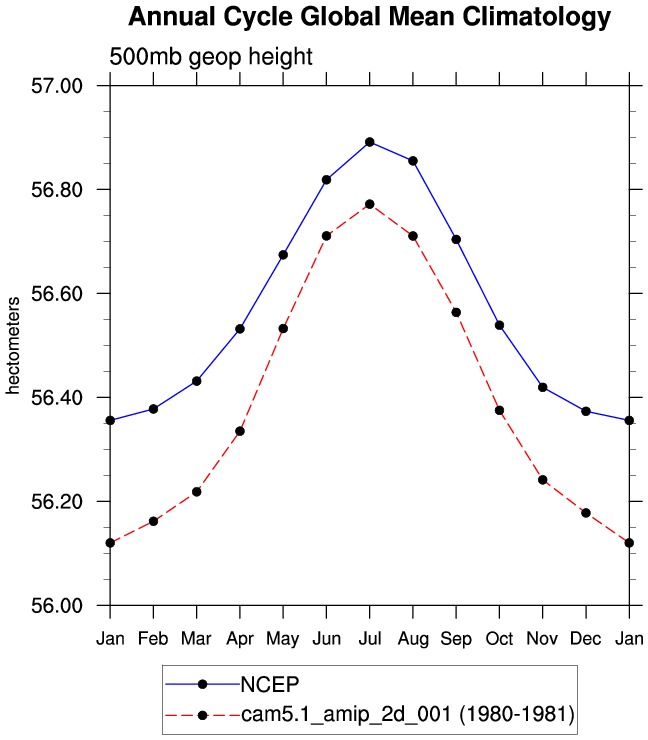
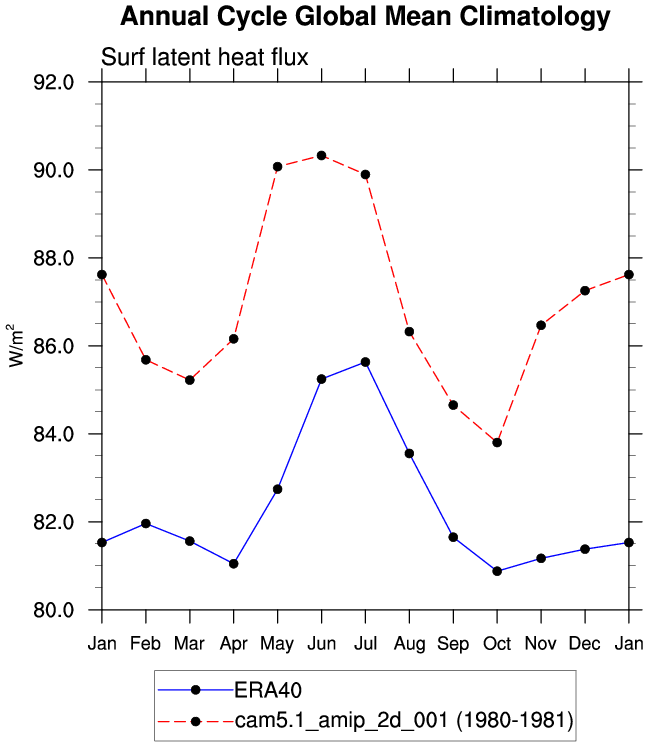
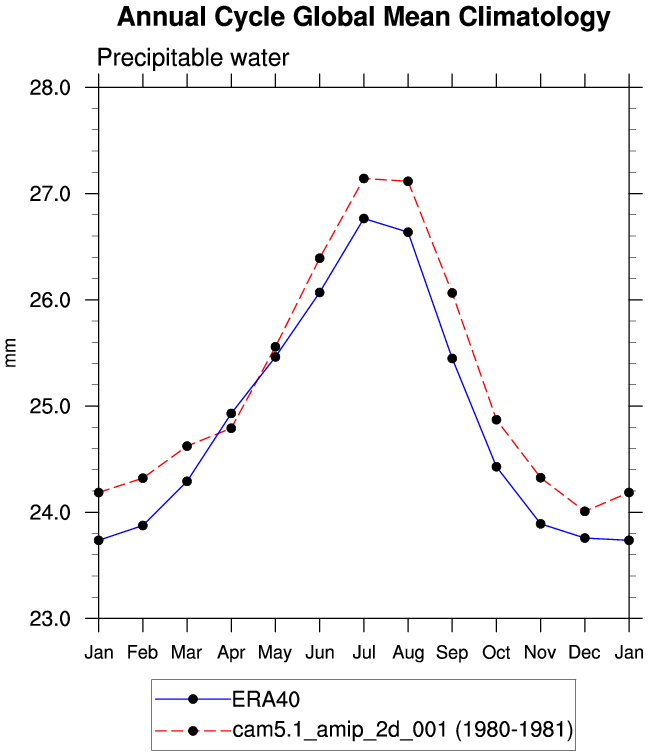
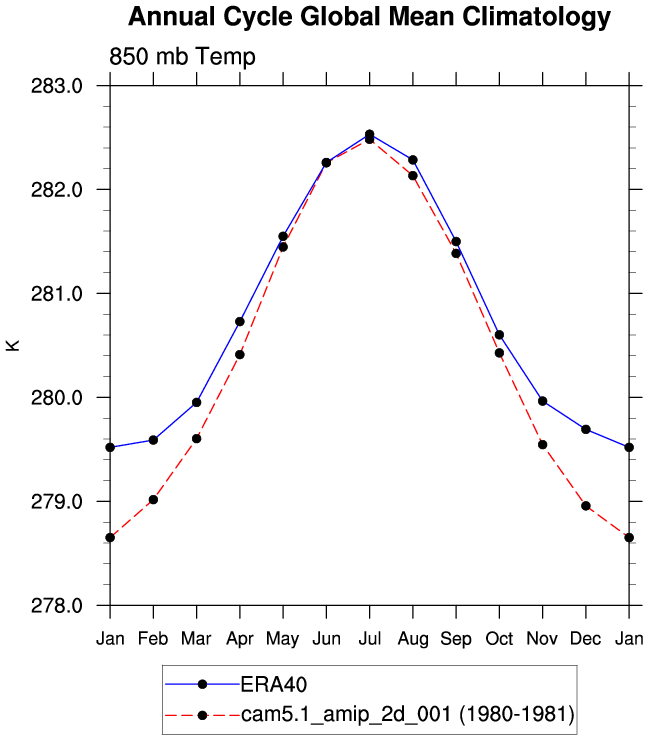
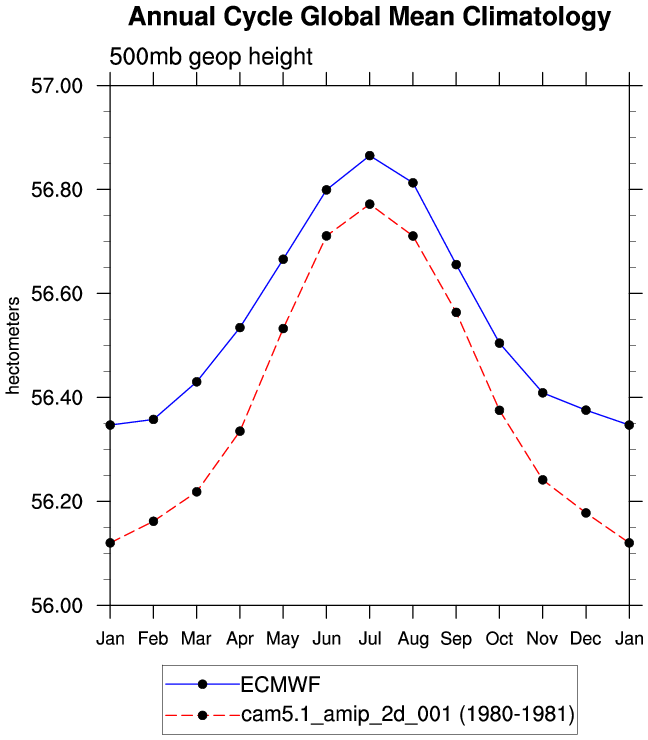
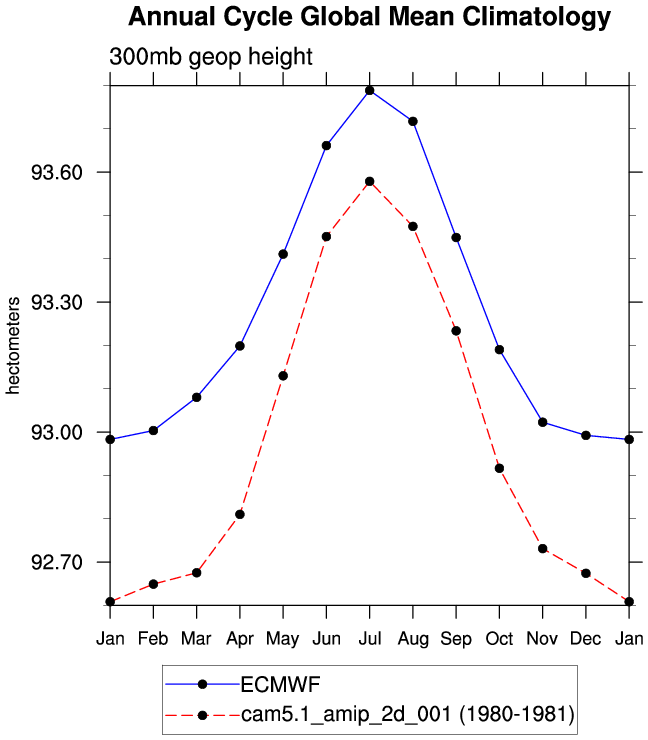
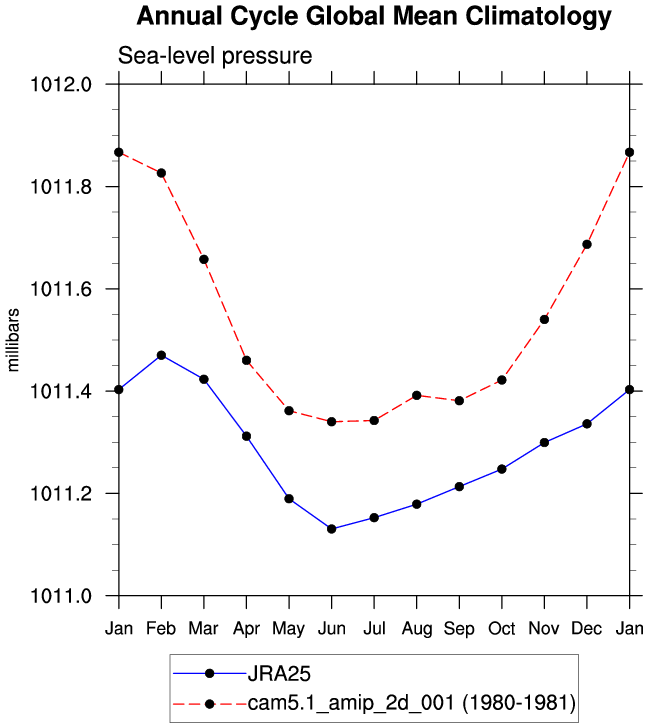
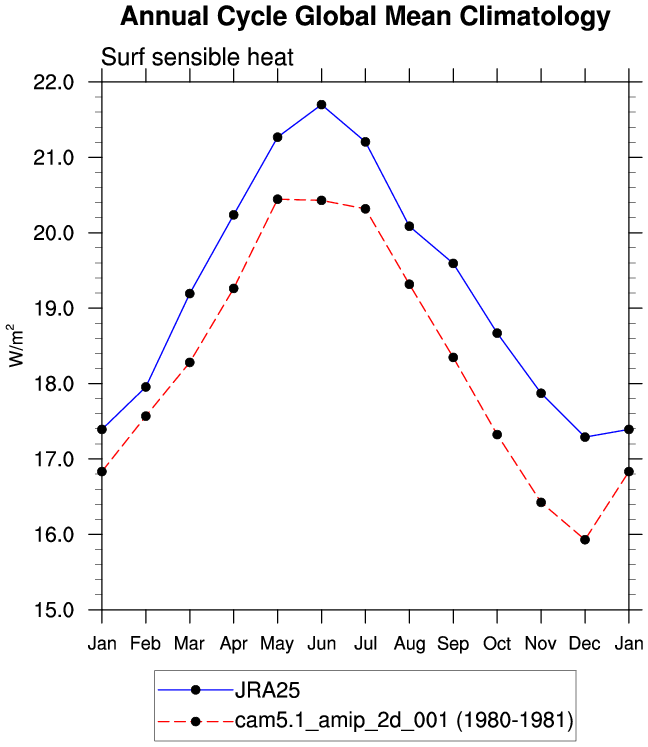
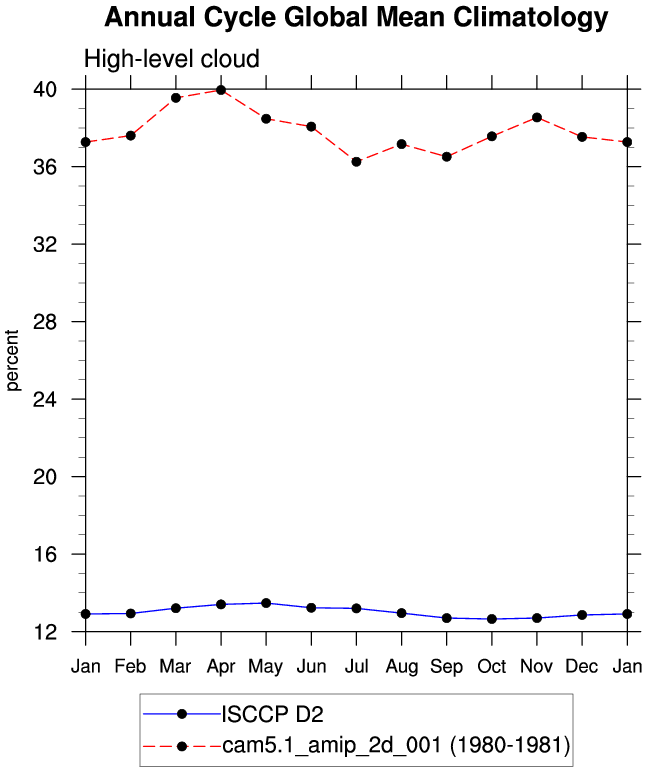
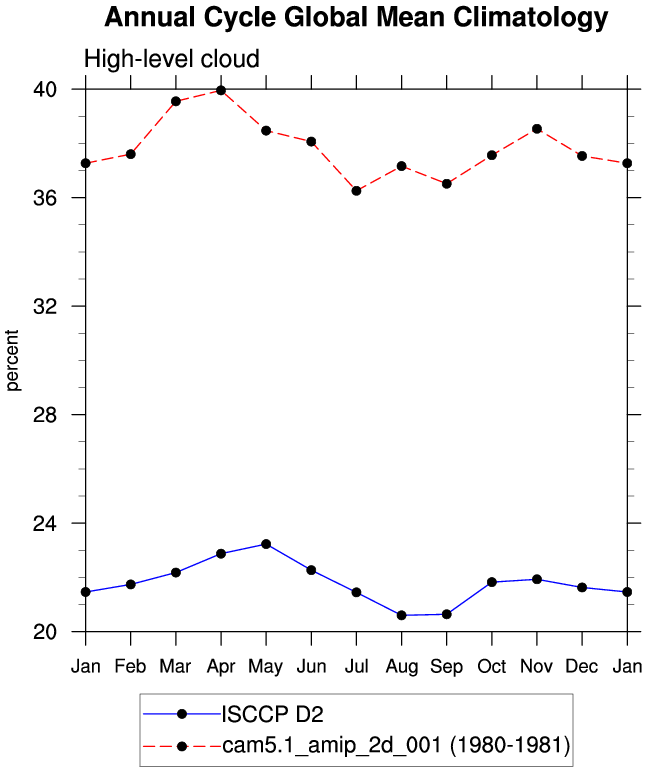
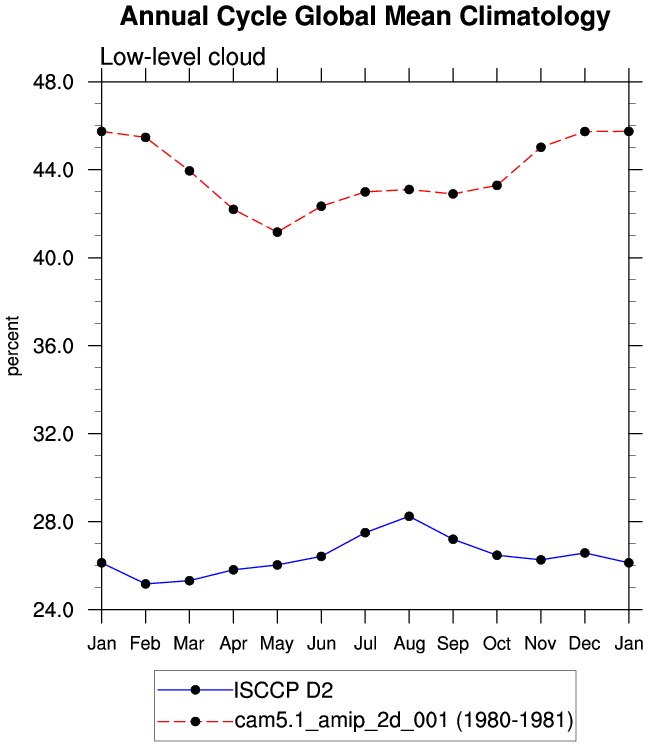
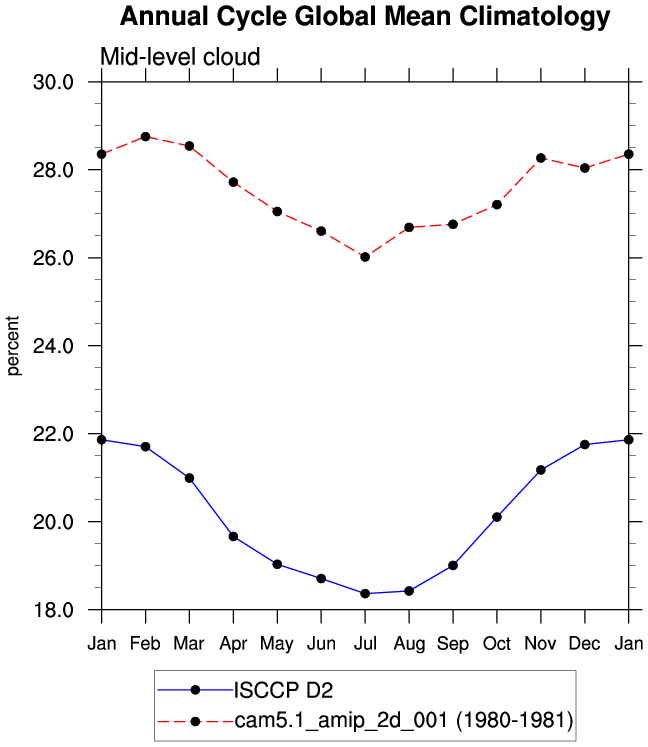
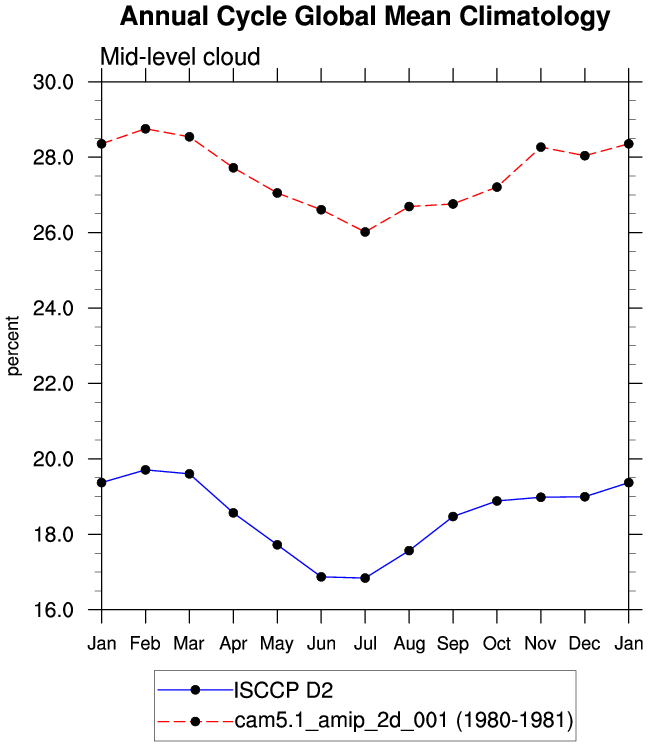
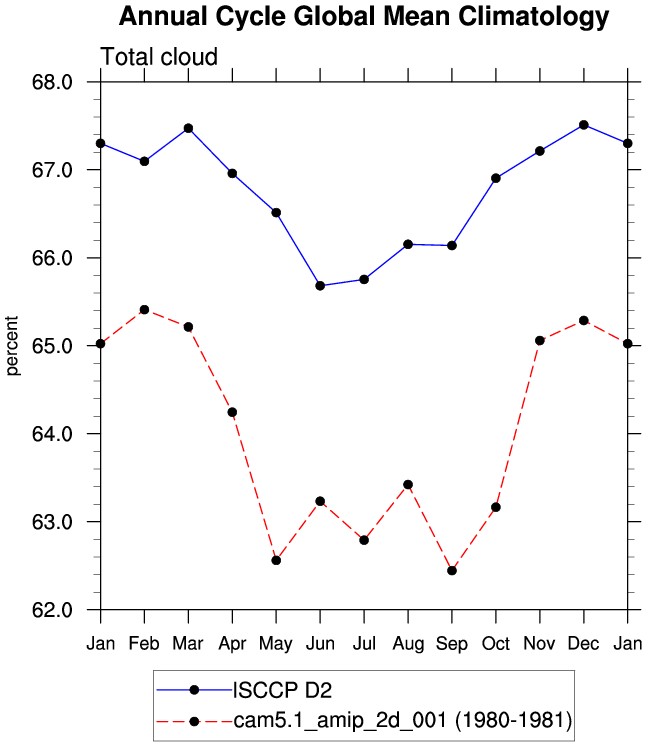
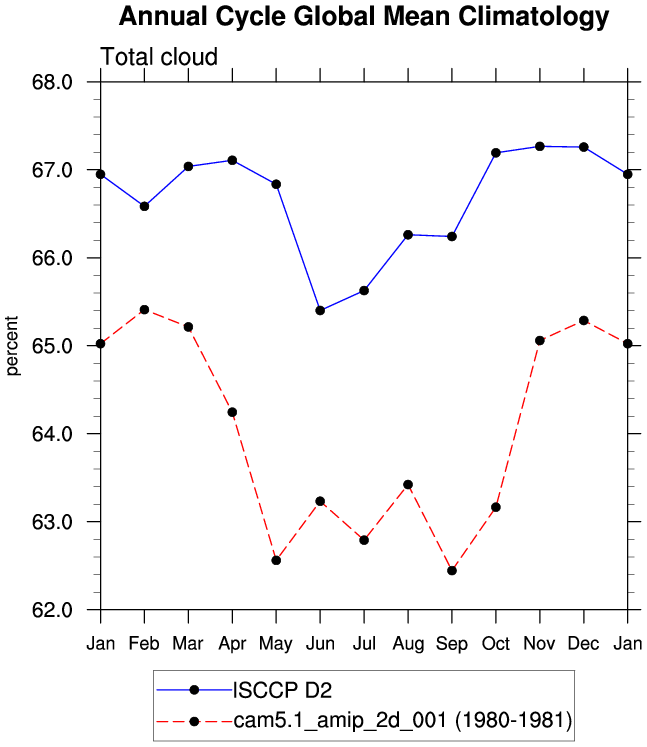
DIAG Set 10 - Annual cycle line plots of global means
| HadISST/OI.v2 1982-2001 | ||
|---|---|---|
| ICEFRAC | Sea-ice area (Northern) | plot |
| ICEFRAC | Sea-ice area (Southern) | plot |
| SST | Sea surface temperature | plot |
| SMMR & SSM/I 1979-1999 | ||
| ICEFRAC | Sea-ice area (Northern) | plot |
| ICEFRAC | Sea-ice area (Southern) | plot |
| Legates & Willmott 1920-80 | ||
| PRECT | Precipitation rate | plot |
| TREFHT | 2-meter air temperature | plot |
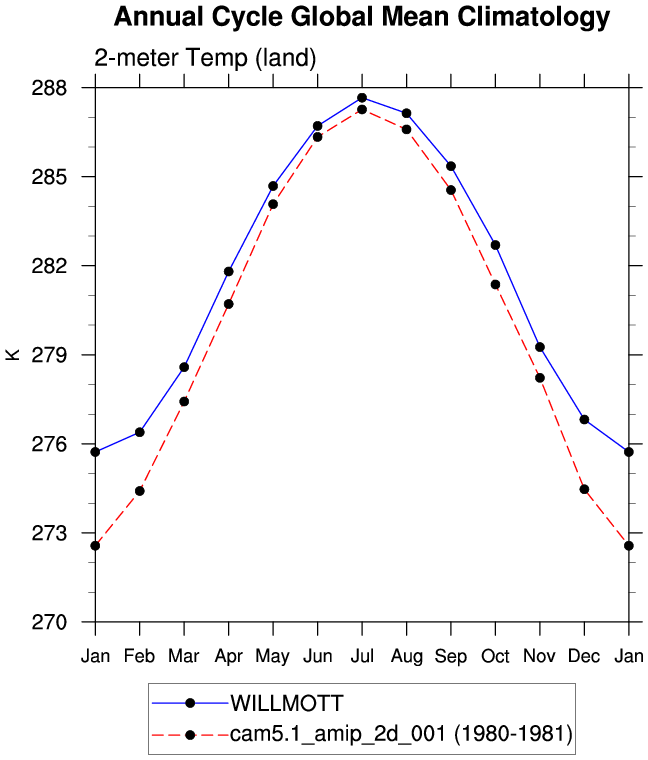
| Willmott & Matsuura 1950-99 | ||
| TREFHT | 2-meter air temperature (land) | plot |
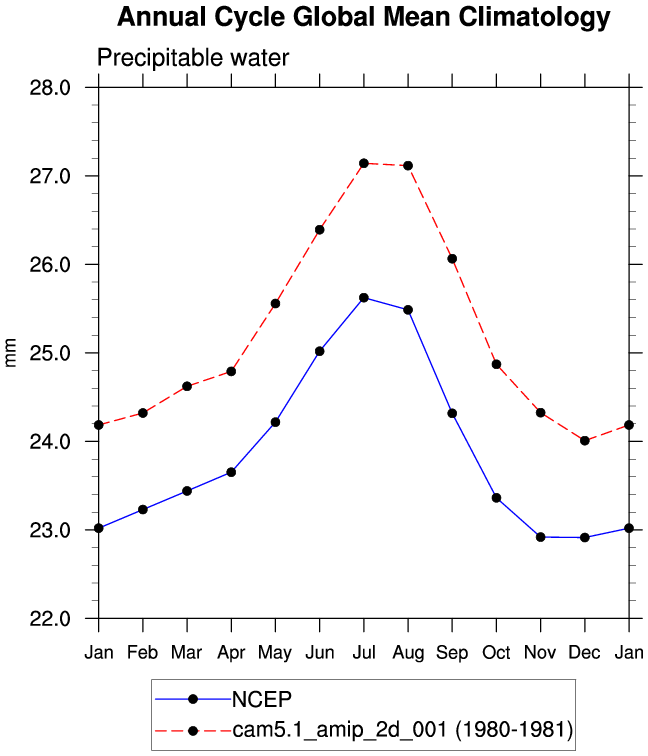
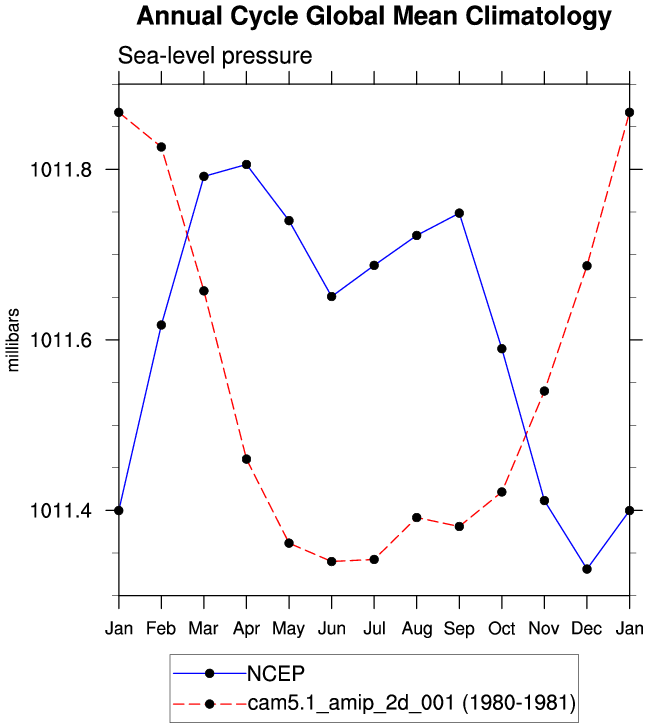
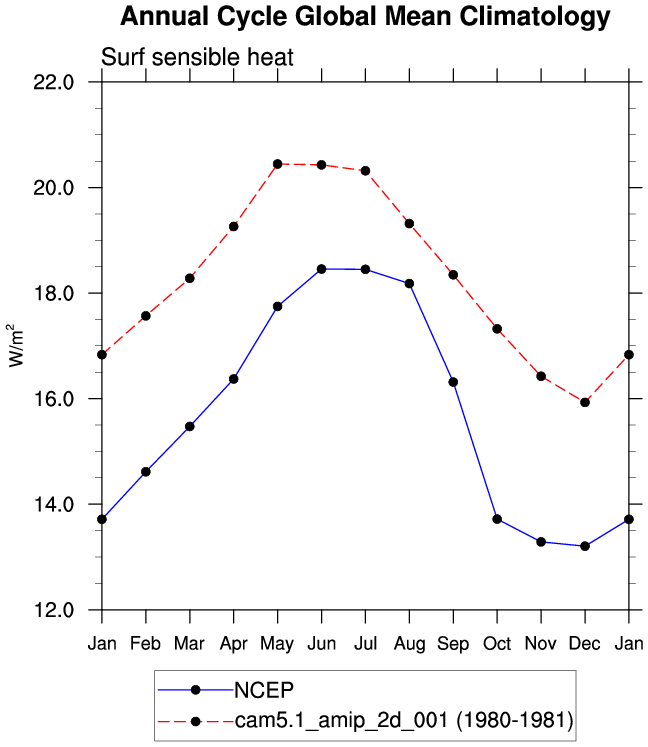
| NCEP Reanalysis 1979-98 | ||
| PREH2O | Total precipitable water | plot |
| PSL | Sea-level pressure | plot |
| SHFLX | Surface sensible heat flux | plot |
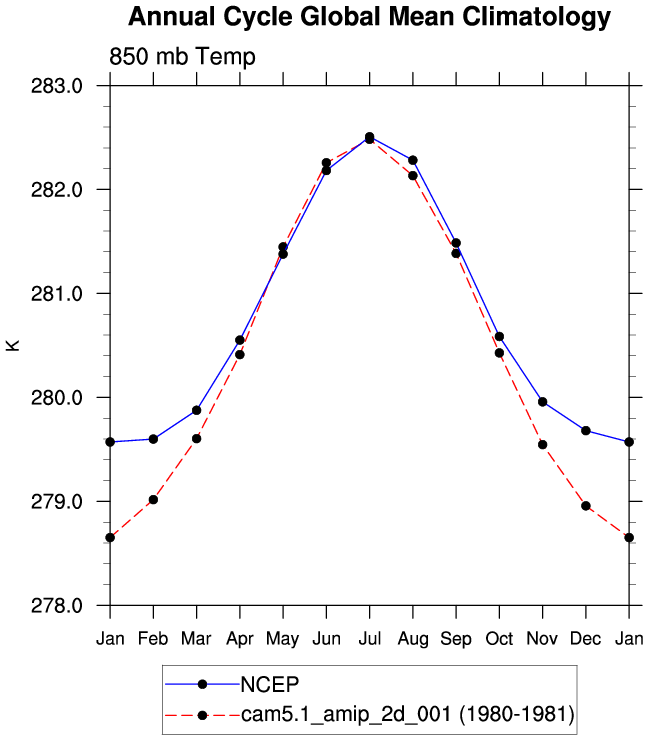
| T 850 | 850 mb temperature | plot |
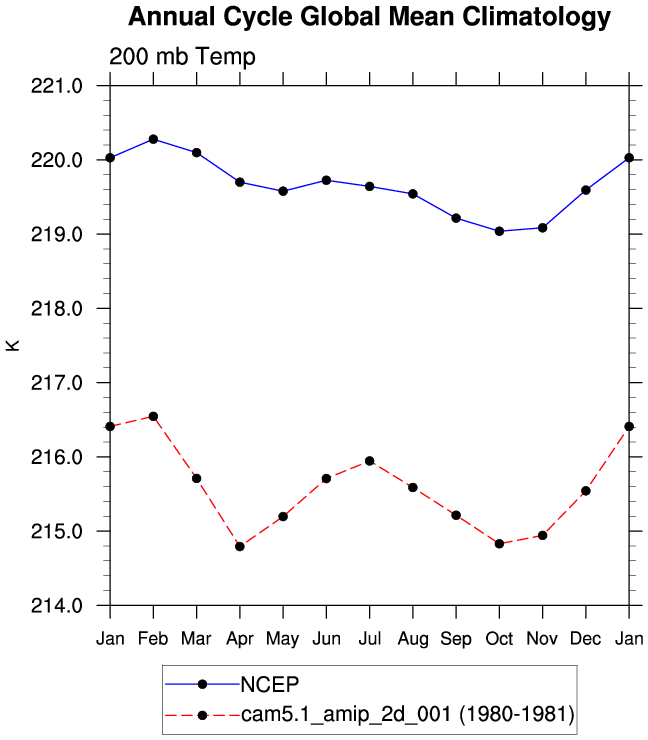
| T 200 | 200 mb temperature | plot |
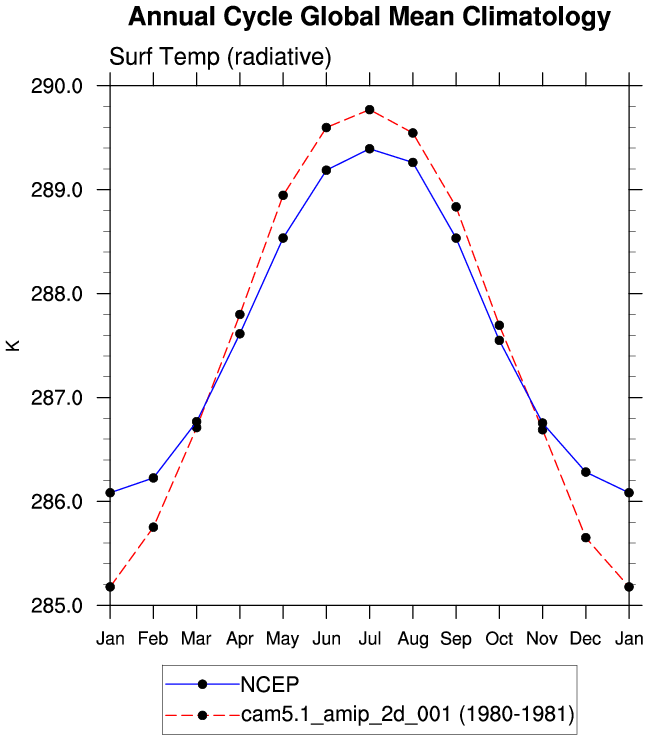
| TS | Surface temperature | plot |
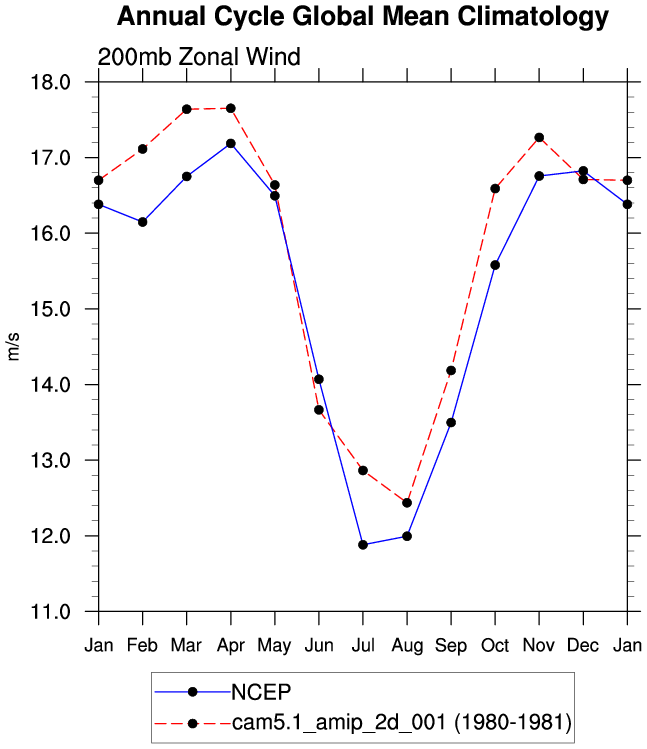
| U 200 | 200 mb zonal wind | plot |
| Z 500 | 500 mb geopotential height | plot |
| Z 300 | 300 mb geopotential height | plot |
| ERA40 Reanalysis 1980-2001 | ||
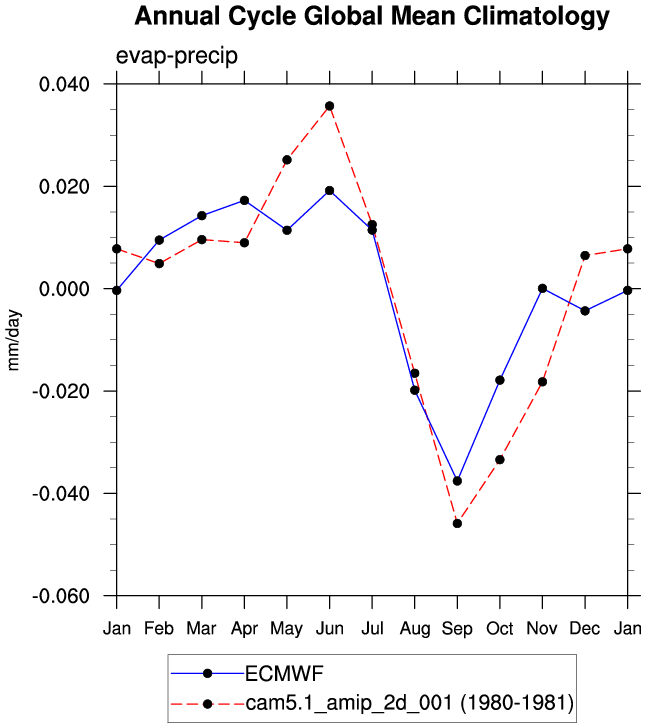
| EP | Evaporation - precipitation | plot |
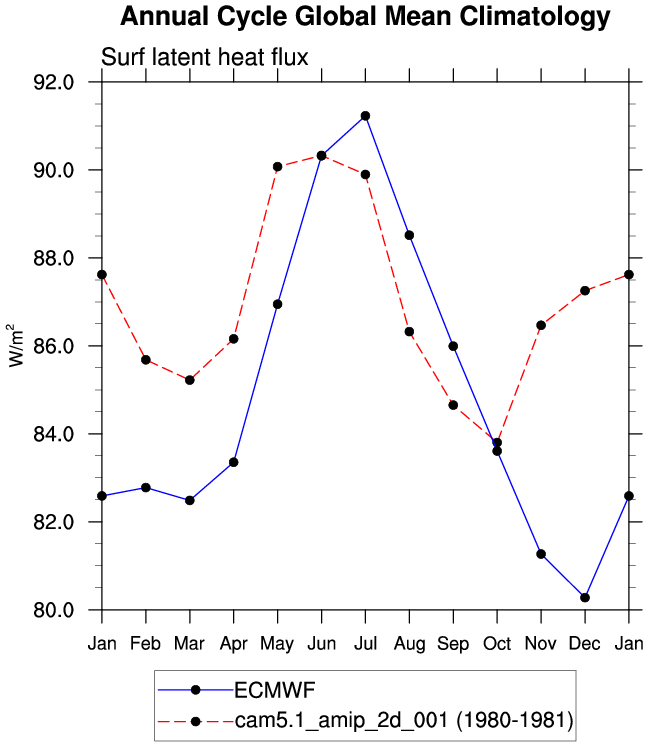
| LHFLX | Surface latent heat flux | plot |
| PREH2O | Precipitable water | plot |
| QFLX | Surface water flux | plot |
| T 850 | 850 mb temperature | plot |
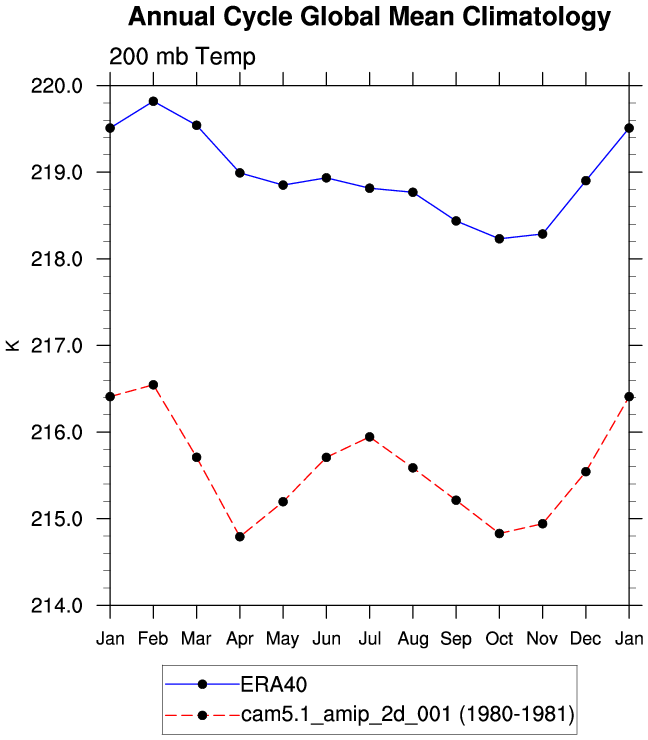
| T 200 | 200 mb temperature | plot |
| U 200 | 200 mb zonal wind | plot |
| Z 500 | 500 mb geopotential height | plot |
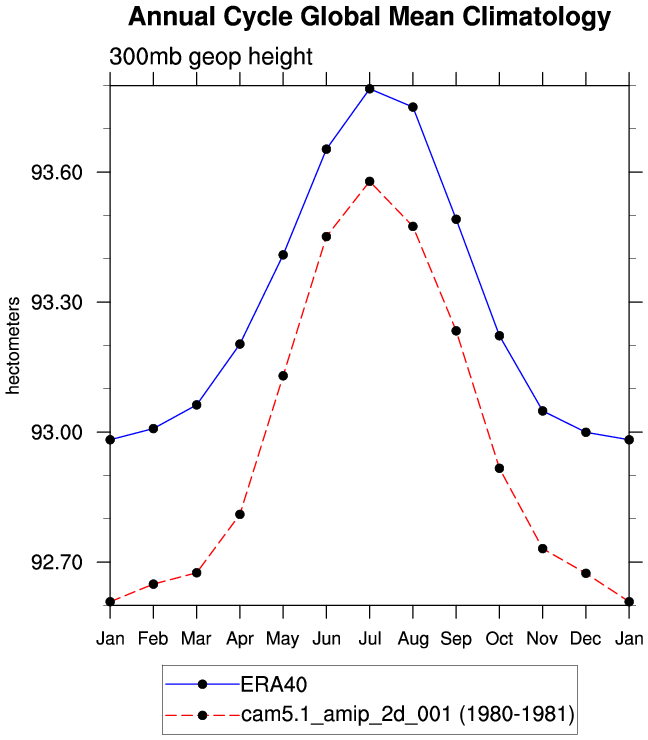
| Z 300 | 300 mb geopotential height | plot |
| ECMWF Reanalysis 1979-93 | ||
| EP | Evaporation - precipitation | plot |
| LHFLX | Surface latent heat flux | plot |
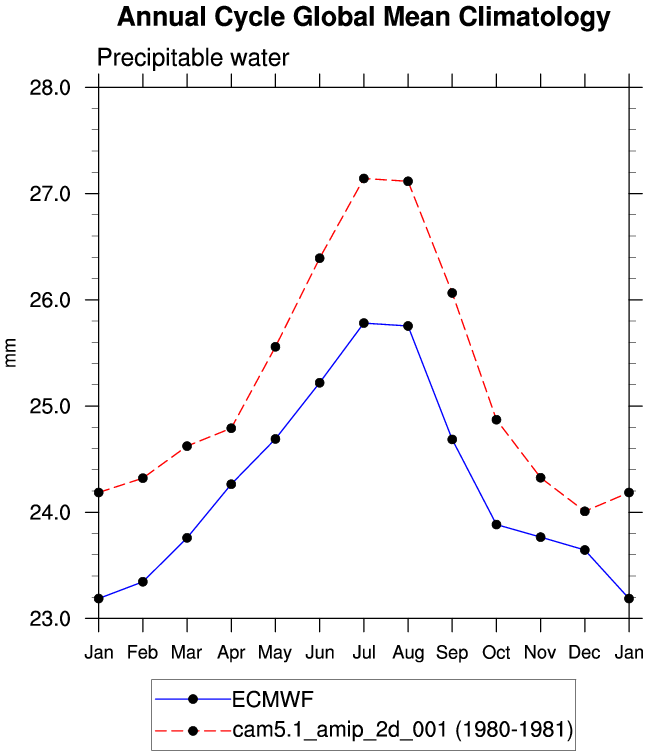
| PREH2O | Precipitable water | plot |
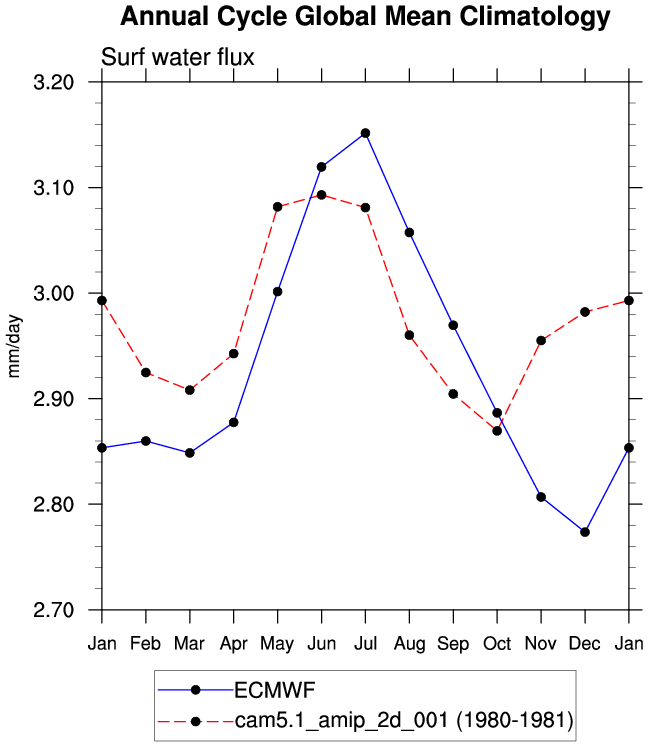
| QFLX | Surface water flux | plot |
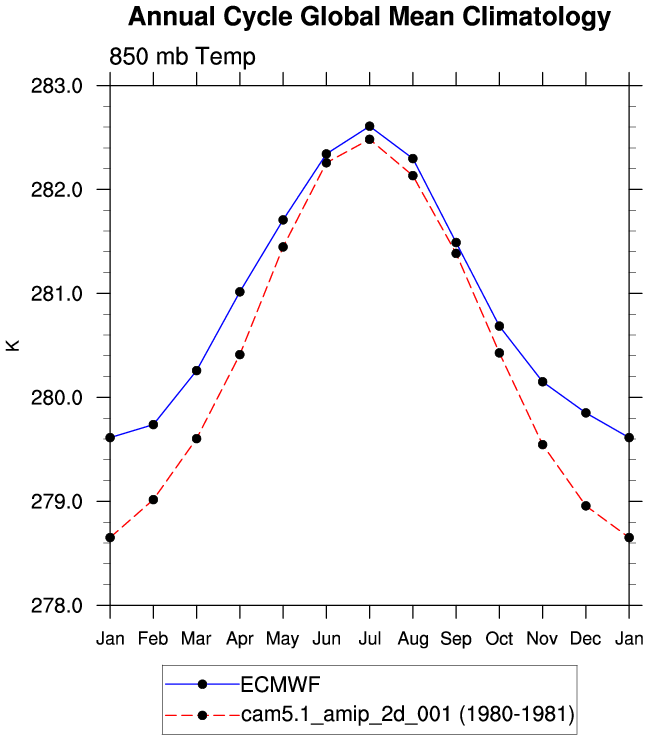
| T 850 | 850 mb temperature | plot |
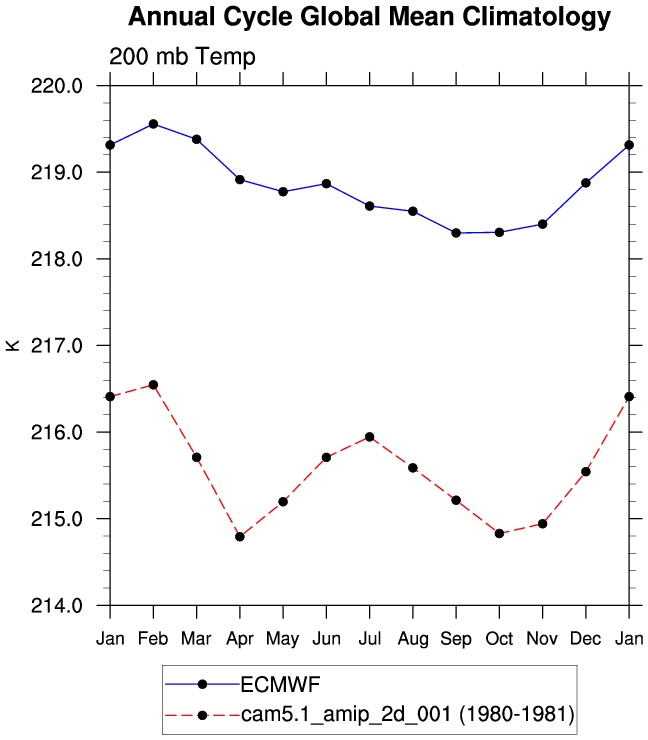
| T 200 | 200 mb temperature | plot |
| U 200 | 200 mb zonal wind | plot |
| Z 500 | 500 mb geopotential height | plot |
| Z 300 | 300 mb geopotential height | plot |
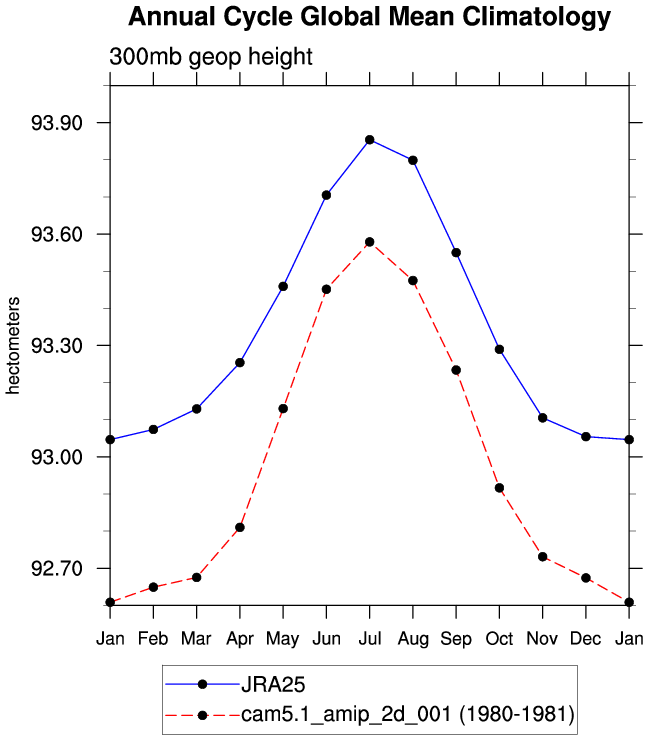
| JRA25 Reanalysis 1979-04 | ||
| PREH2O | Total precipitable water | plot |
| PSL | Sea-level pressure | plot |
| SHFLX | Surface sensible heat flux | plot |
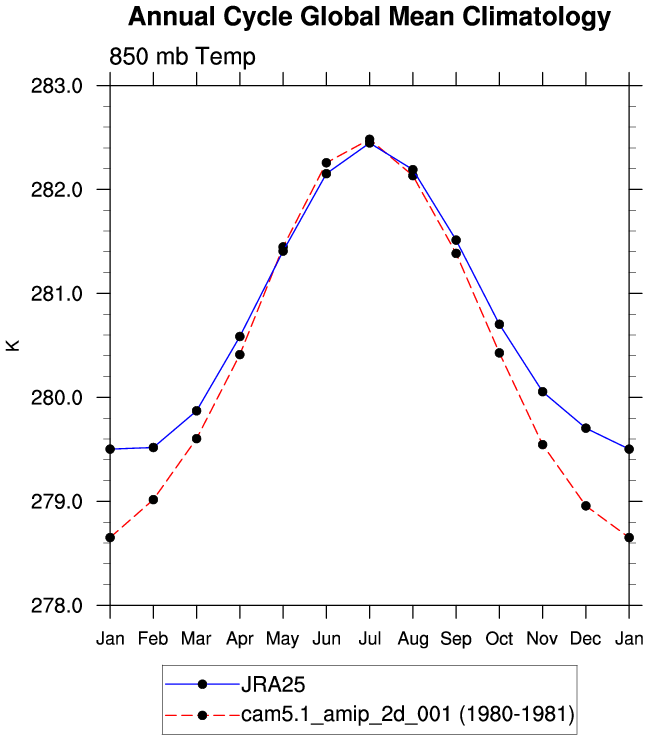
| T 850 | 850 mb temperature | plot |
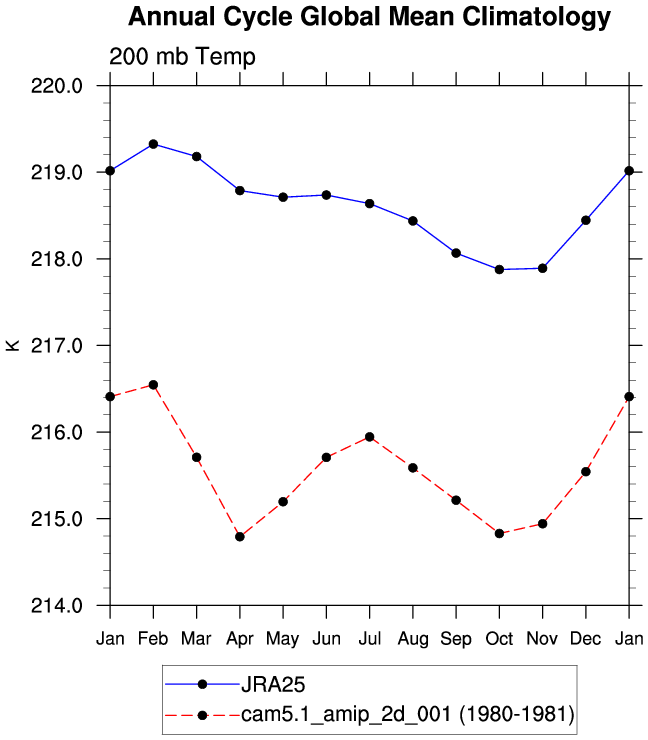
| T 200 | 200 mb temperature | plot |
| TREFHT | 2-meter surface air temperature | plot |
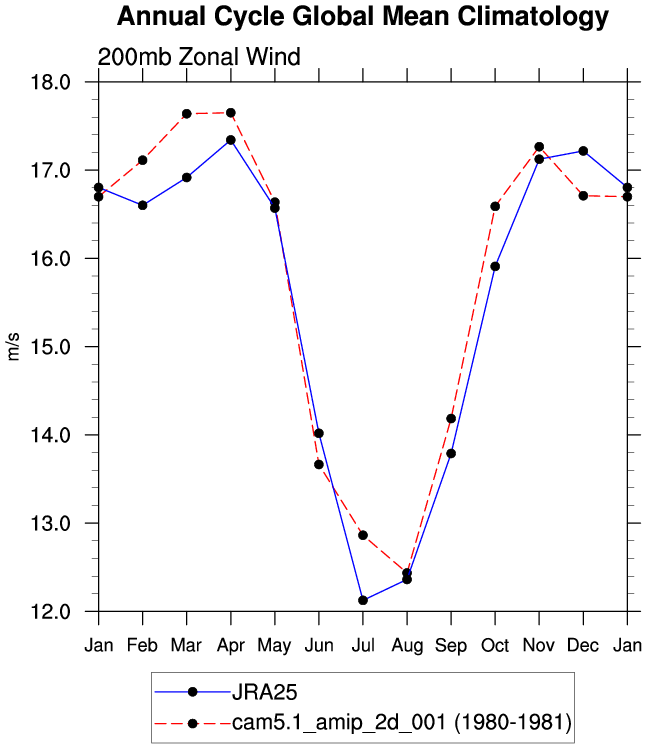
| U 200 | 200 mb zonal wind | plot |
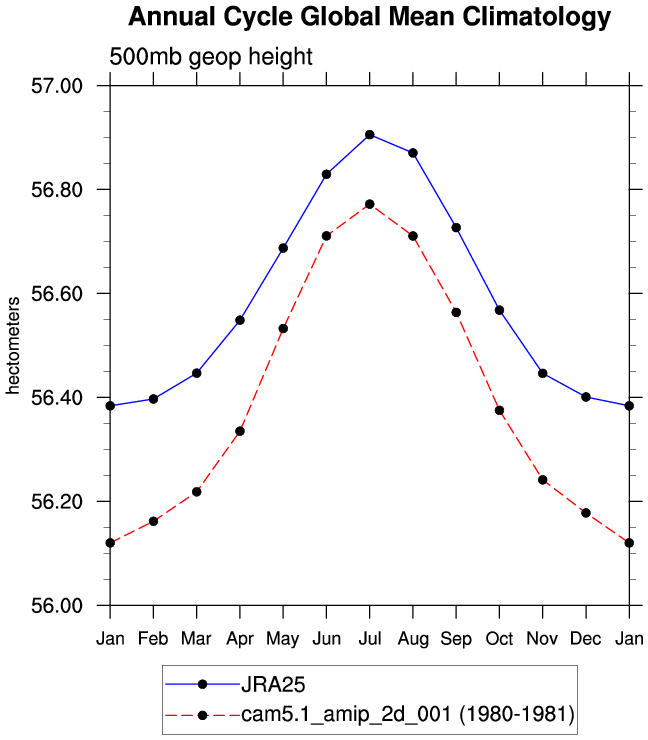
| Z 500 | 500 mb geopotential height | plot |
| Z 300 | 300 mb geopotential height | plot |
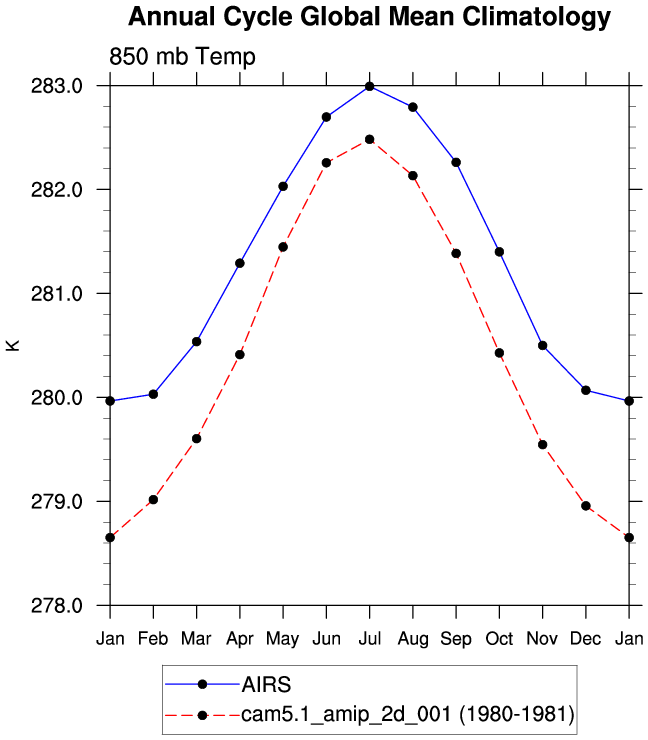
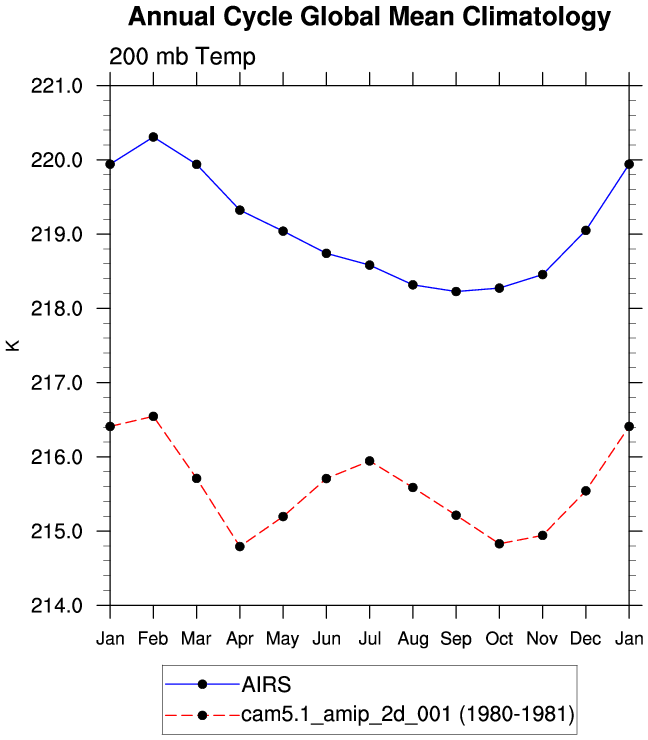
| AIRS IR Sounder 2002-06 | ||
| T 850 * | 850 mb temperature | plot |
| T 200 | 200 mb temperature | plot |
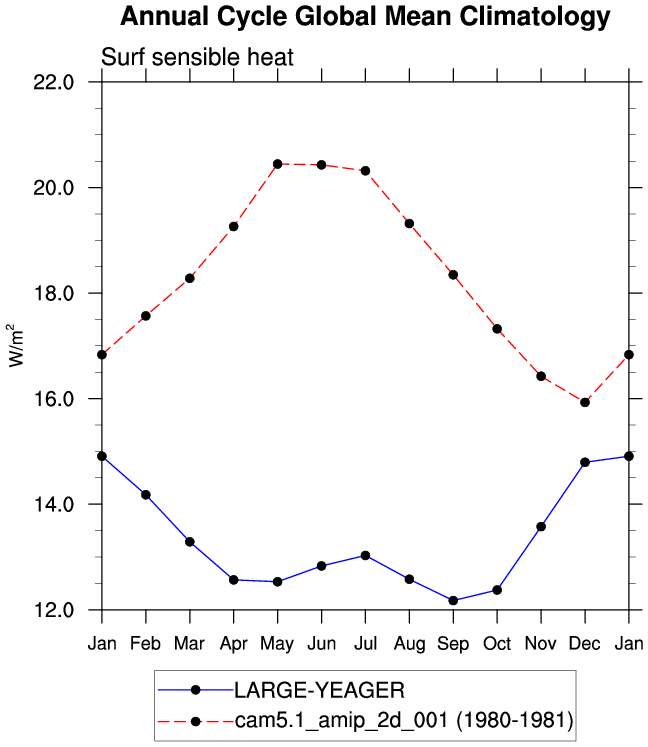
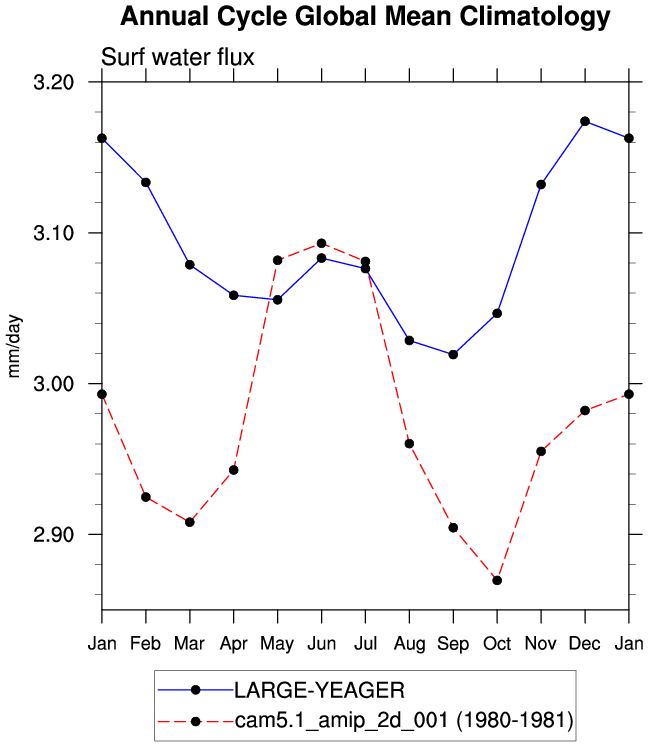
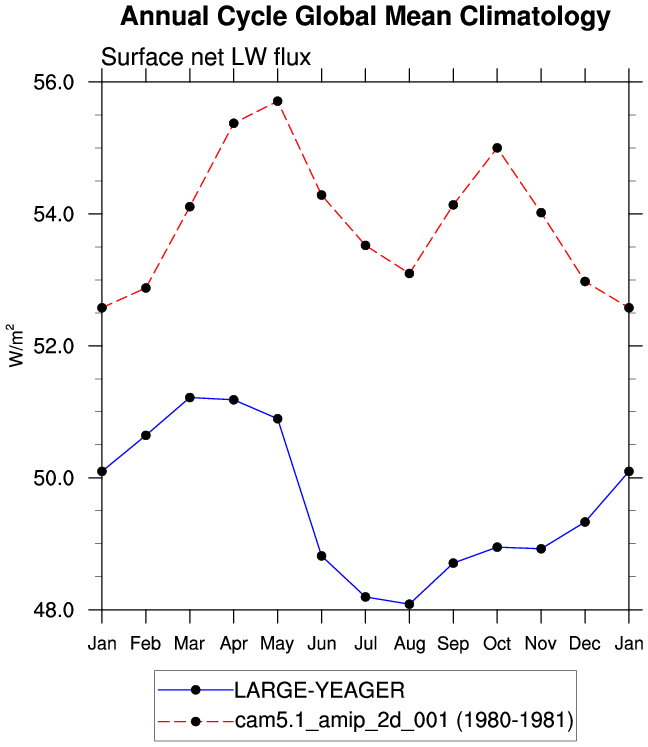
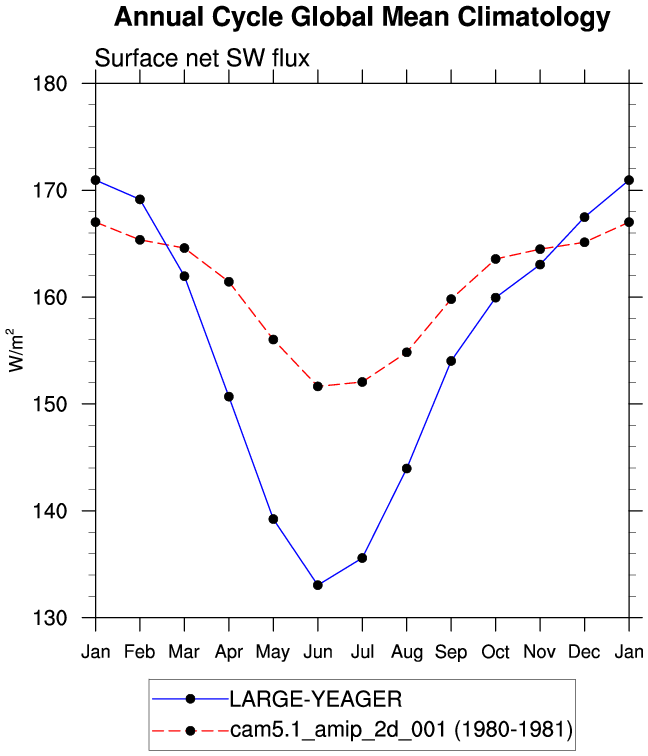
| Large-Yeager 1984-2004 | ||
| SHFLX | Surface sensible heat flux | plot |
| QFLX | Surface water flux | plot |
| FLNS | Surf Net LW flux | plot |
| FSNS | Surf Net SW flux | plot |
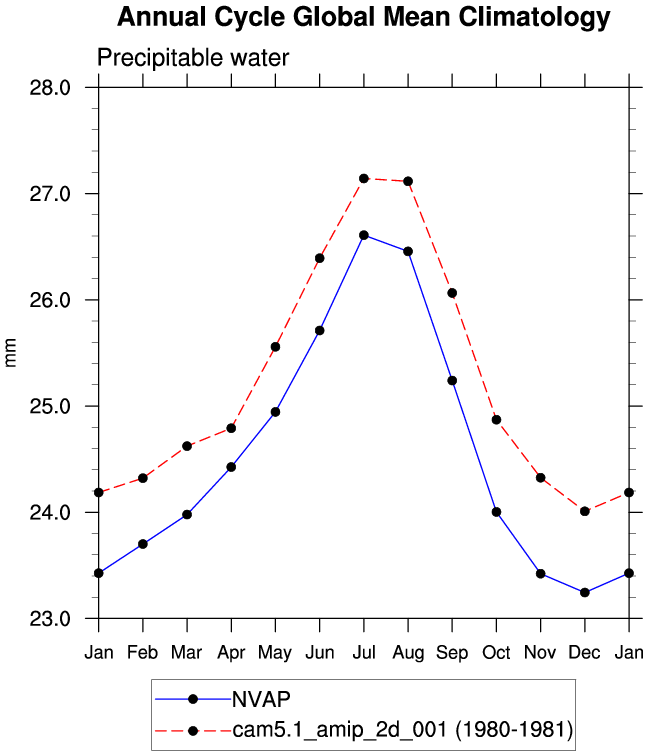
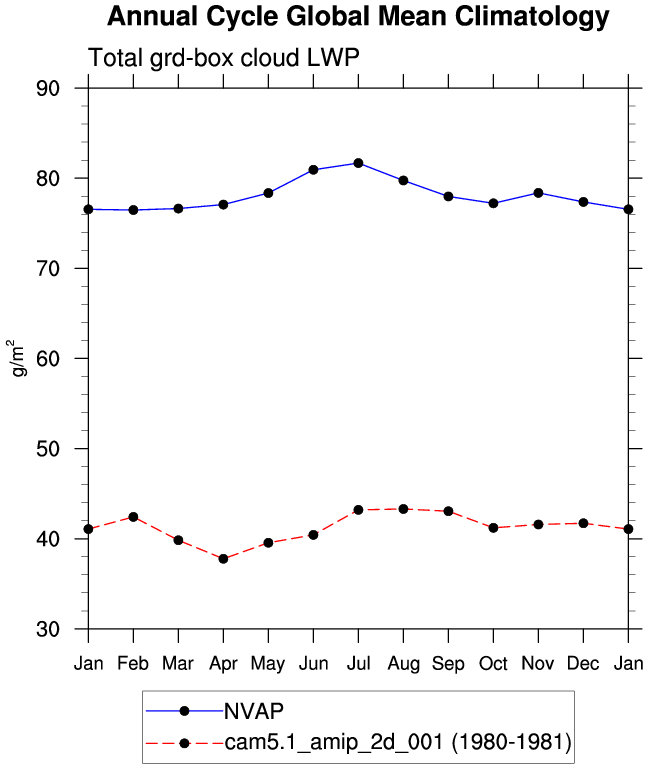
| NVAP 1988-1999 | ||
| PREH2O | Total precipitable water | plot |
| TGCLDLWP | Cloud liquid water (ocean) | plot |
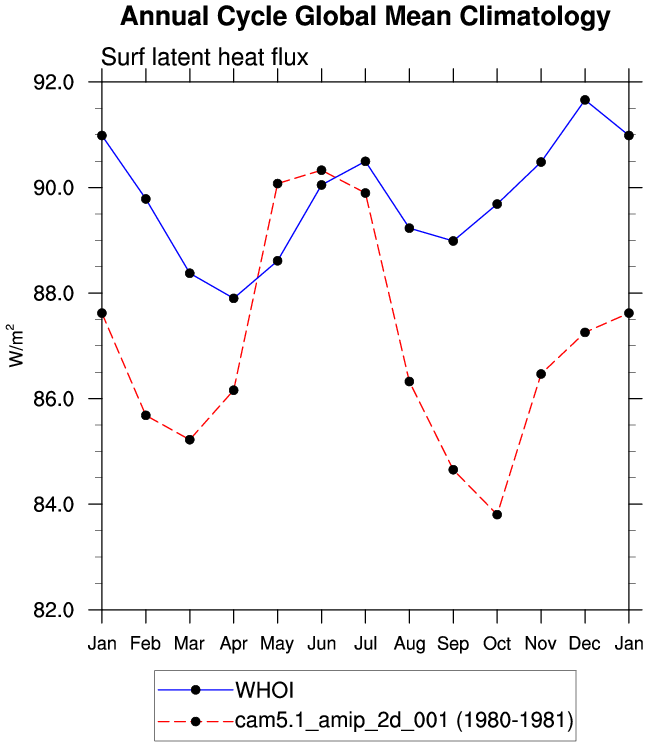
| Woods Hole OAFLUX 1958-2006 | ||
| LHFLX | Latent Heat Flux | plot |
| QFLX | Surface Water Flux | plot |
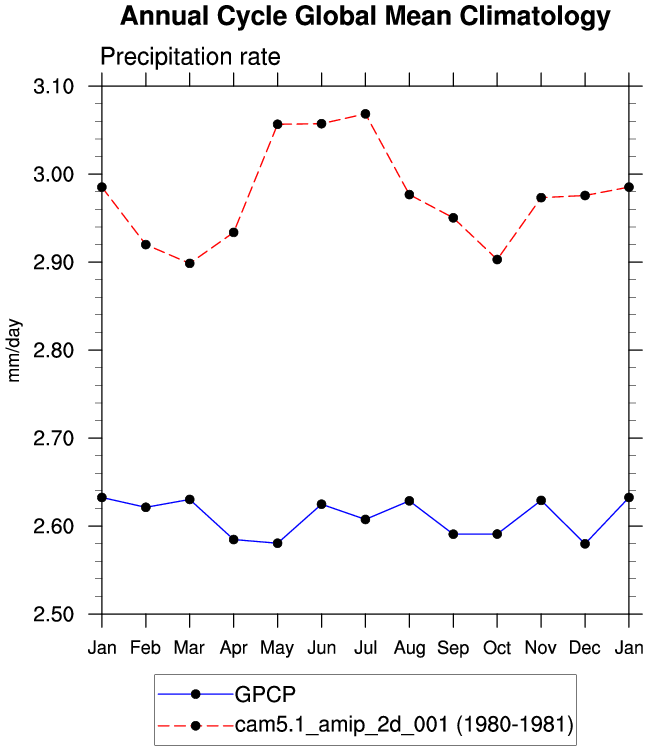
| GPCP 1979-2009 | ||
| PRECT | Precipitation rate | plot |
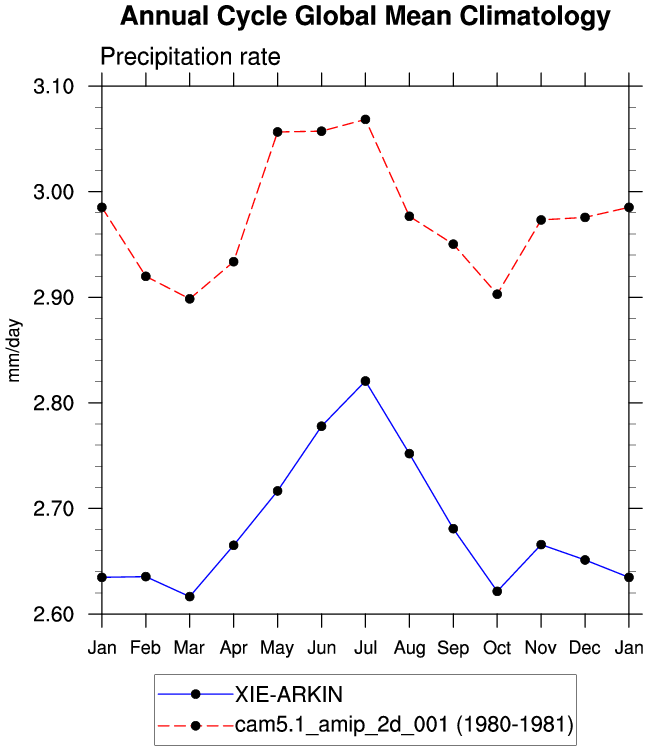
| CMAP (Xie-Arkin) 1979-98 | ||
| PRECT | Precipitation rate | plot |
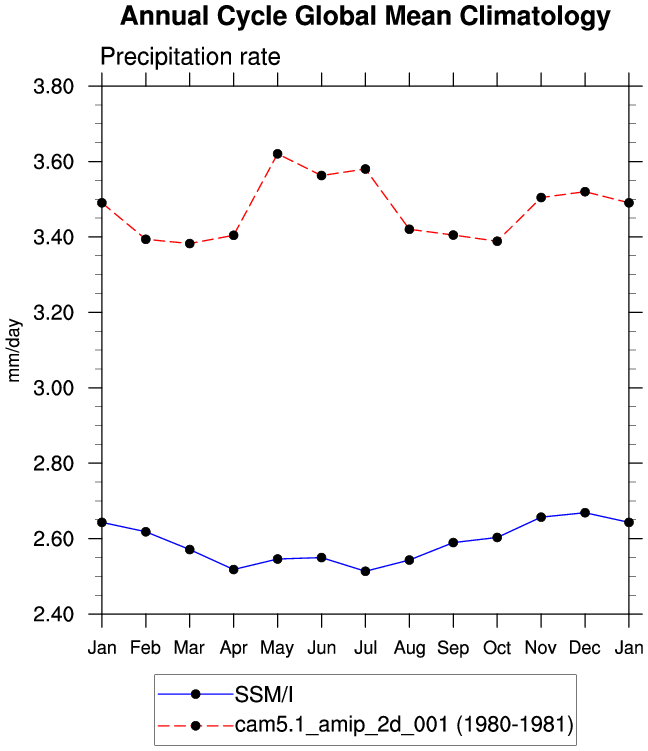
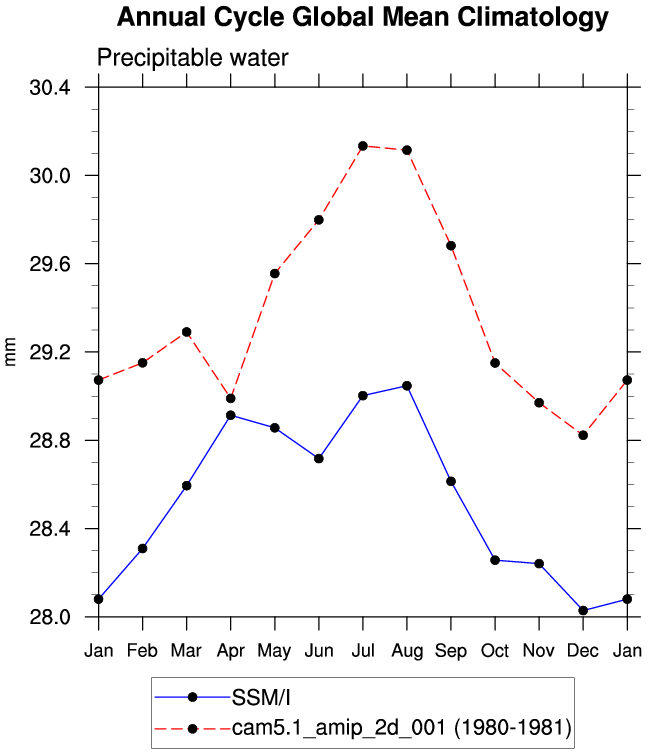
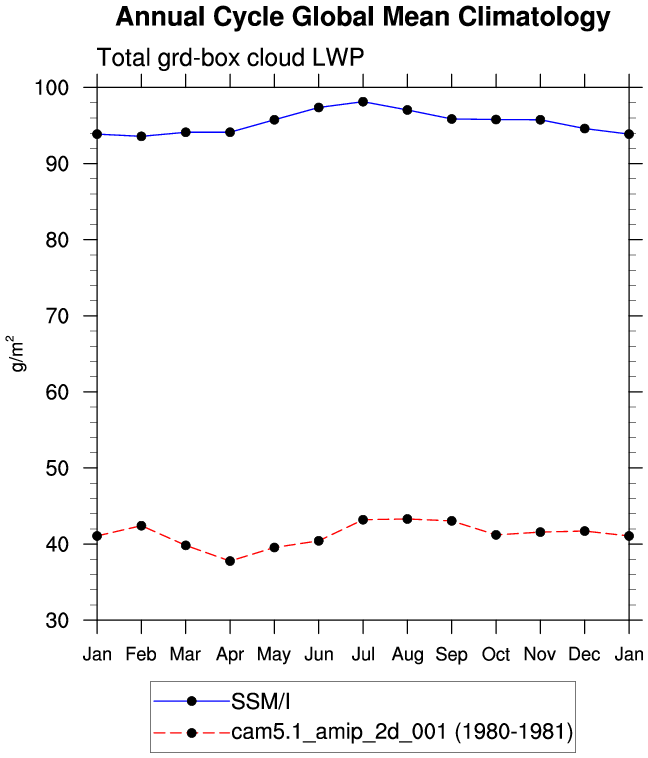
| SSM/I (Wentz) 1987-2000 | ||
| PRECT | Precipitation rate (ocean) | plot |
| PREH2O | Precipitable water (ocean) | plot |
| TGCLDLWP | cloud liquid water (ocean) | plot |
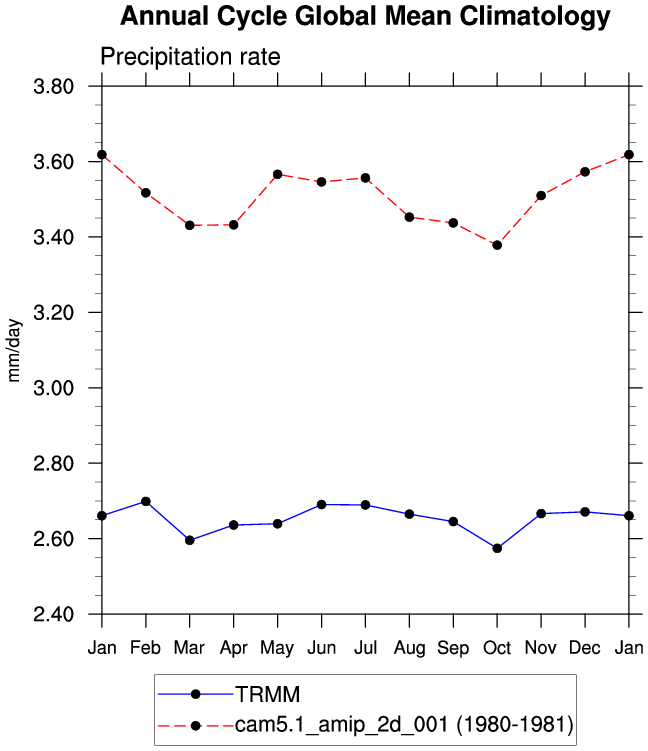
| TRMM (3B43) 1998-2009 | ||
| PRECT | Precipitation rate (38S-38N) | plot |
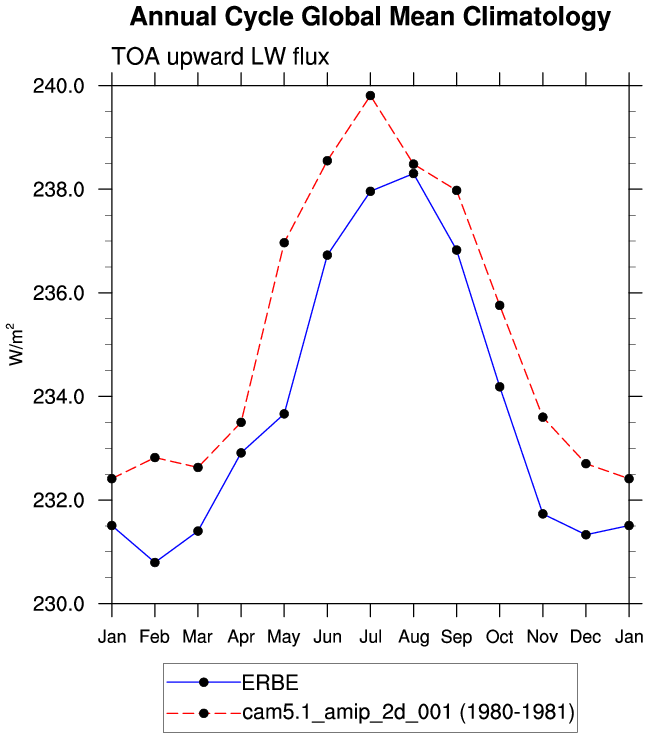
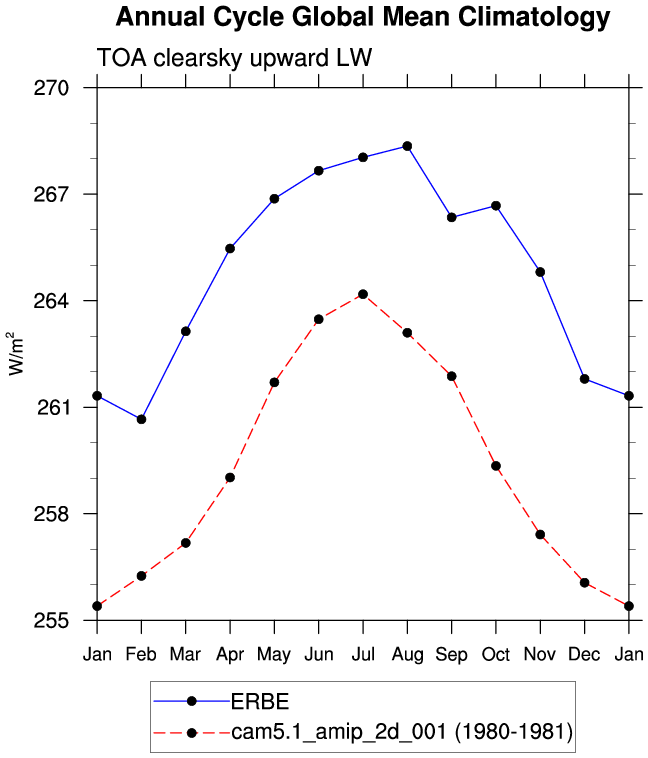
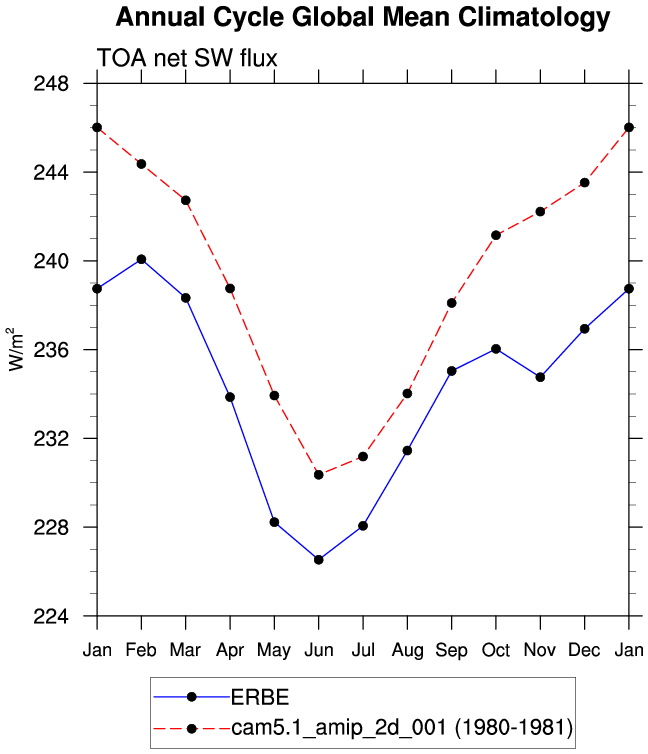
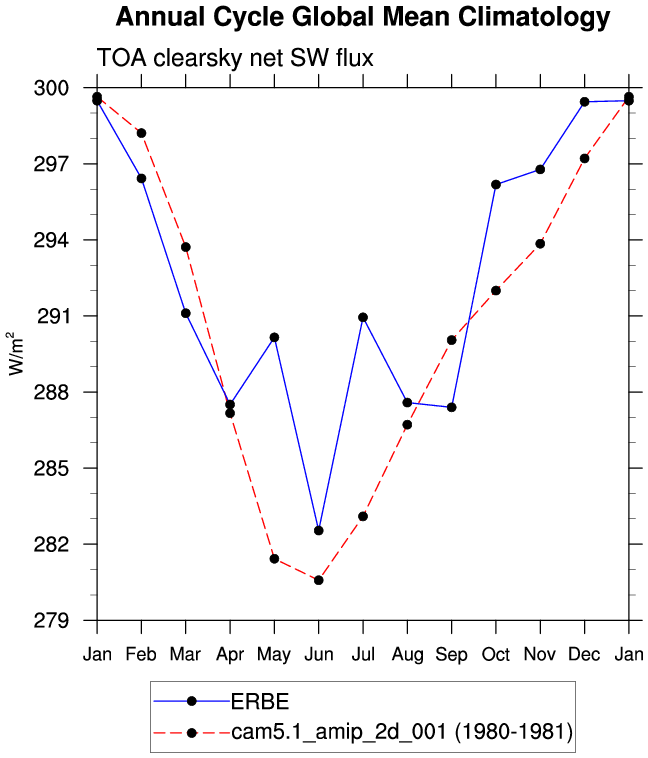
| ERBE Feb1985-Apr1989 | ||
| FLUT | TOA upward longwave flux | plot |
| FLUTC | TOA clearsky upward longwave flux | plot |
| FSNTOA | TOA net shortwave flux | plot |
| FSNTOAC | TOA clearsky net shortwave flux | plot |
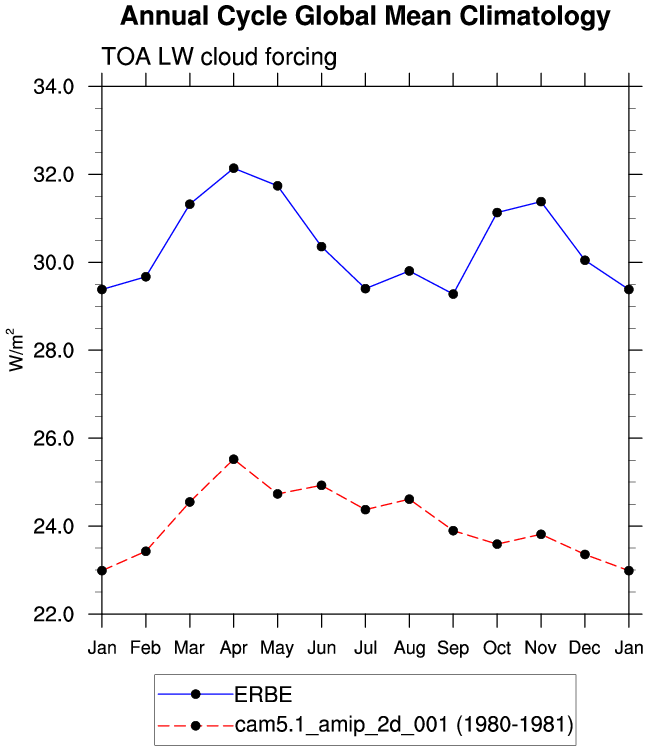
| LWCF | TOA longwave cloud forcing | plot |
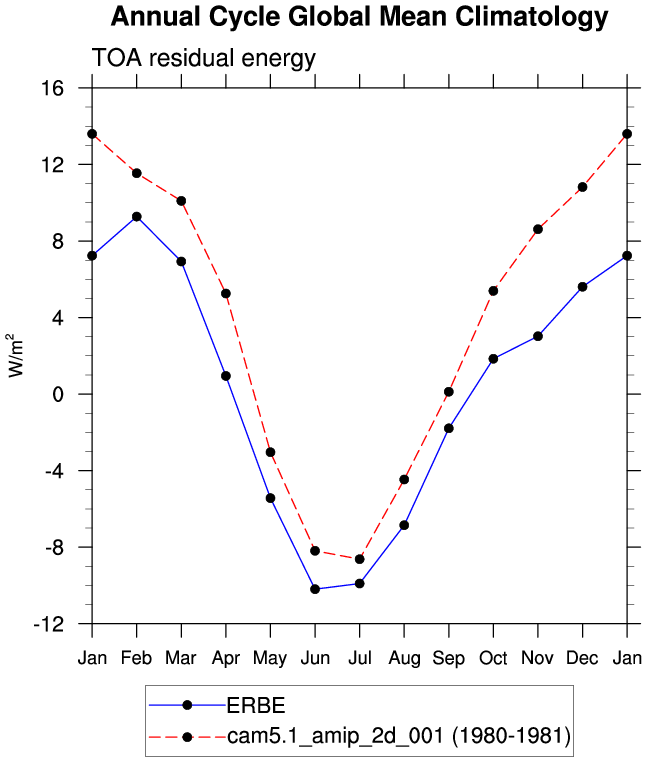
| RESTOA | TOA residual energy flux | plot |
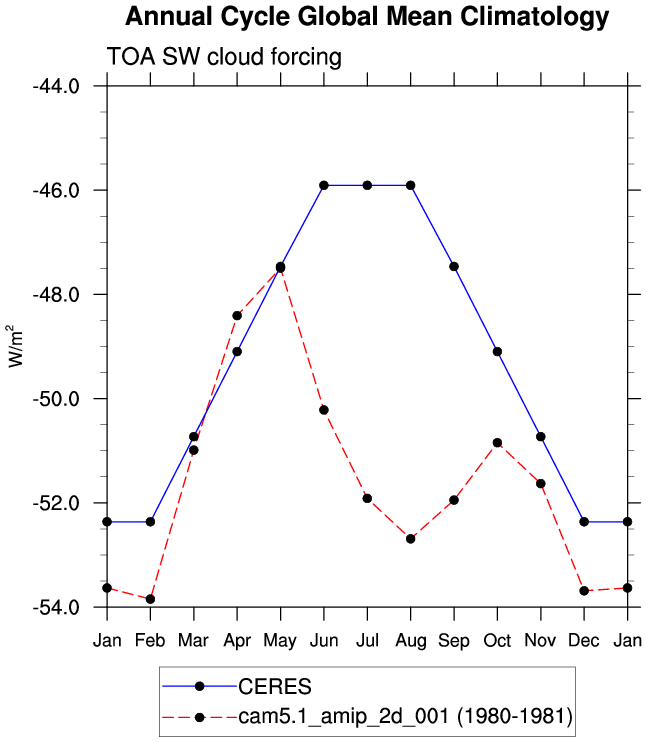
| SWCF | TOA shortwave cloud forcing | plot |
| CERES-EBAF March 2000-Feb 2010 | ||
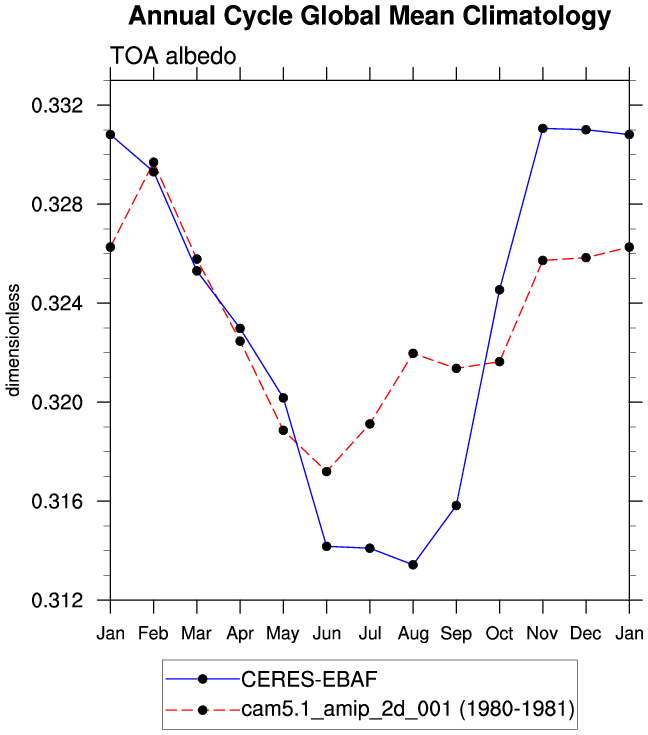
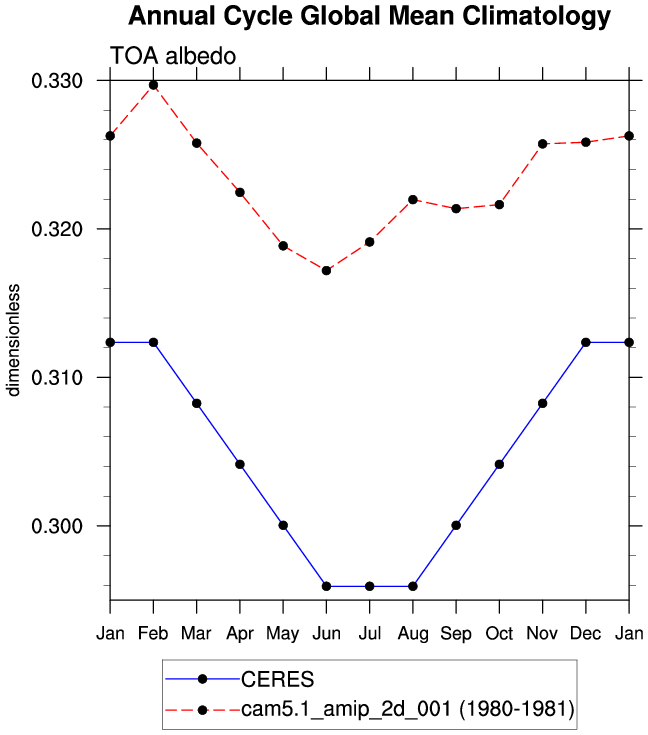
| ALBEDO | TOA albedo | plot |
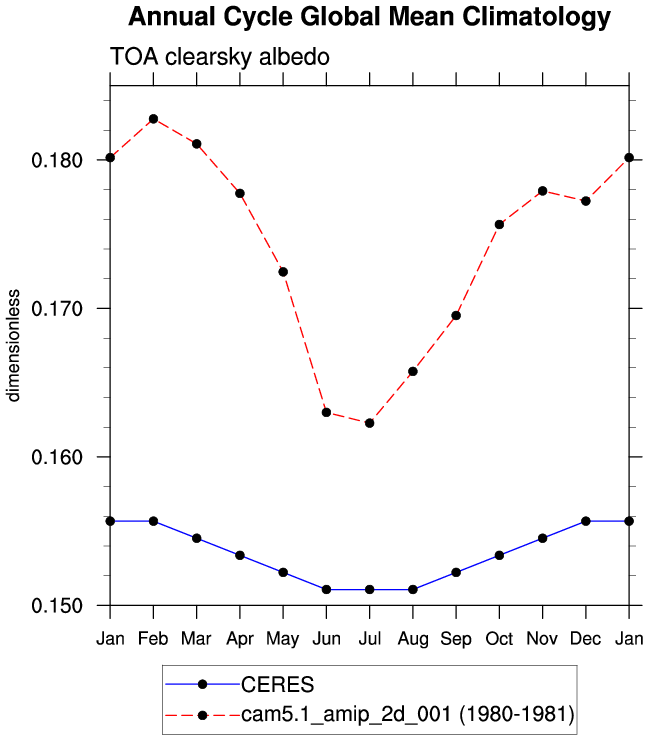
| ALBEDOC | TOA clearsky albedo | plot |
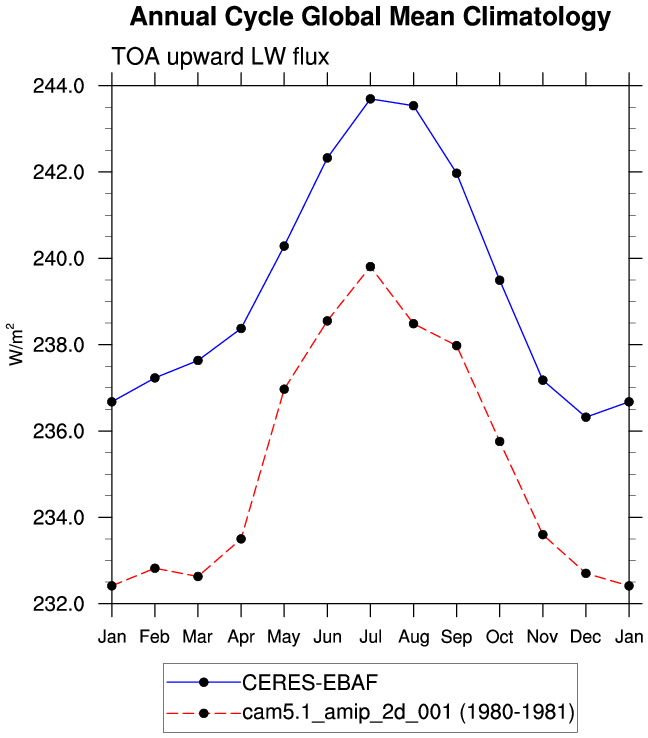
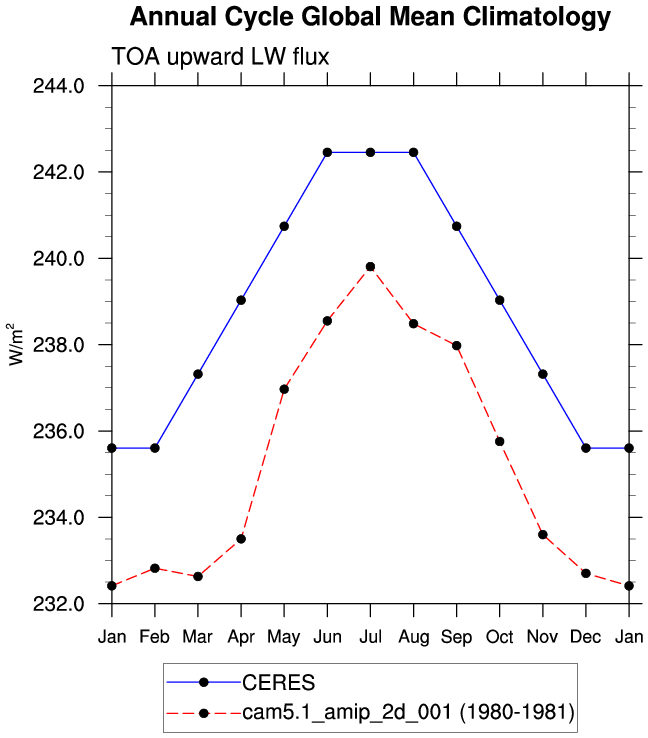
| FLUT * | TOA upward LW flux | plot |
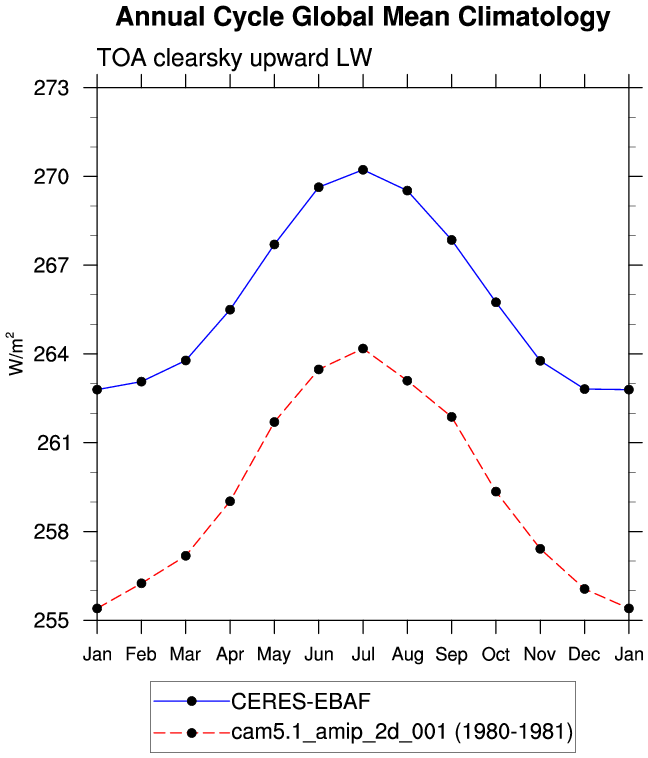
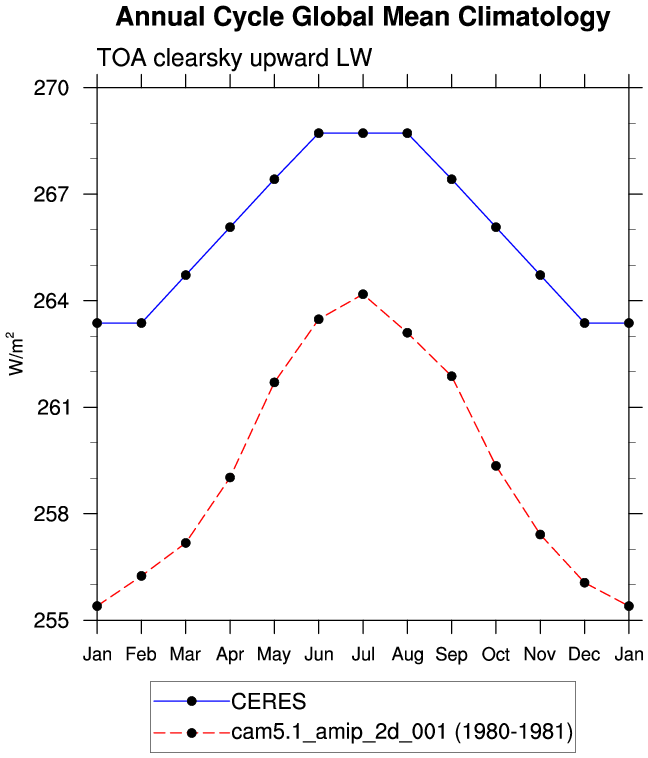
| FLUTC | TOA clearsky upward LW flux | plot |
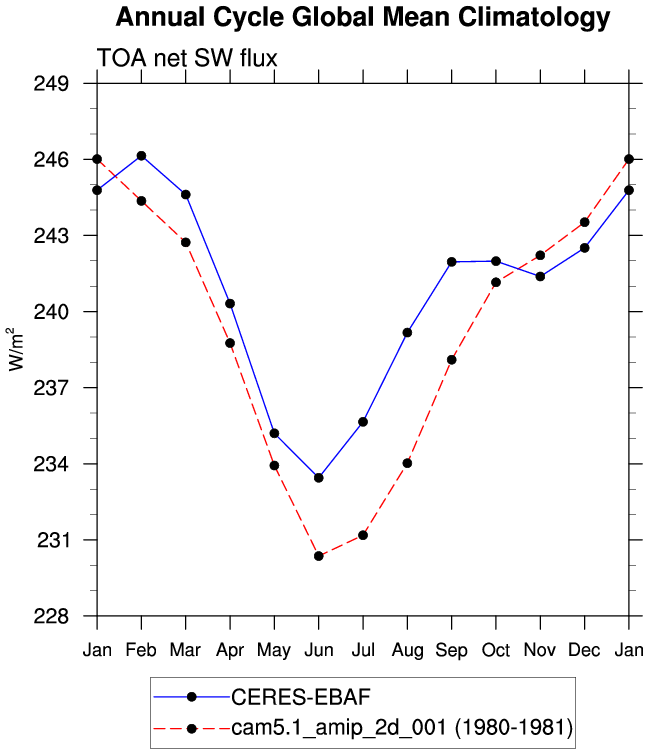
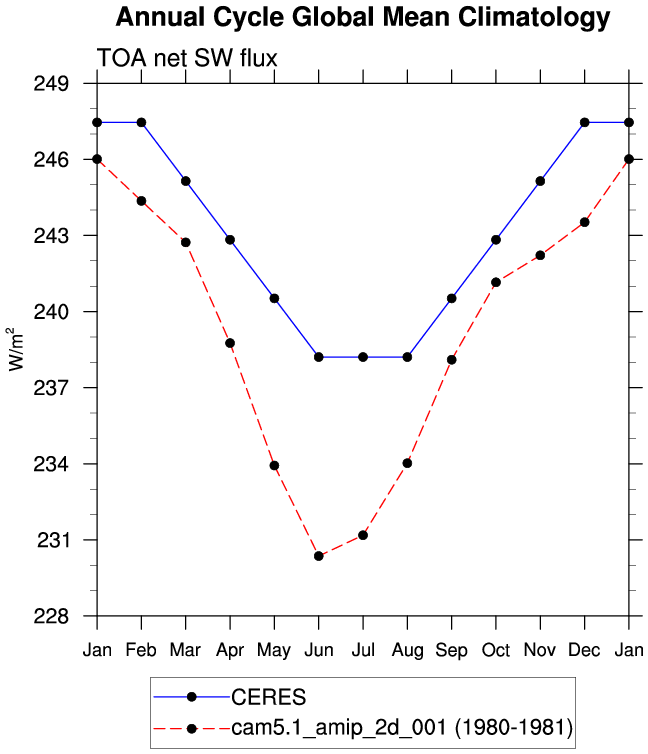
| FSNTOA * | TOA net SW flux | plot |
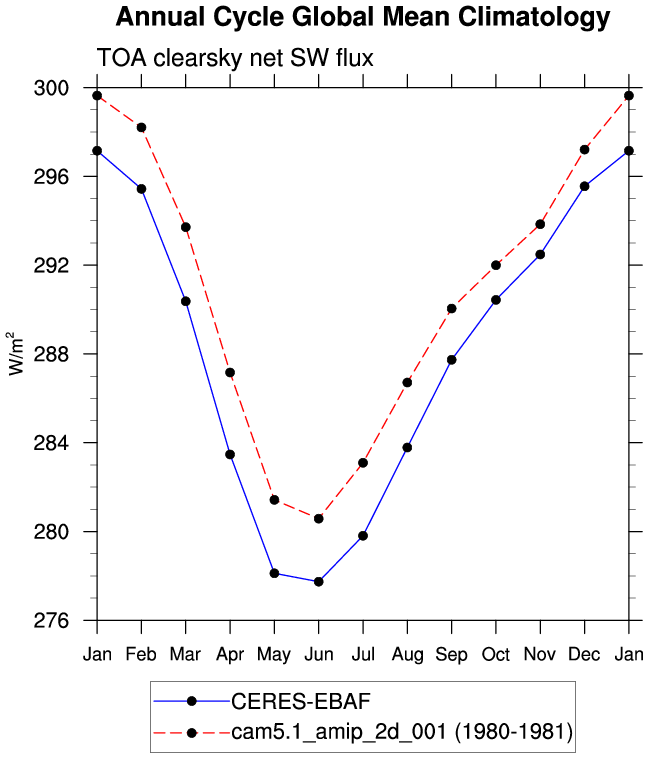
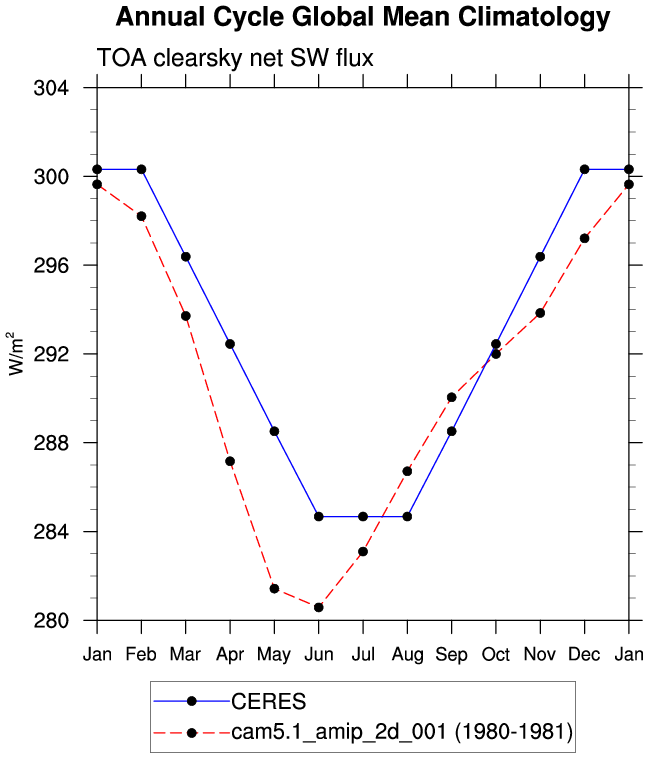
| FSNTOAC | TOA clearsky net SW flux | plot |
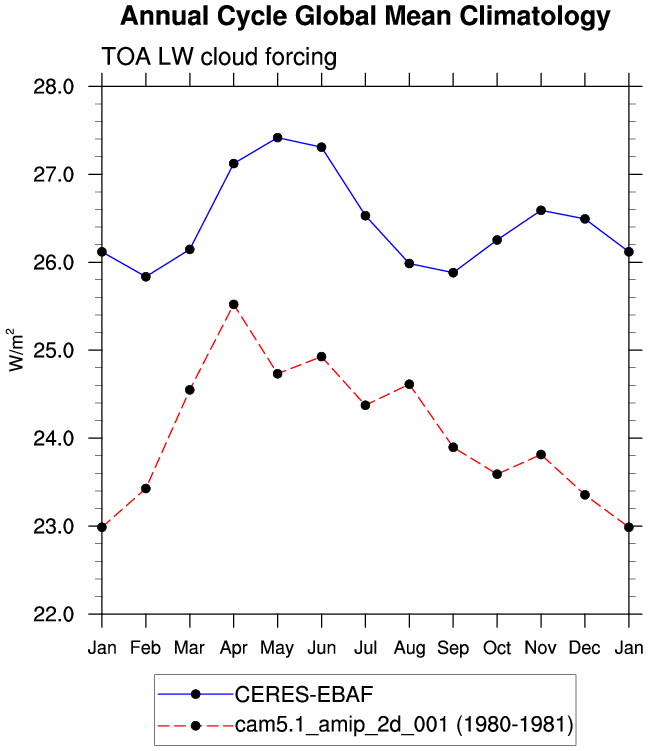
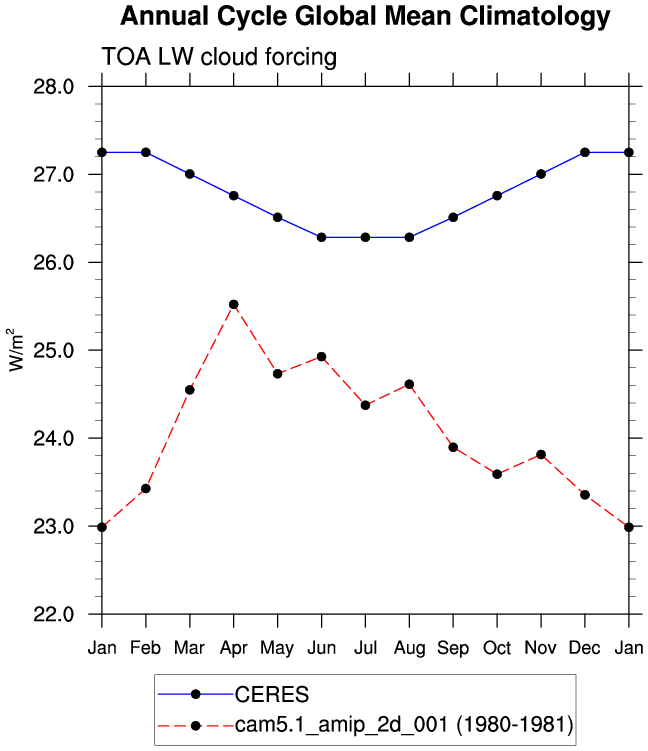
| LWCF * | TOA longwave cloud forcing | plot |
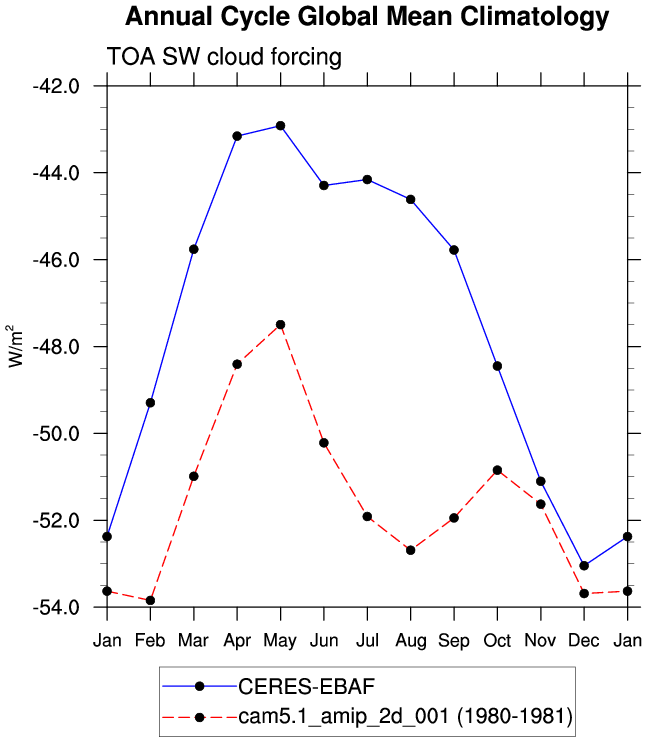
| SWCF * | TOA shortwave cloud forcing | plot |
| CERES 2000-2003 | ||
| ALBEDO | TOA albedo | plot |
| ALBEDOC | TOA clearsky albedo | plot |
| FLUT * | TOA upward LW flux | plot |
| FLUTC | TOA clearsky upward LW flux | plot |
| FSNTOA * | TOA net SW flux | plot |
| FSNTOAC | TOA clearsky net SW flux | plot |
| LWCF * | TOA longwave cloud forcing | plot |
| SWCF * | TOA shortwave cloud forcing | plot |
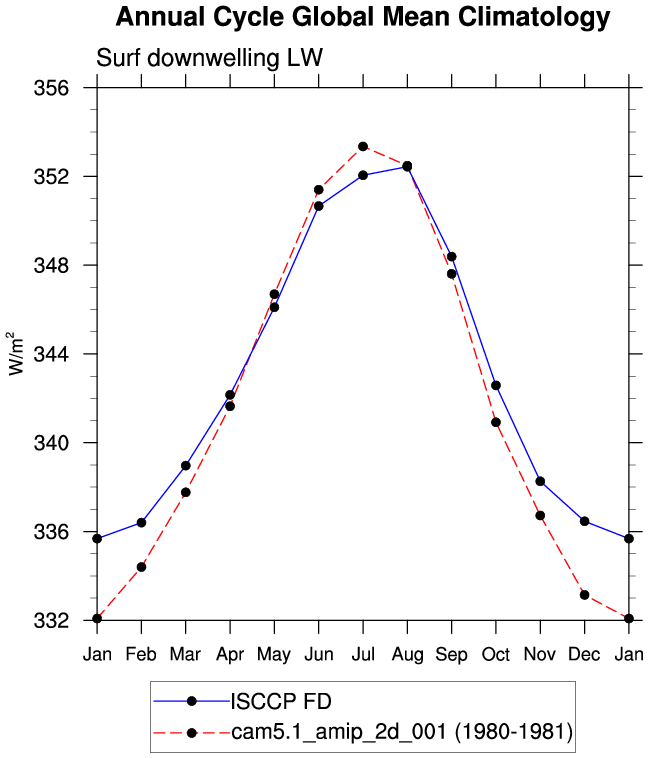
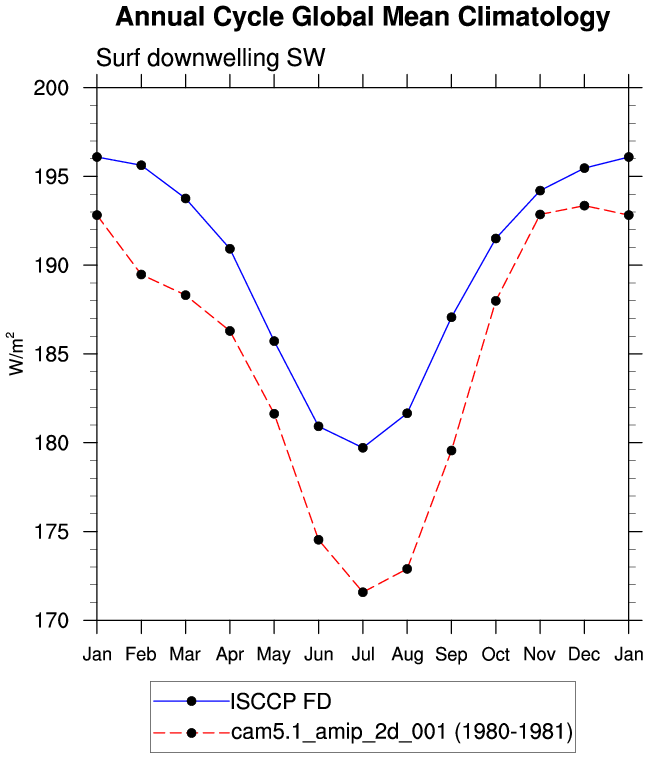
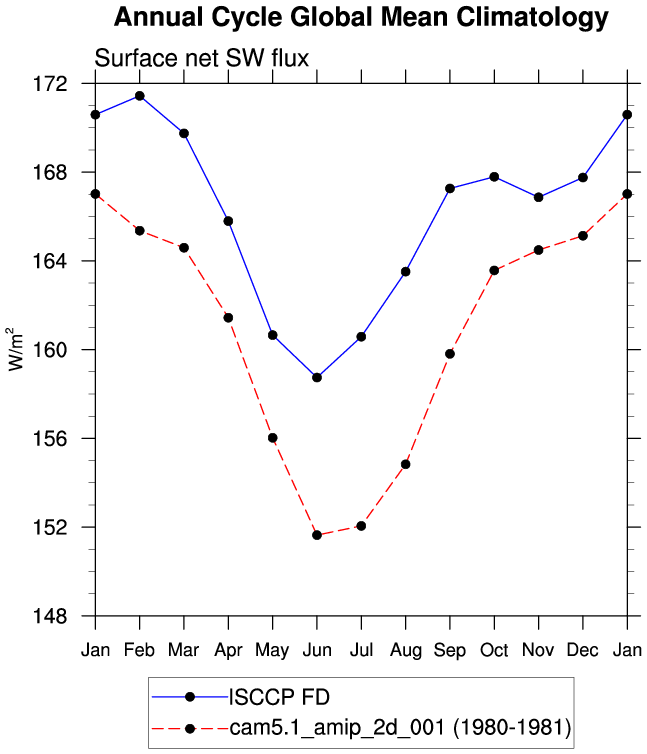
| ISCCP FD Jul1983-Dec2000 | ||
| FLDS | Surface LW downwelling flux | plot |
| FLNS | Surface Net LW flux | plot |
| FSDS | Surface SW downwelling flux | plot |
| FSNS | Surface Net SW flux | plot |
| ISCCP D2 1983-2001 | ||
| CLDHGH (IR clouds) | High-level cloud amount | plot |
| CLDHGH (VIS/IR/NIR clouds) | High-level cloud amount | plot |
| CLDLOW (IR clouds) | Low-level cloud amount | plot |
| CLDLOW (VIS/IR/NIR clouds) | Low-level cloud amount | plot |
| CLDMED (IR clouds) | Medium-level cloud amount | plot |
| CLDMED (VIS/IR/NIR clouds) | Medium-level cloud amount | plot |
| CLDTOT (IR clouds) | Total cloud amount | plot |
| CLDTOT (VIS/IR/NIR clouds) | Total cloud amount | plot |