 cam5.1_amip_2d_001
 and
OBS data
cam5.1_amip_2d_001
and
OBS data
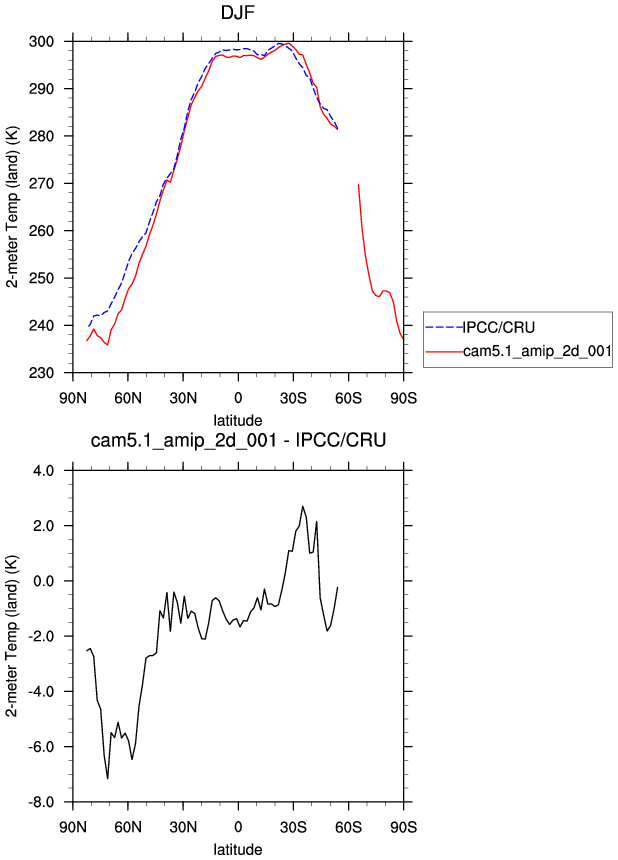
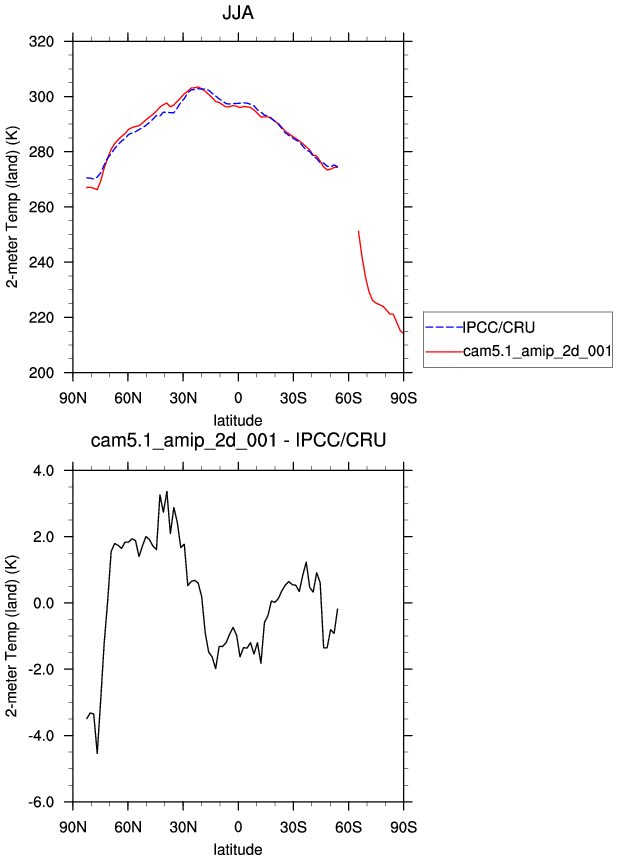
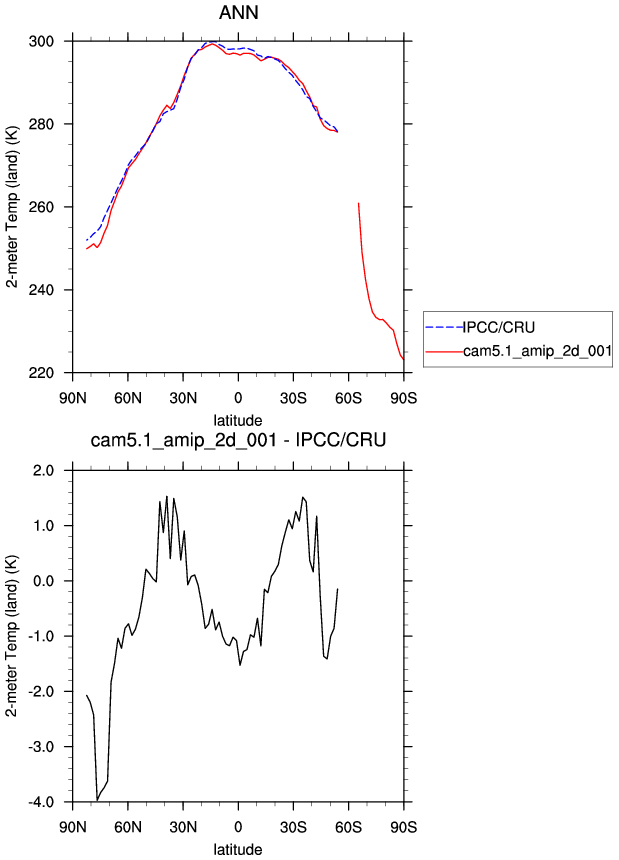
DIAG Set 3 - Line plots of DJF, JJA and ANN zonal means
| IPCC/CRU climatology 1961-90 | DJF | JJA | ANN | |
|---|---|---|---|---|
| TREFHT * | 2-meter air temperature (land) | plot | plot | plot |
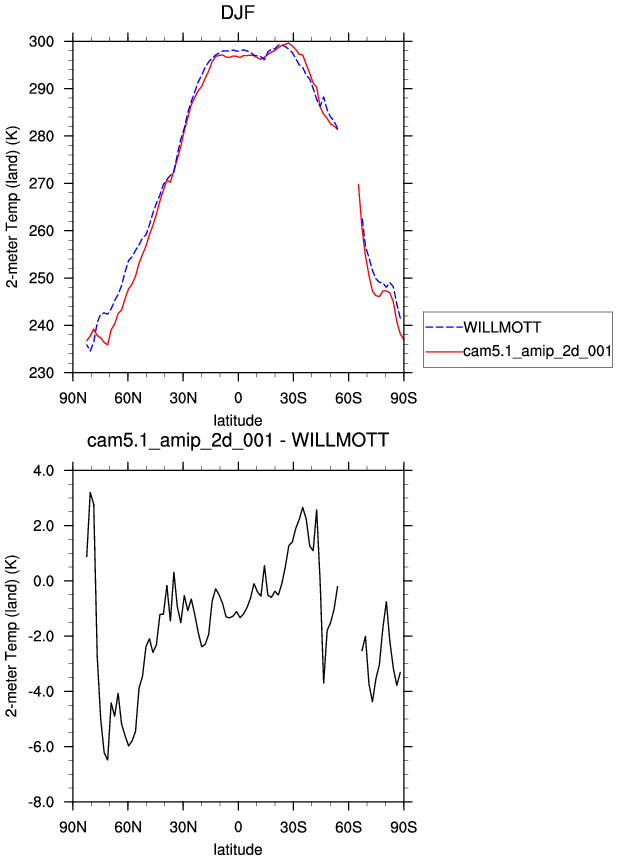
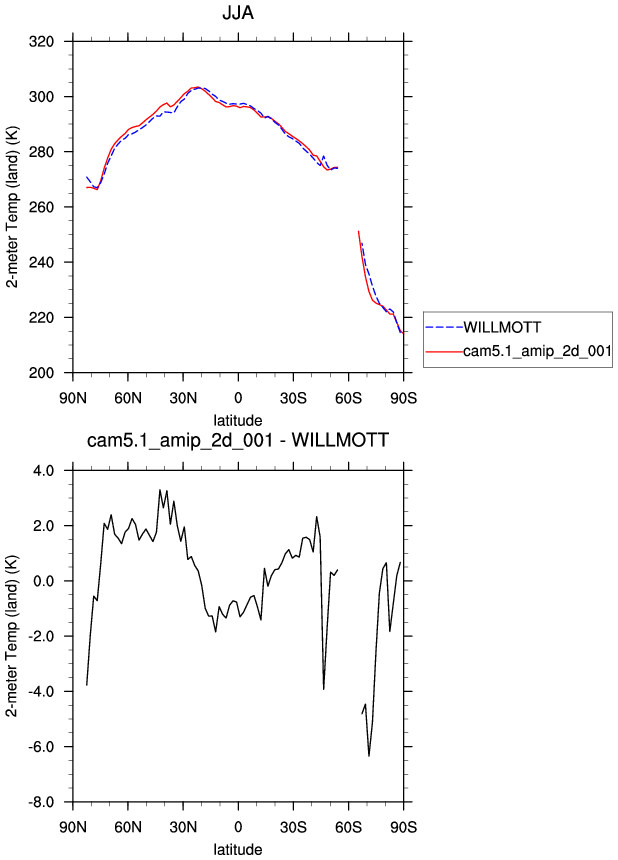
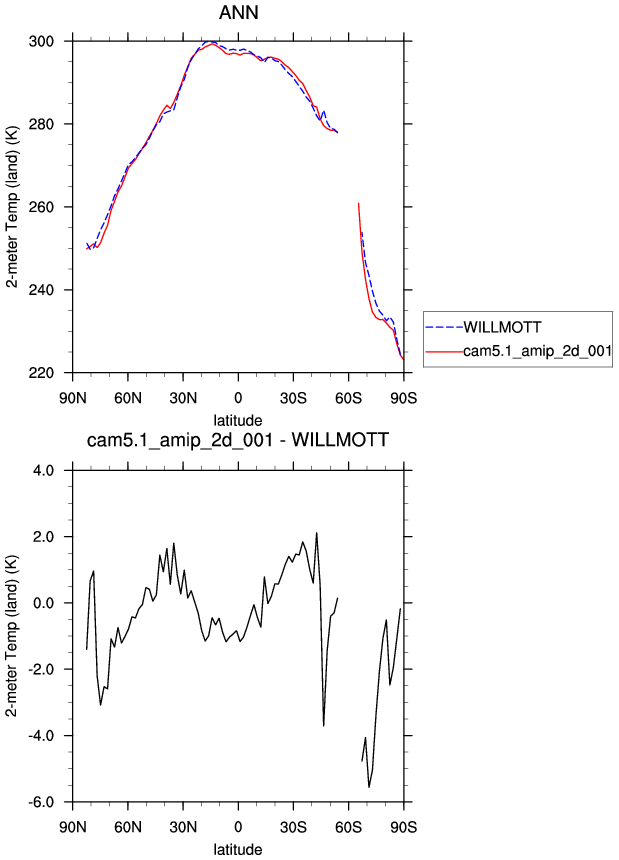
| Willmott & Matsuura 1950-99 | DJF | JJA | ANN | |
| TREFHT * | 2-meter air temperature (land) | plot | plot | plot |
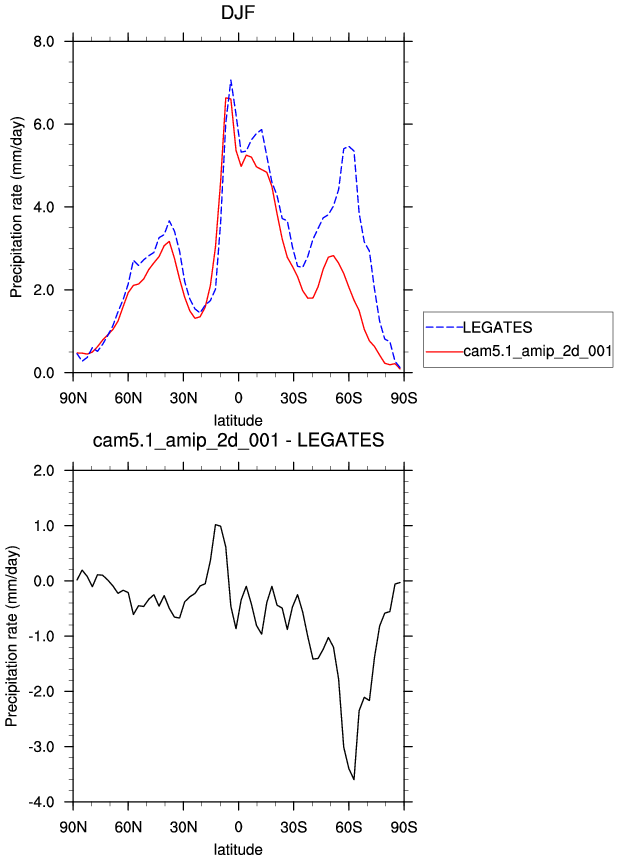
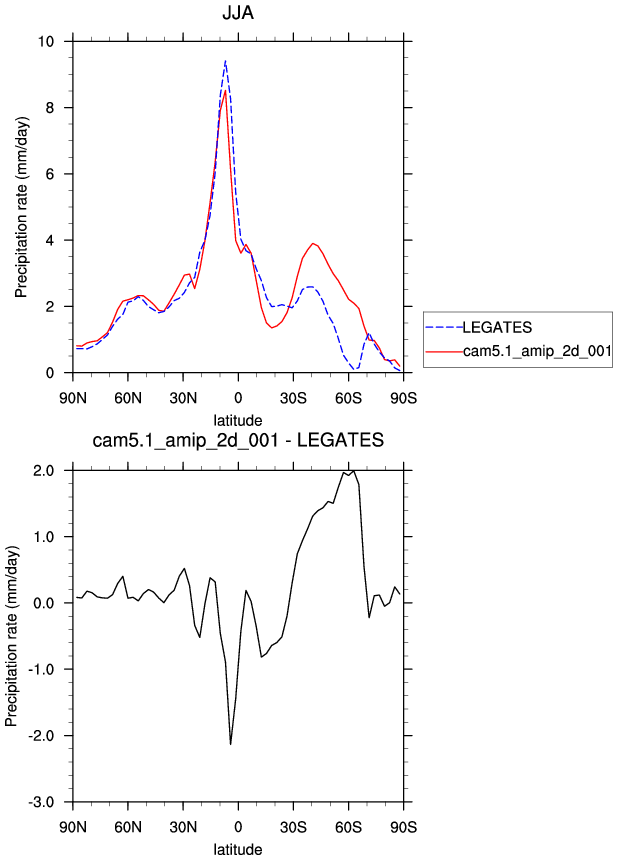
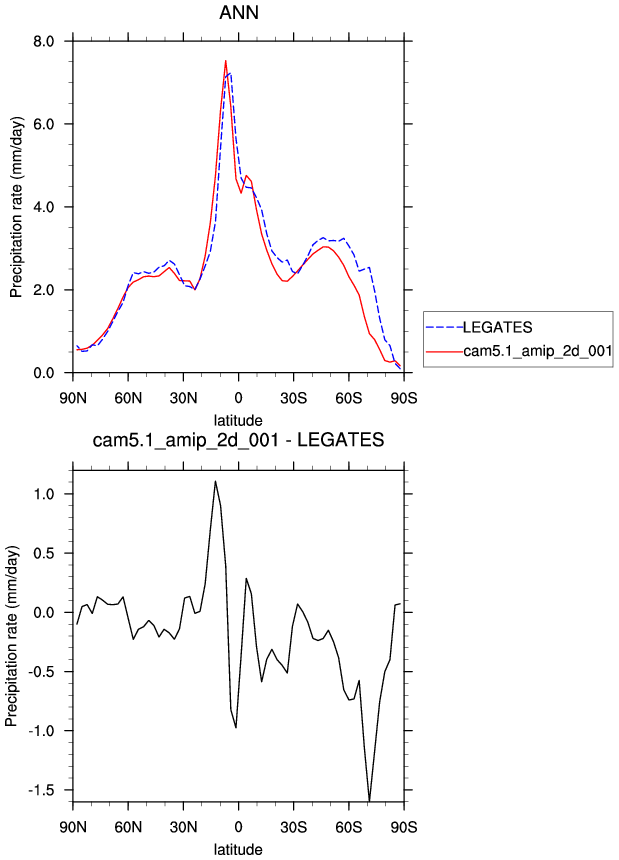
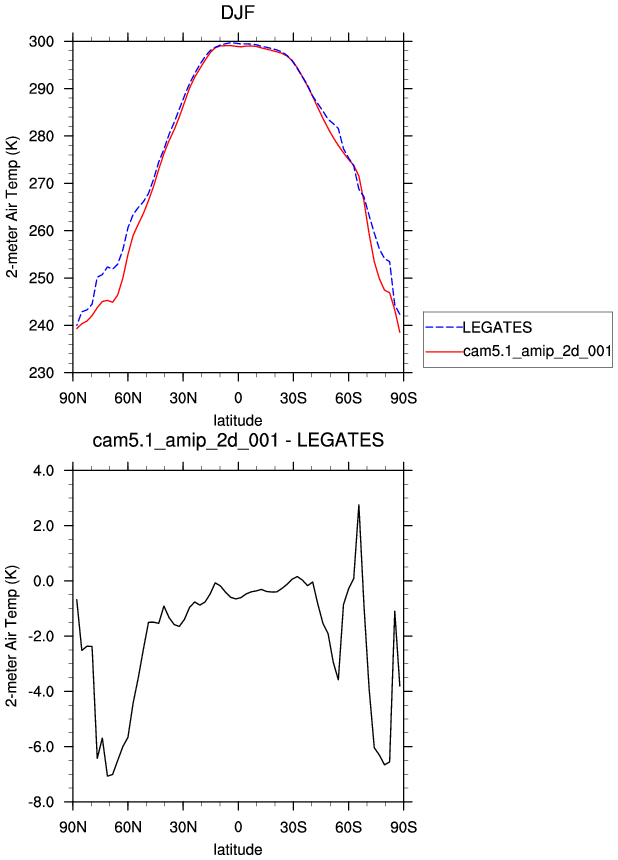
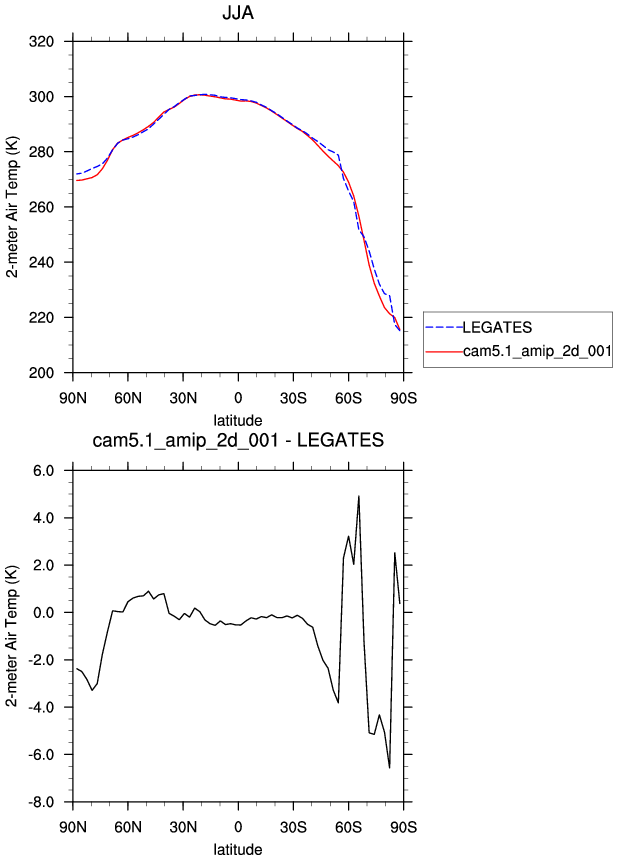
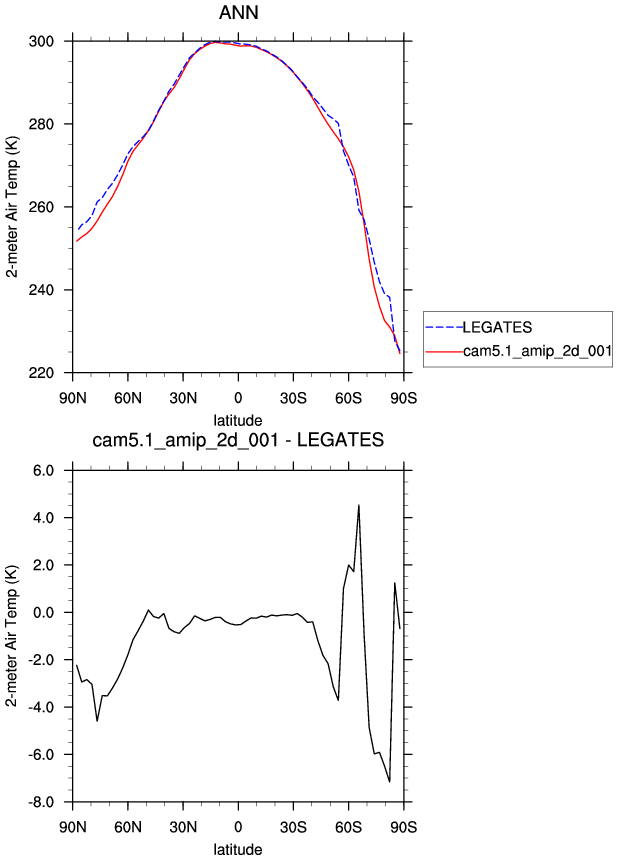
| Legates & Willmott 1920-80 | DJF | JJA | ANN | |
| PRECT * | Precipitation rate | plot | plot | plot |
| TREFHT * | 2-meter air temperature | plot | plot | plot |
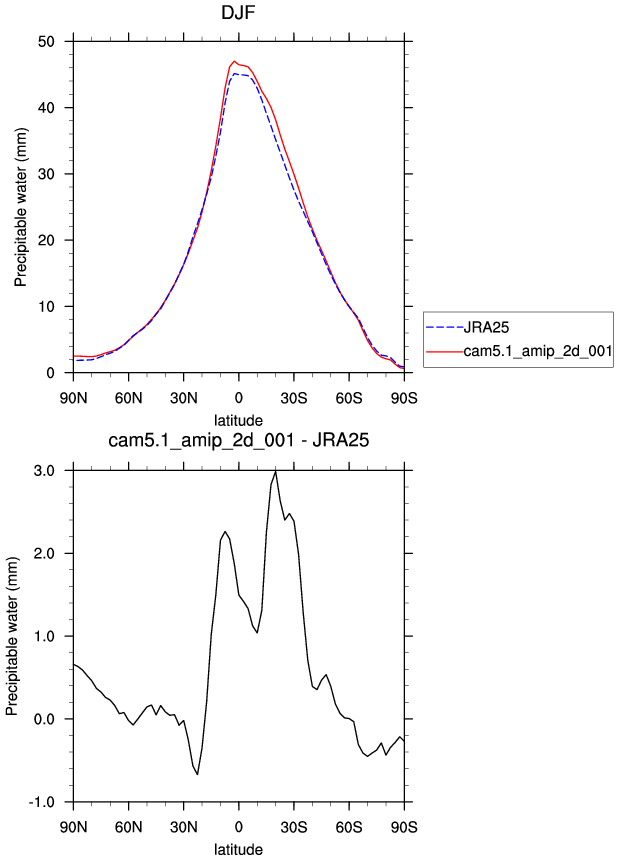
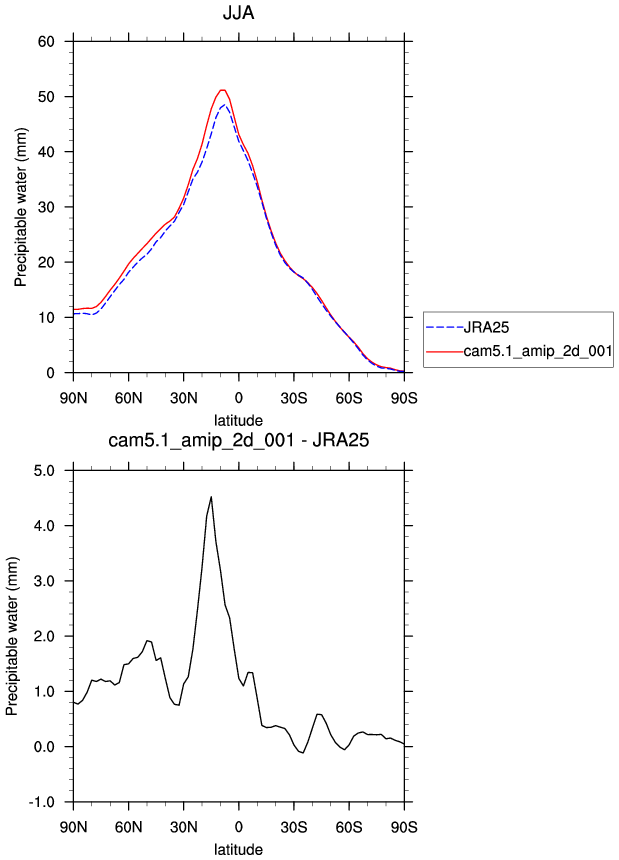
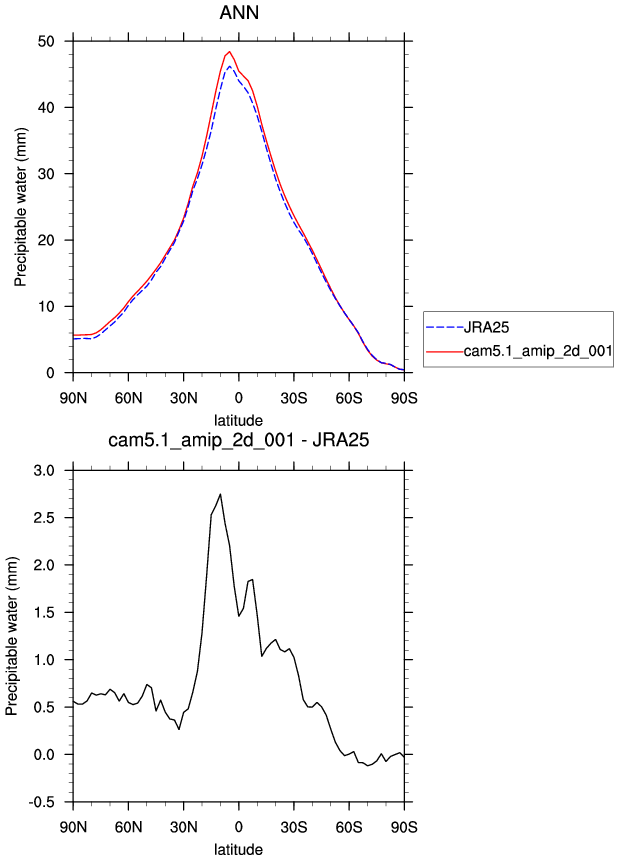
| JRA25 Reanalysis 1979-2004 | DJF | JJA | ANN | |
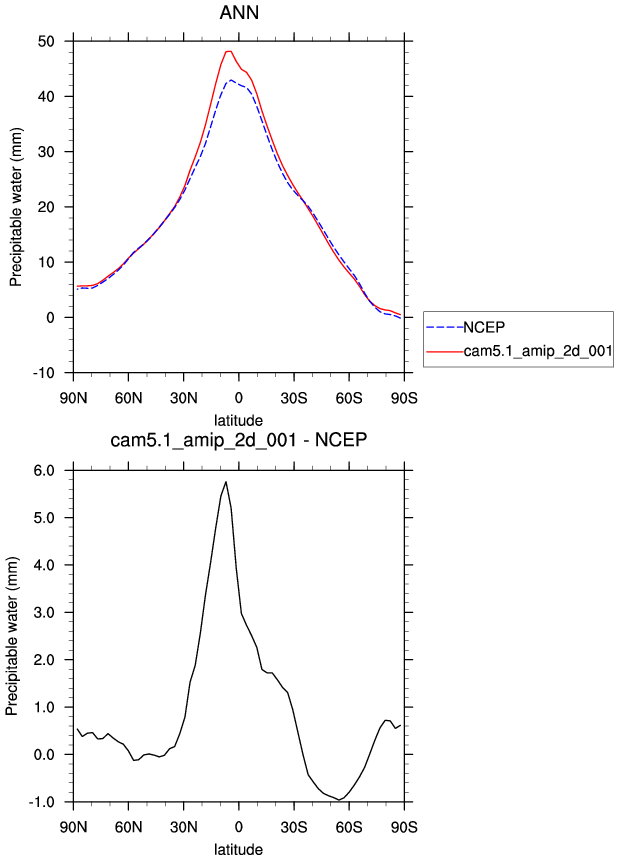
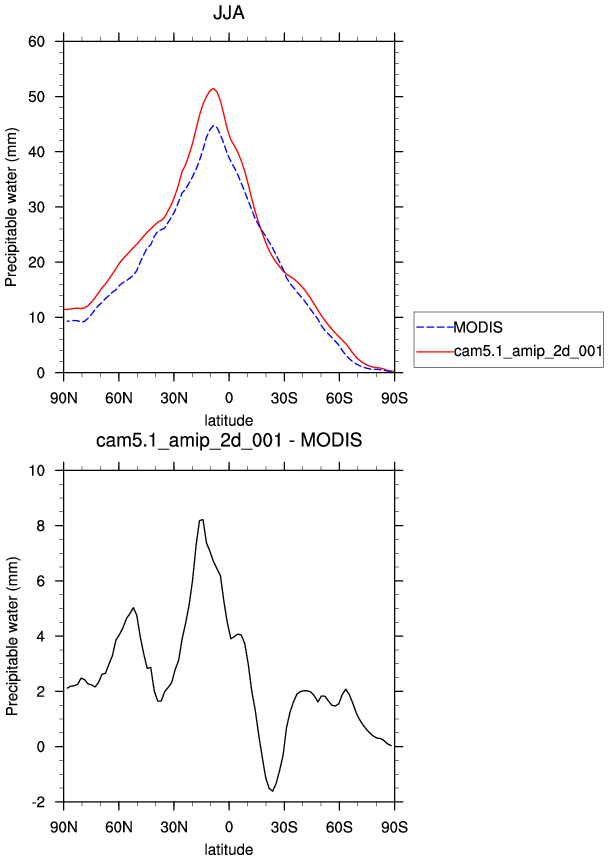
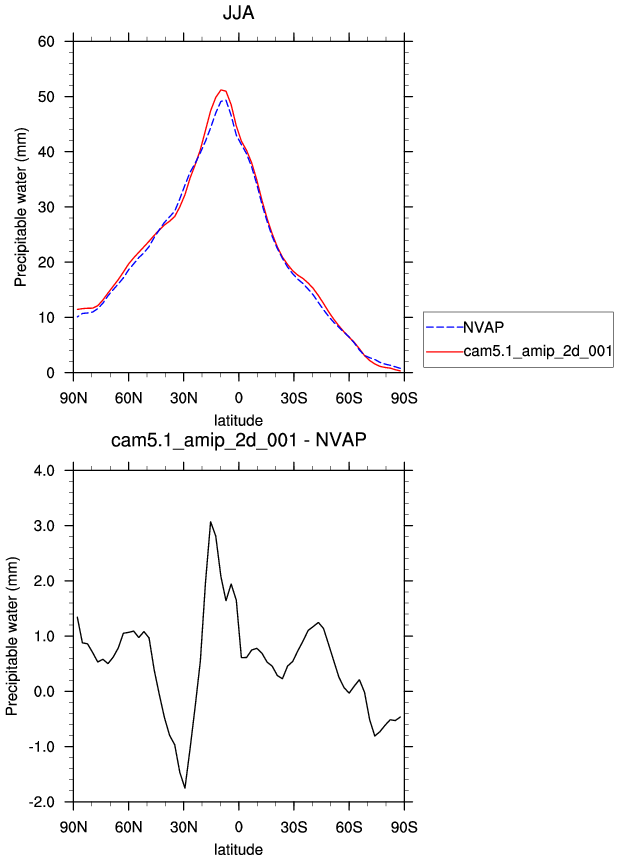
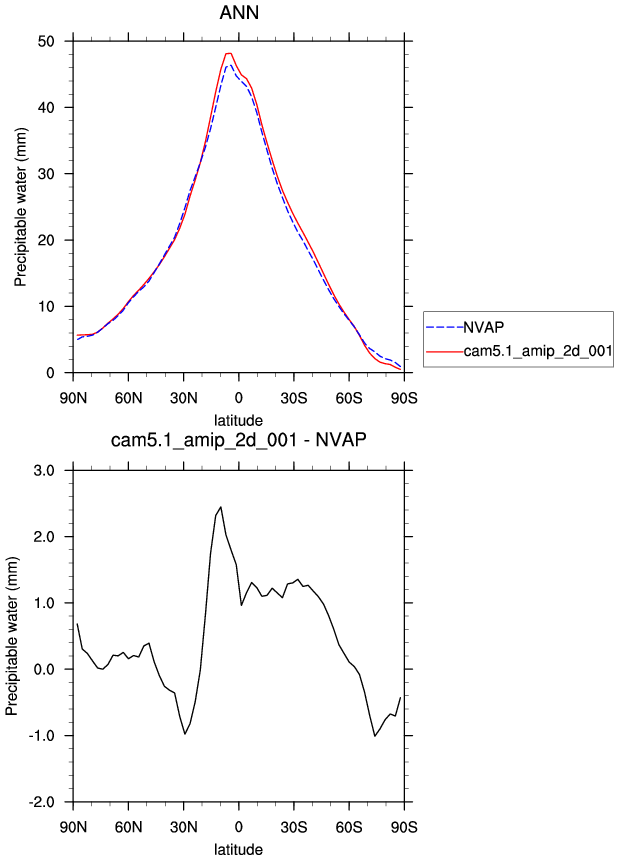
| PREH2O * | Total precipitable water | plot | plot | plot |
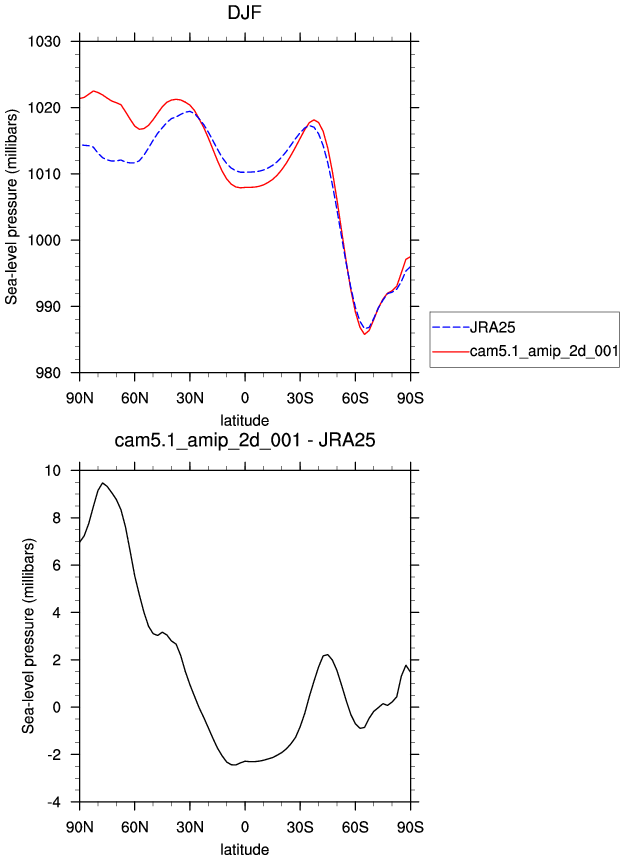
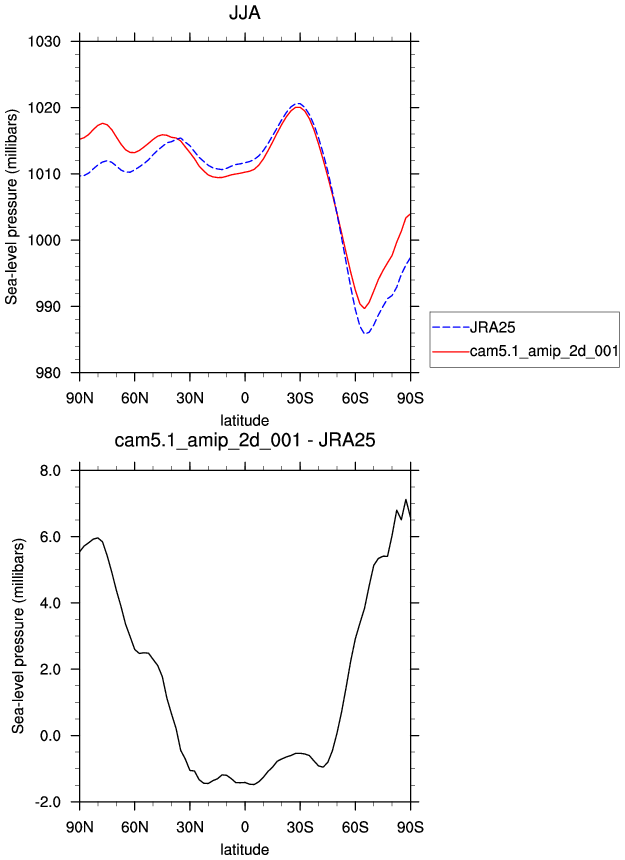
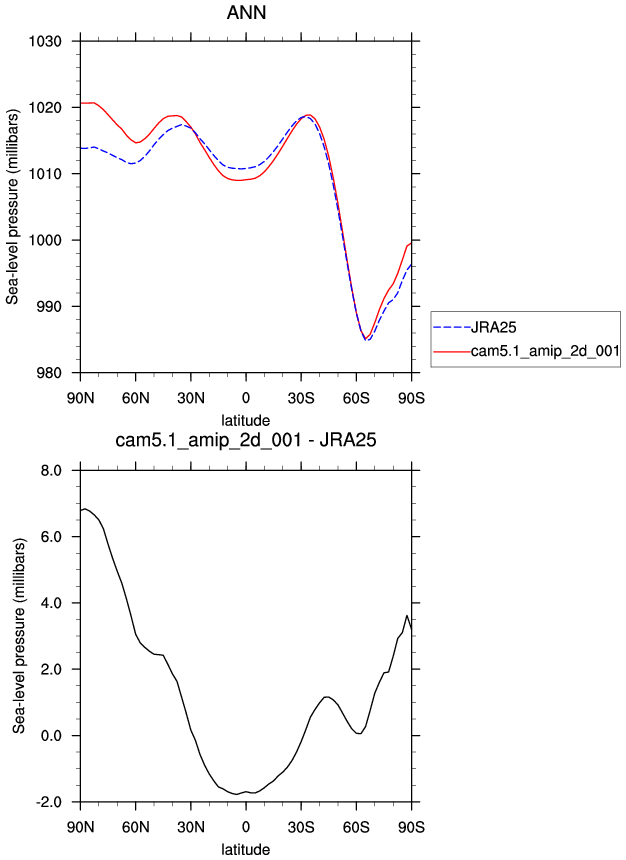
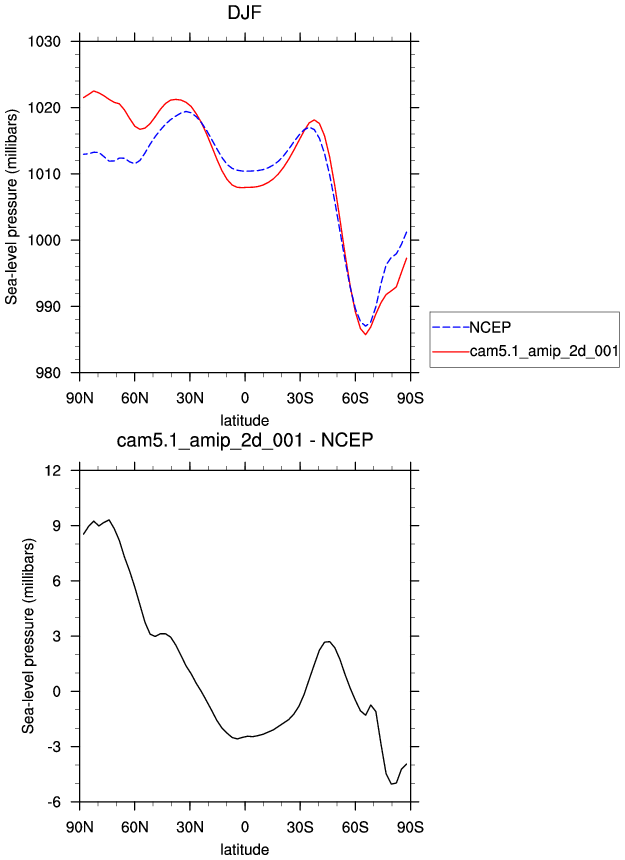
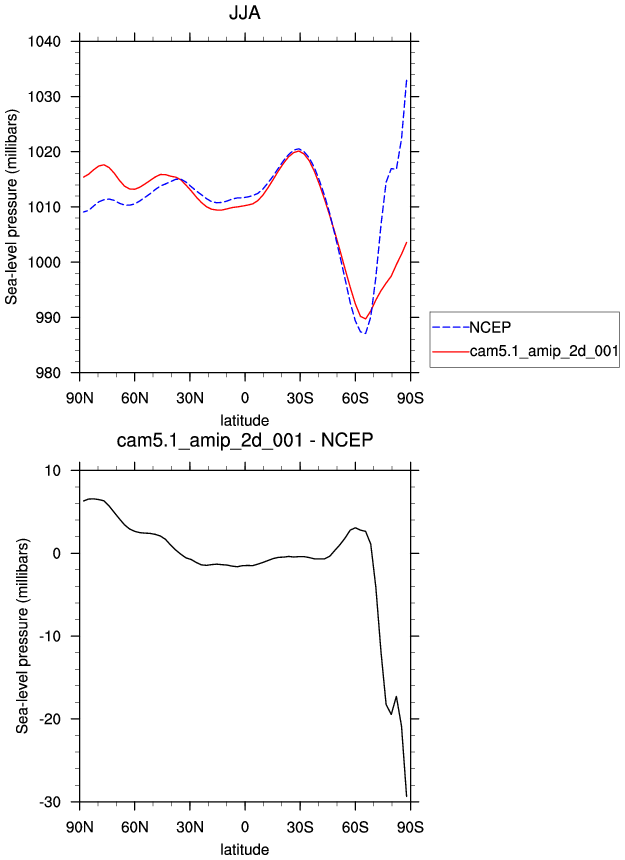
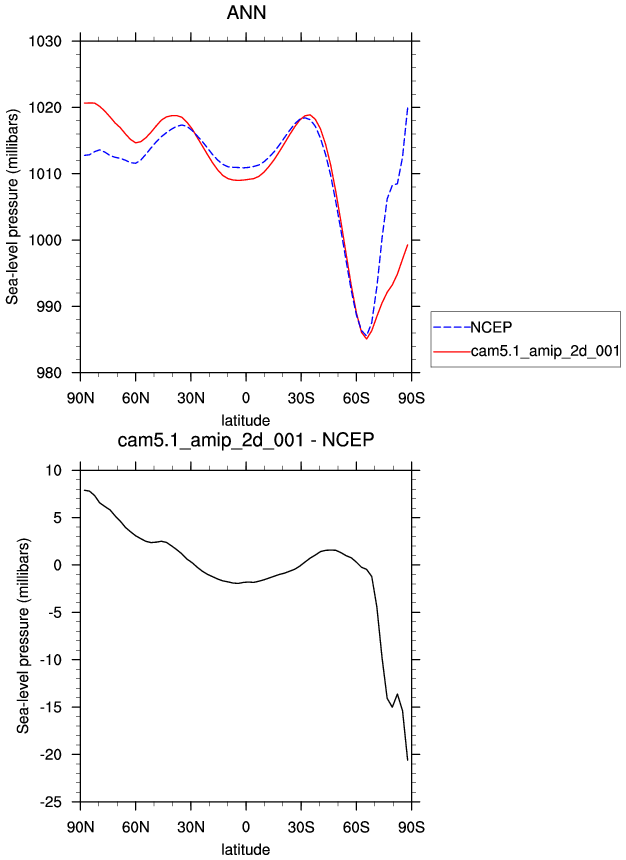
| PSL * | Sea level pressure | plot | plot | plot |
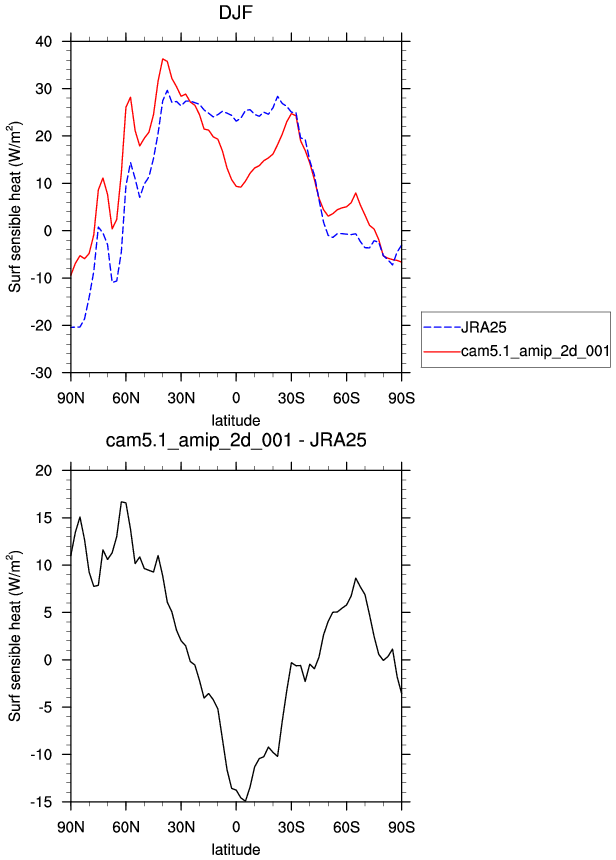
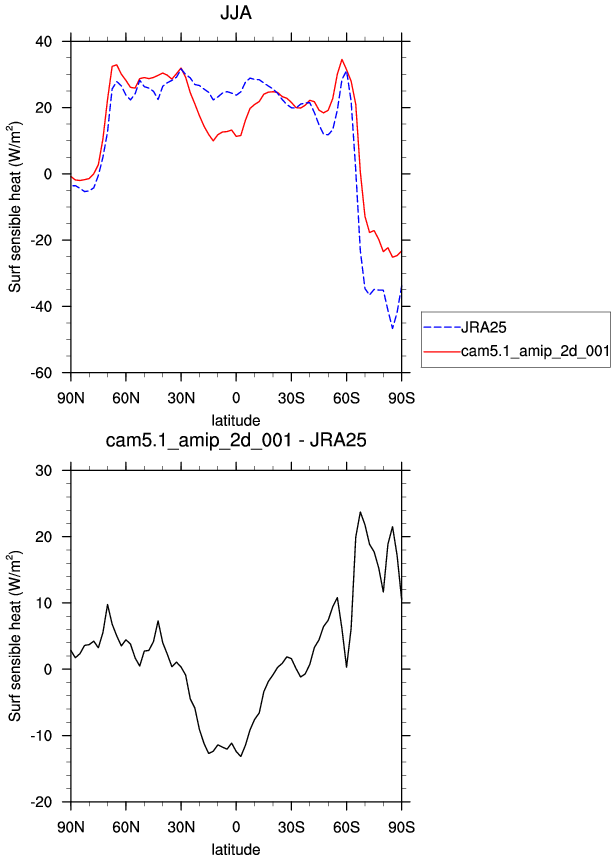
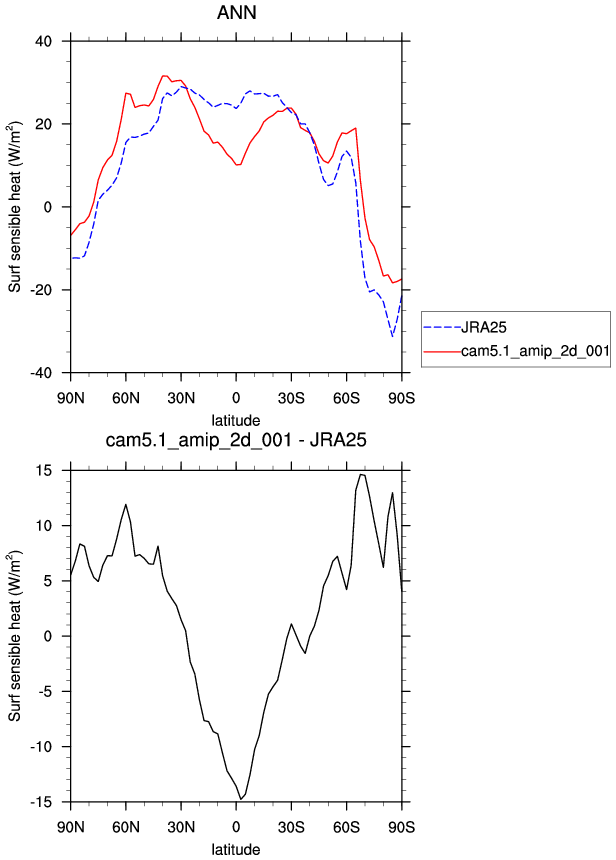
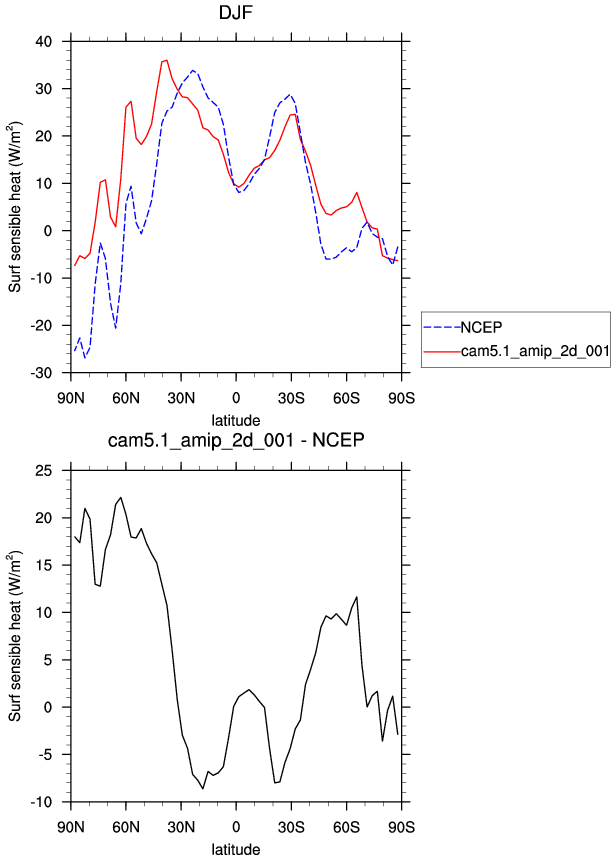
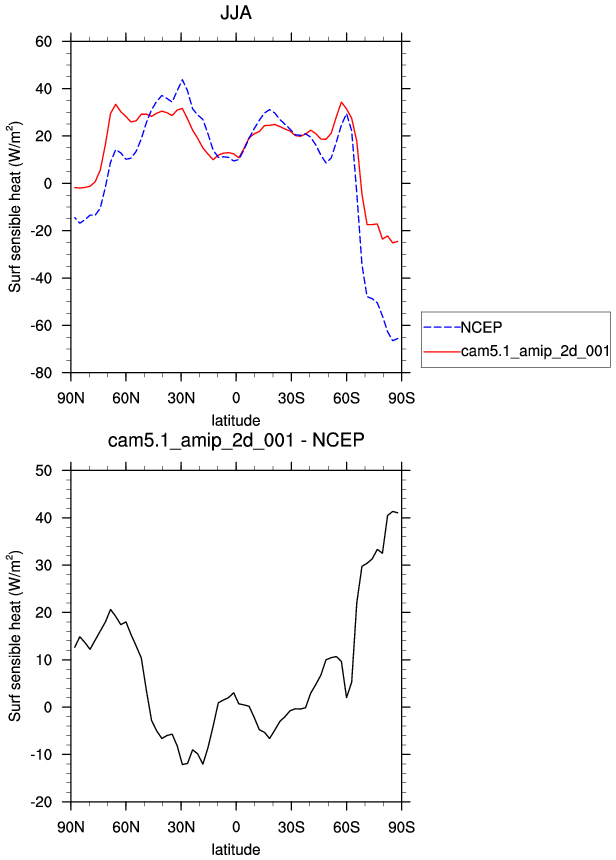
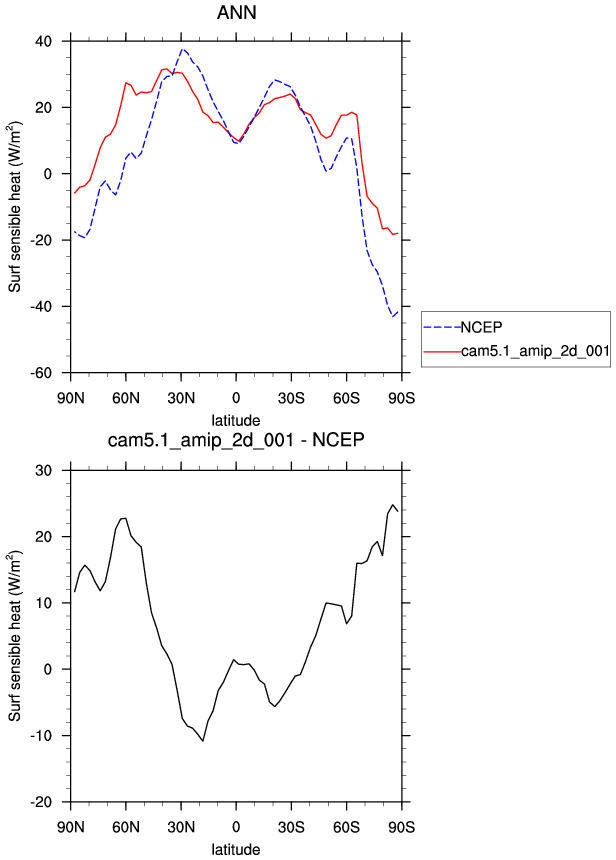
| SHFLX | Surface sensible heat flux | plot | plot | plot |
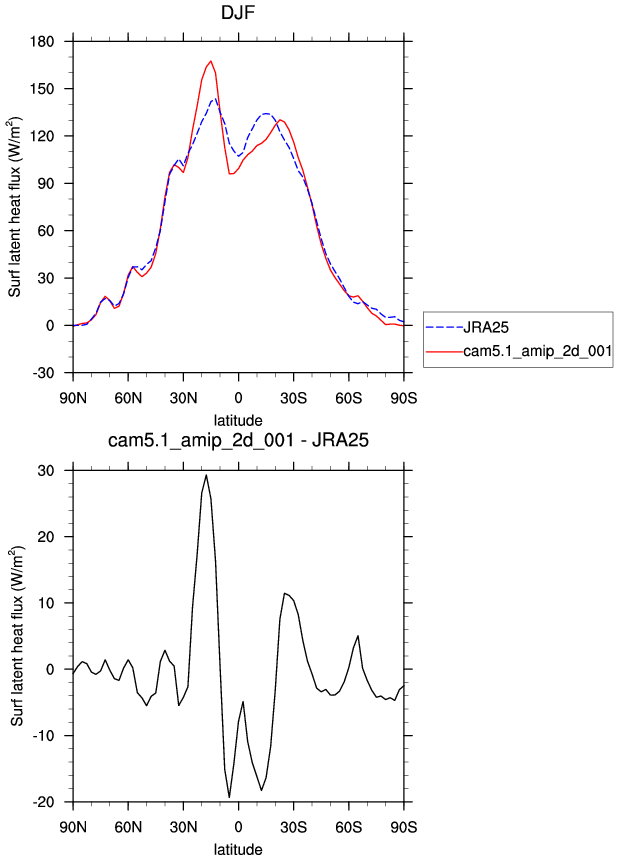
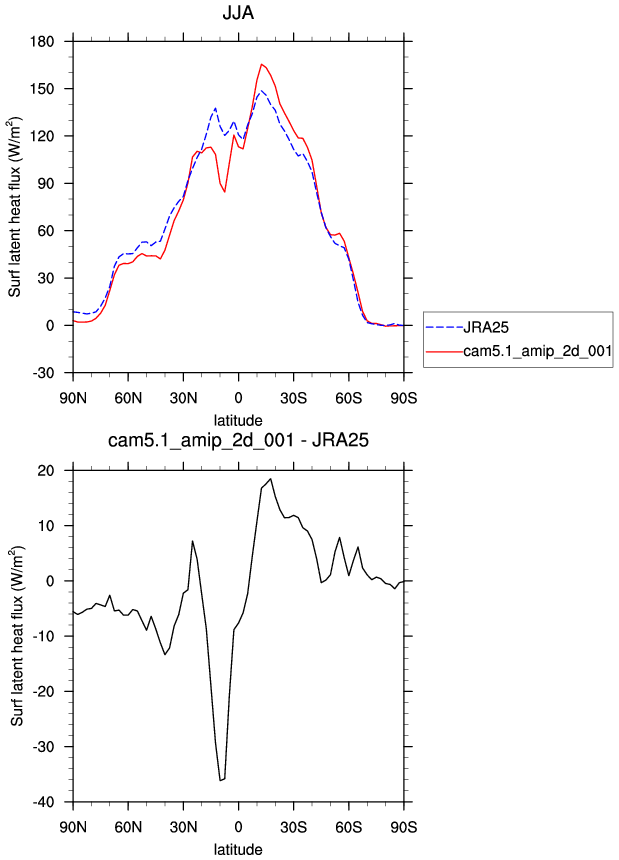
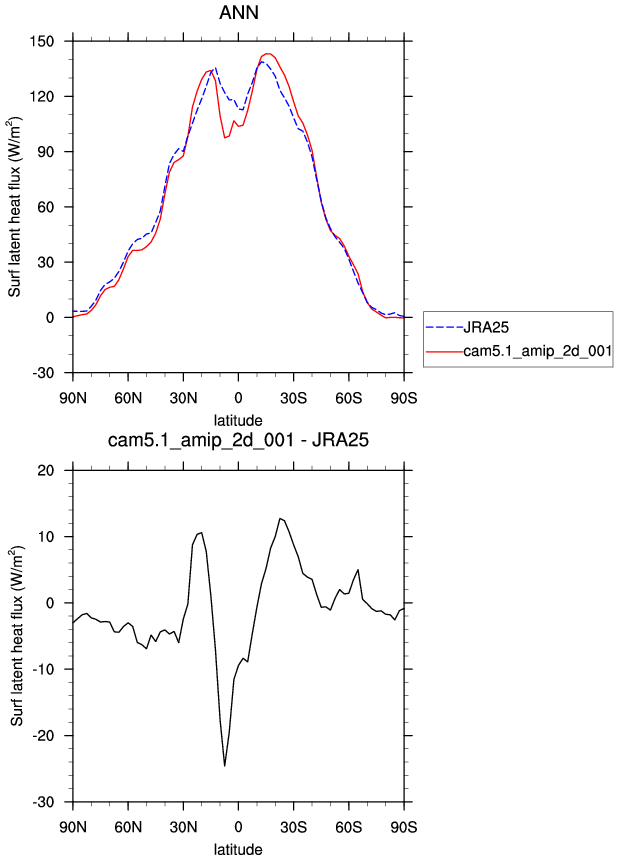
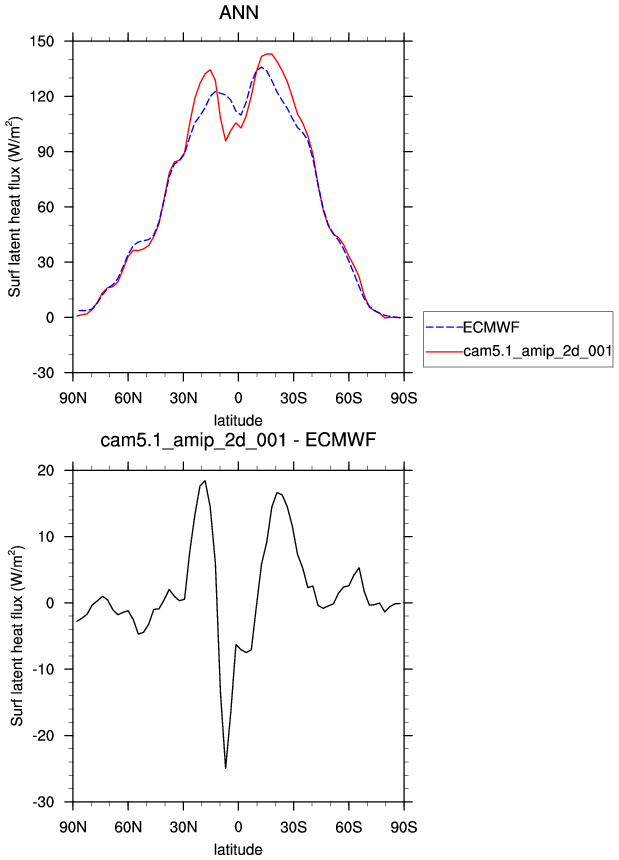
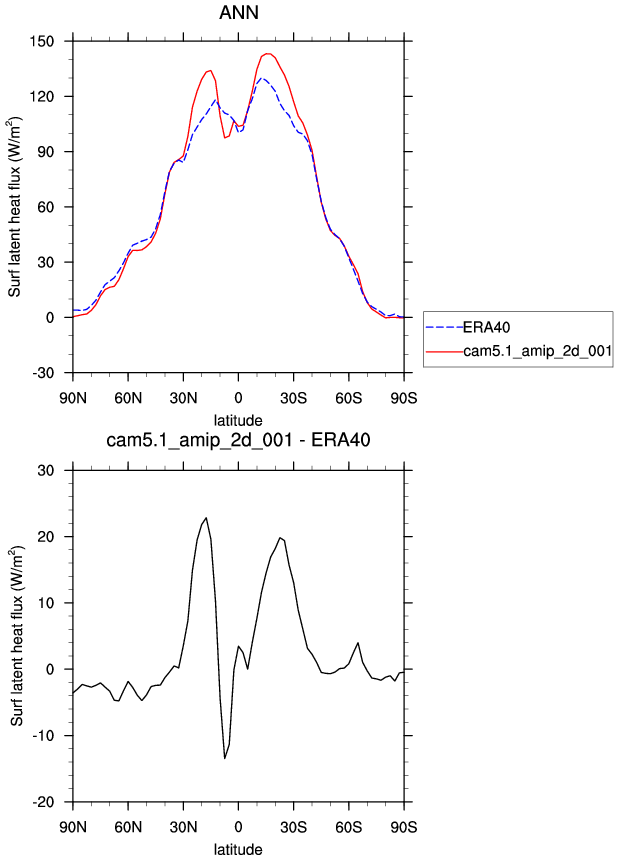
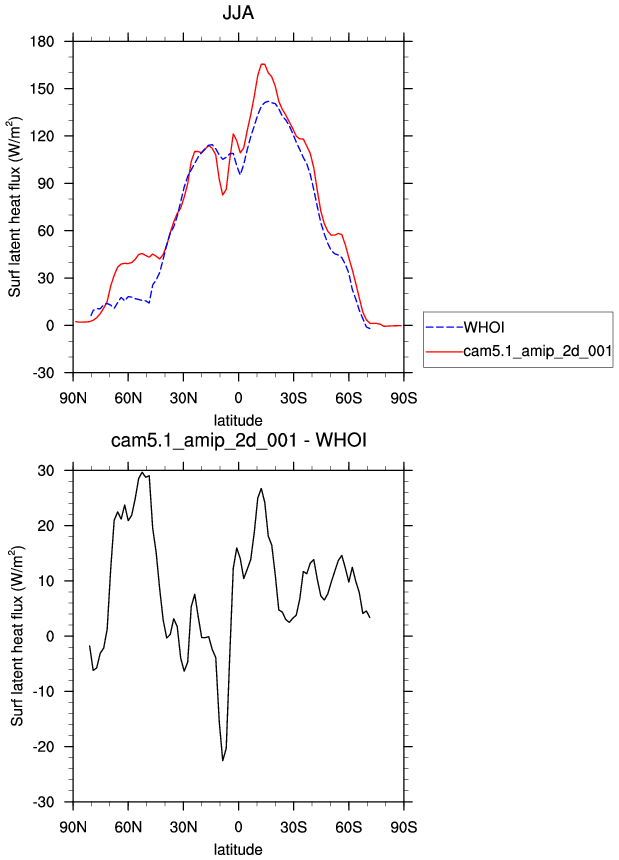
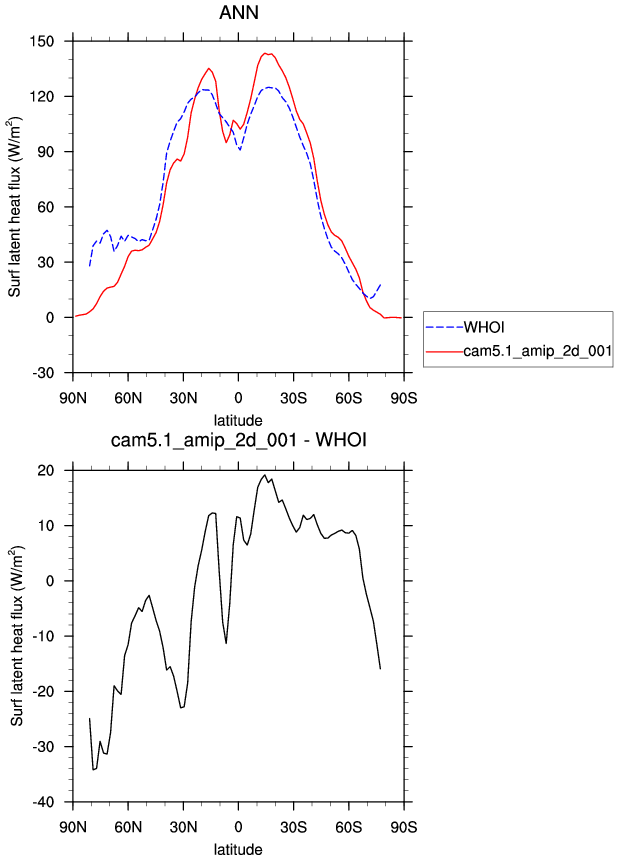
| LHFLX | Surface latent heat flux | plot | plot | plot |
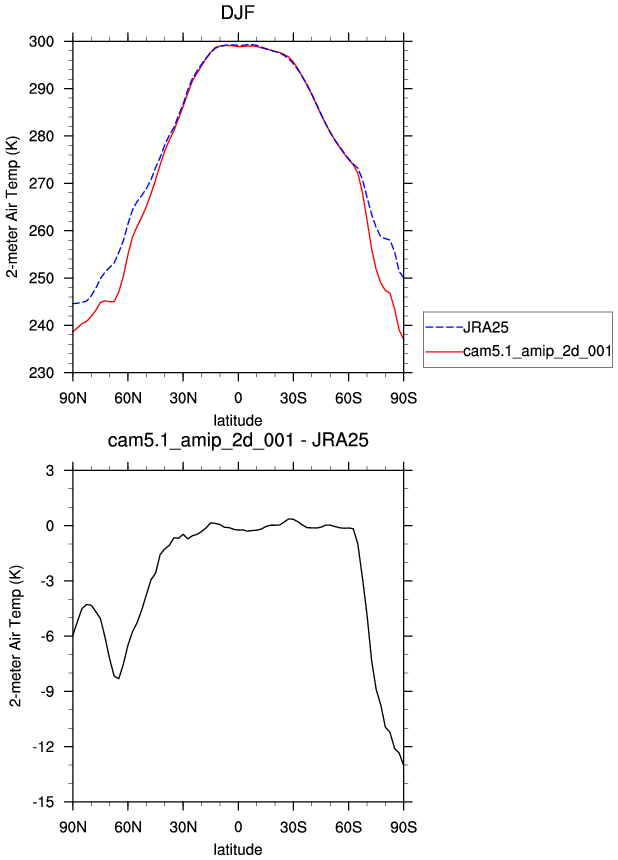
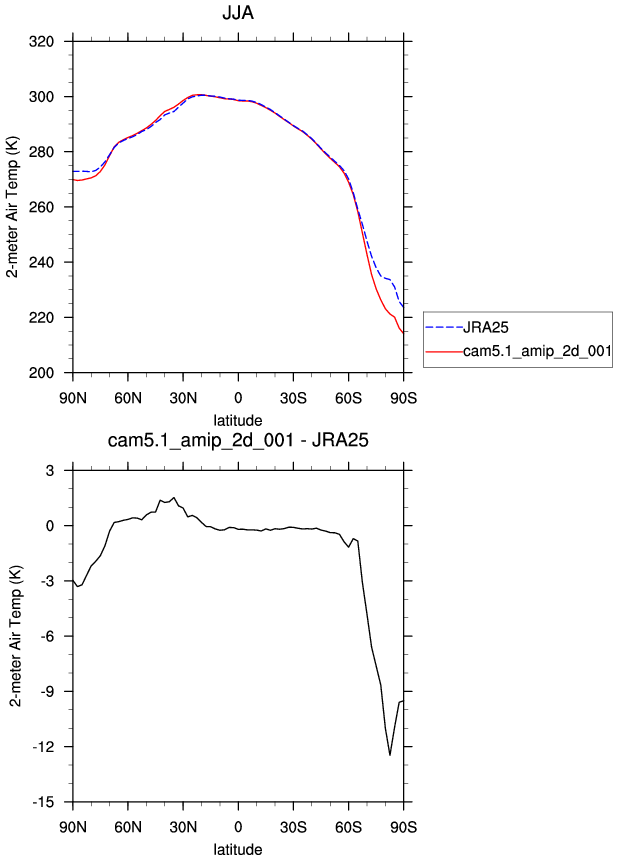
| TREFHT | 2-meter air temperature | plot | plot | plot |
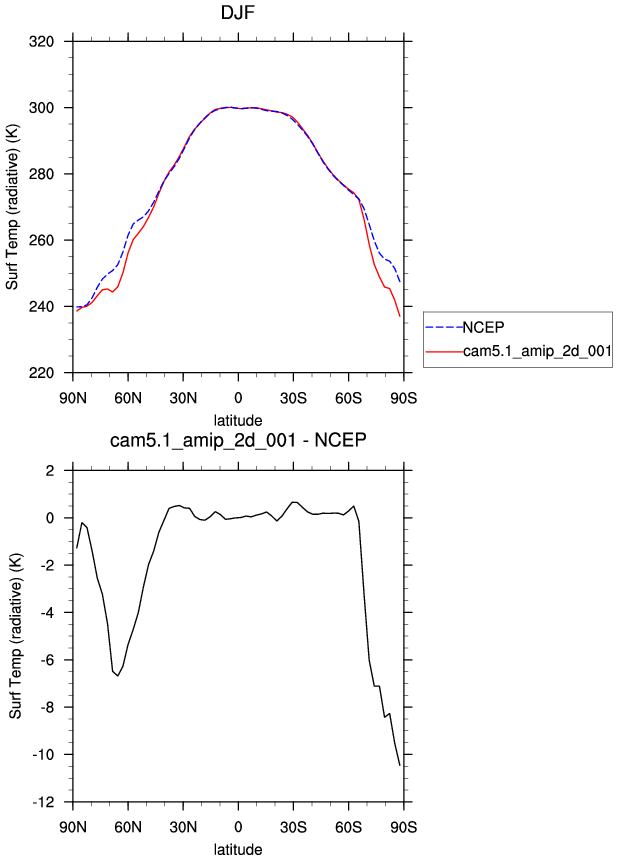
| NCEP Reanalysis 1979-98 | DJF | JJA | ANN | |
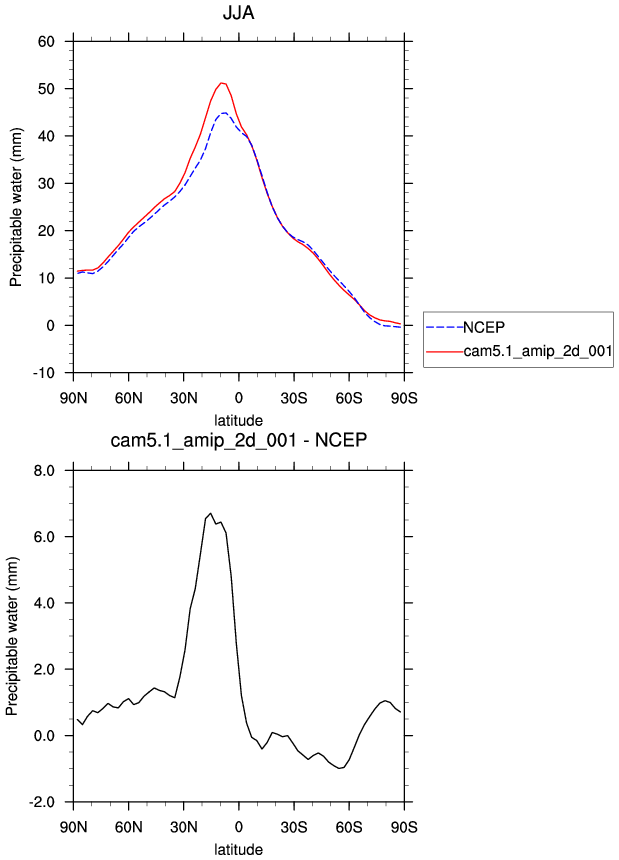
| PREH2O * | Total precipitable water | plot | plot | plot |
| PSL * | Sea level pressure | plot | plot | plot |
| SHFLX | Surface sensible heat flux | plot | plot | plot |
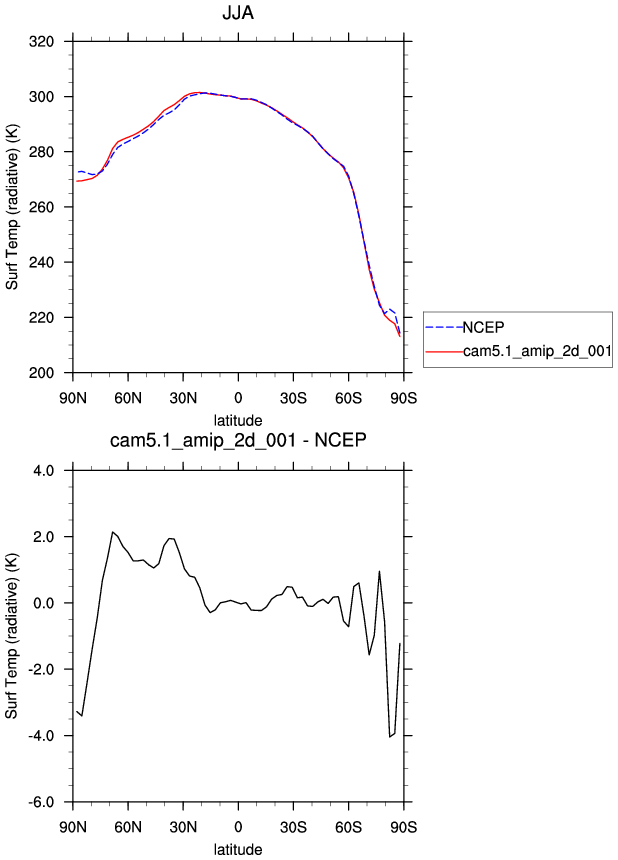
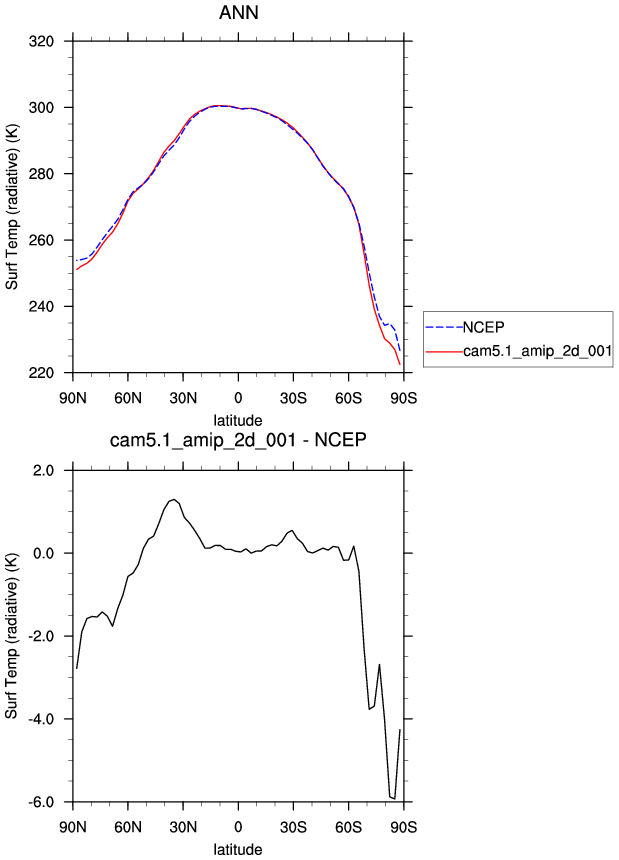
| TS * | Surface temperature | plot | plot | plot |
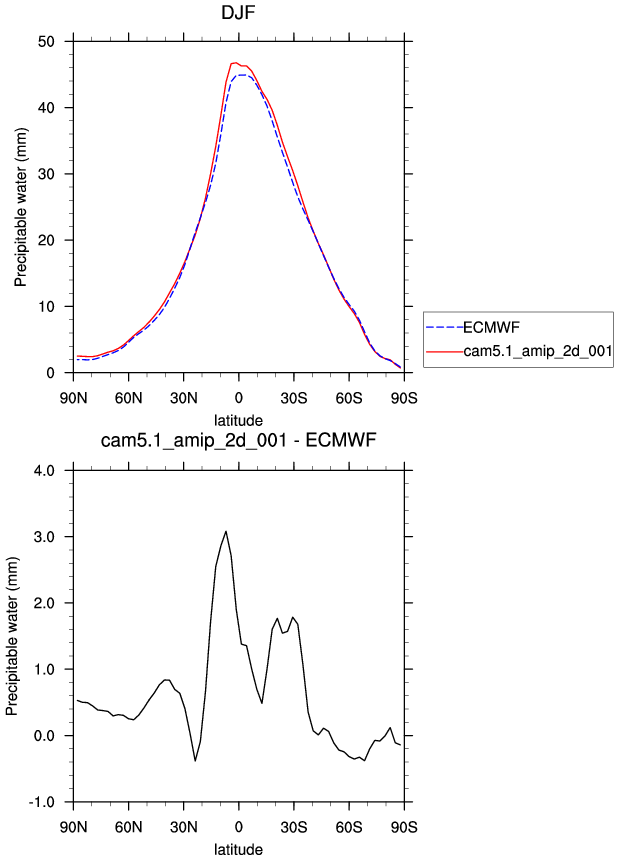
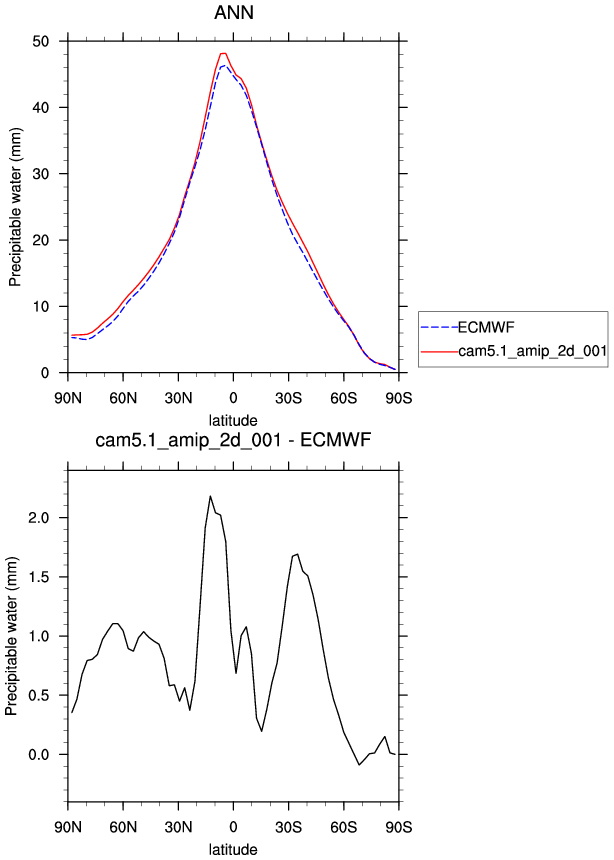
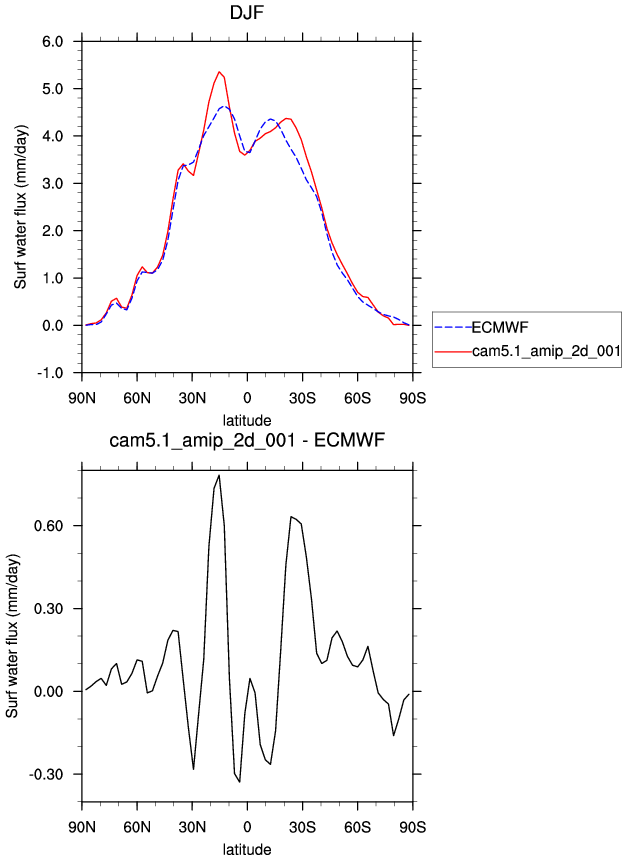
| ECMWF Reanalysis 1979-93 | DJF | JJA | ANN | |
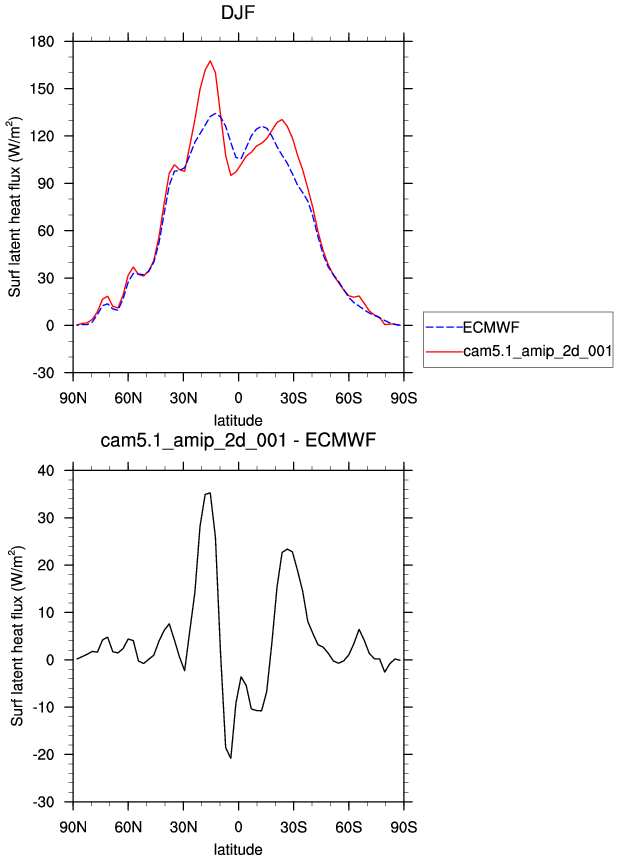
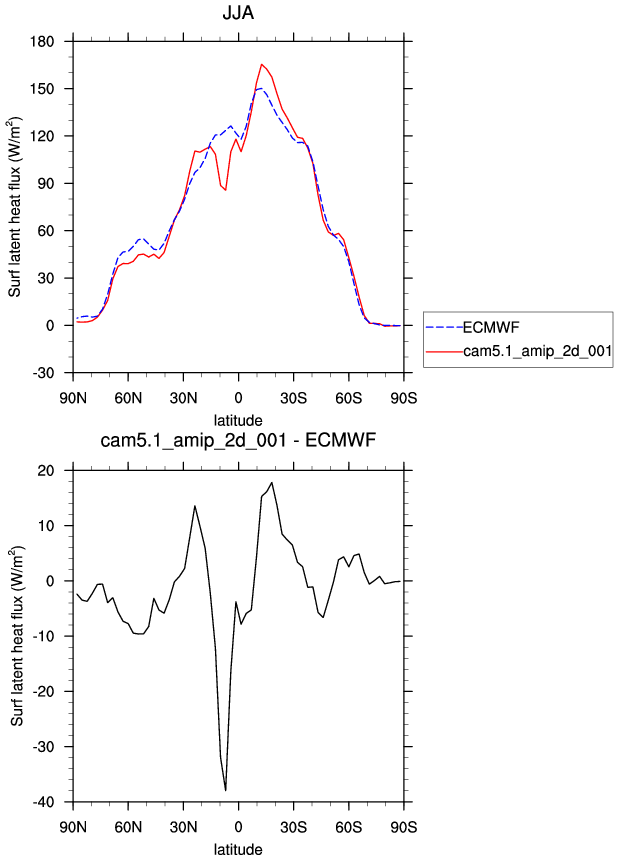
| LHFLX | Surface latent heat flux | plot | plot | plot |
| PREH2O * | Precipitable water | plot | plot | plot |
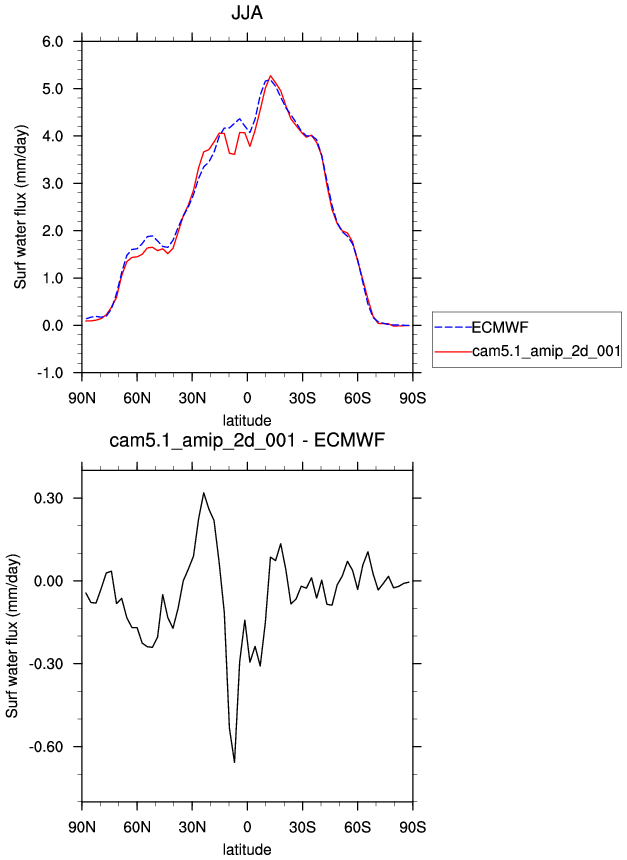
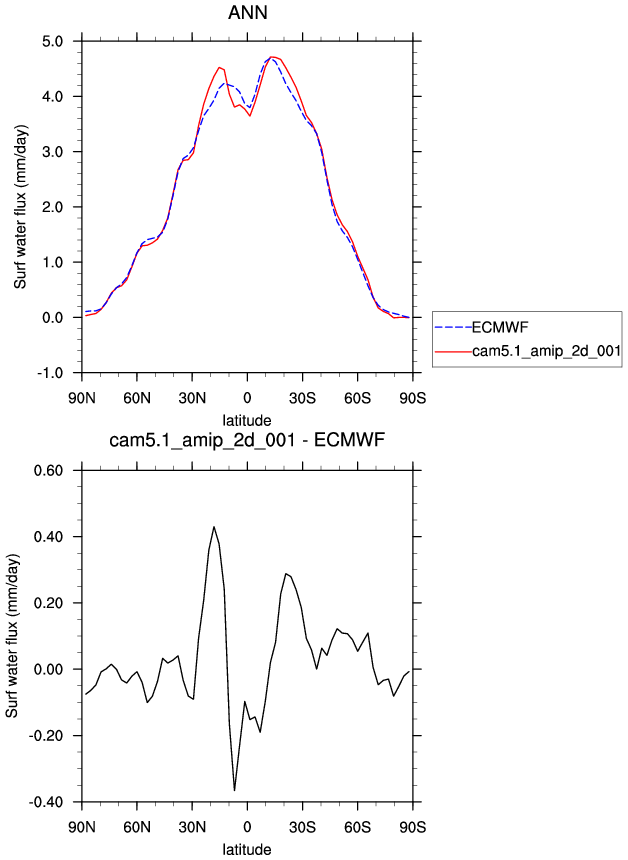
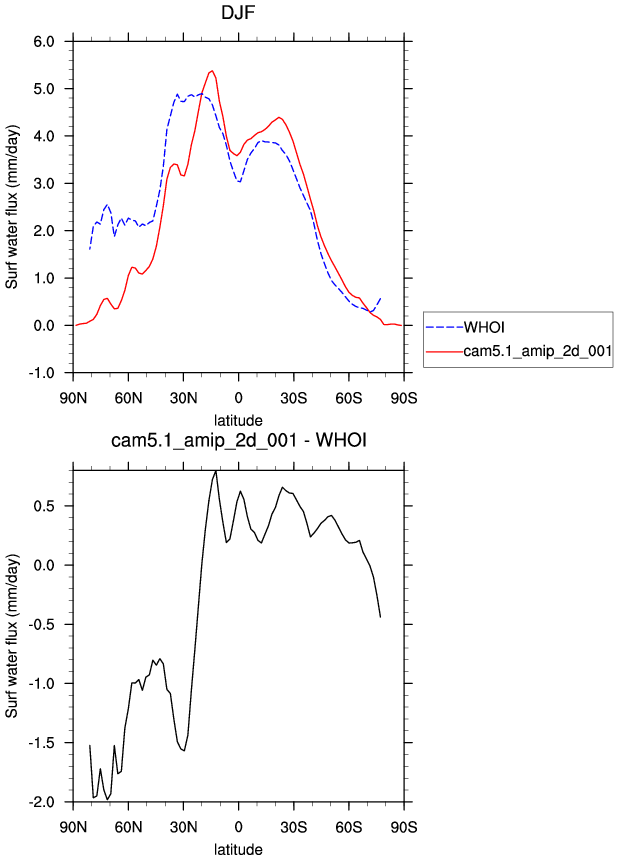
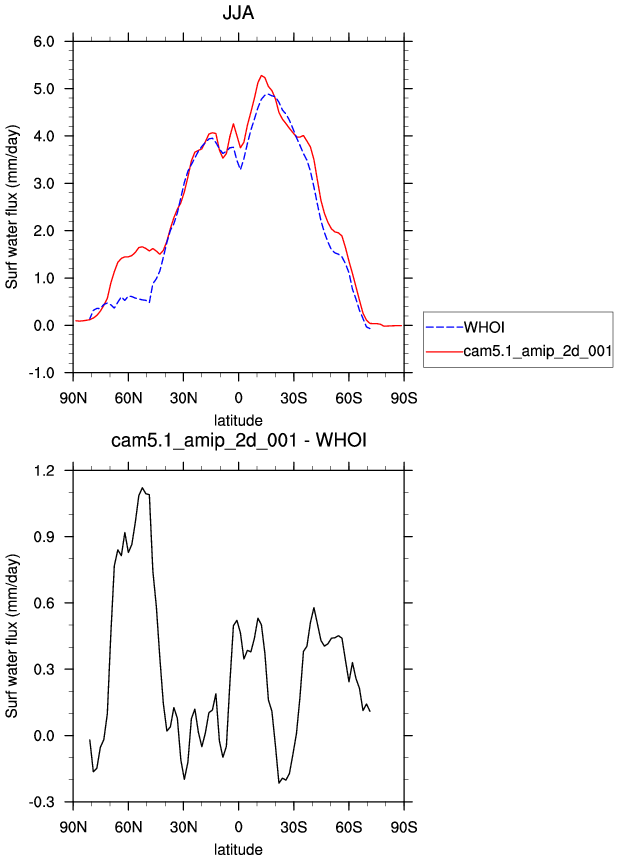
| QFLX | Surface water flux | plot | plot | plot |
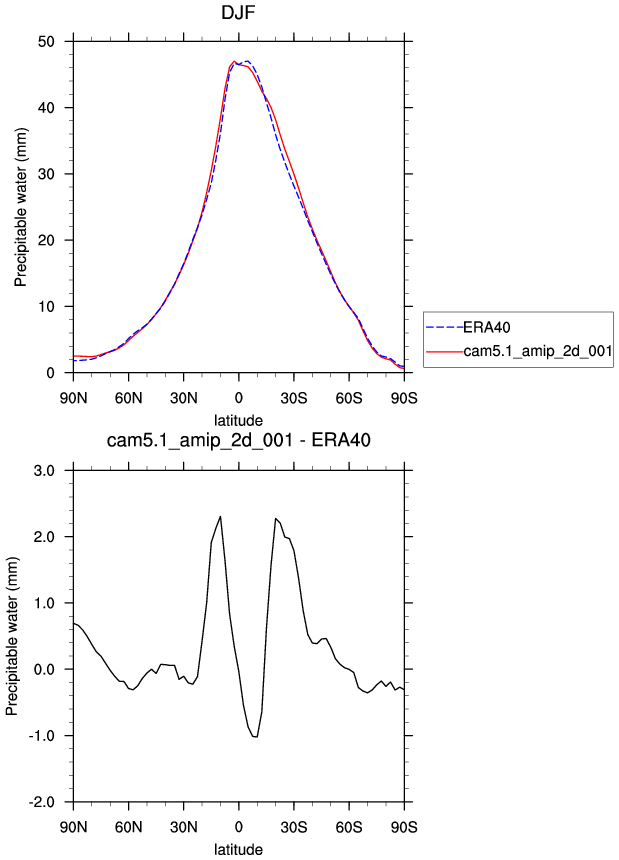
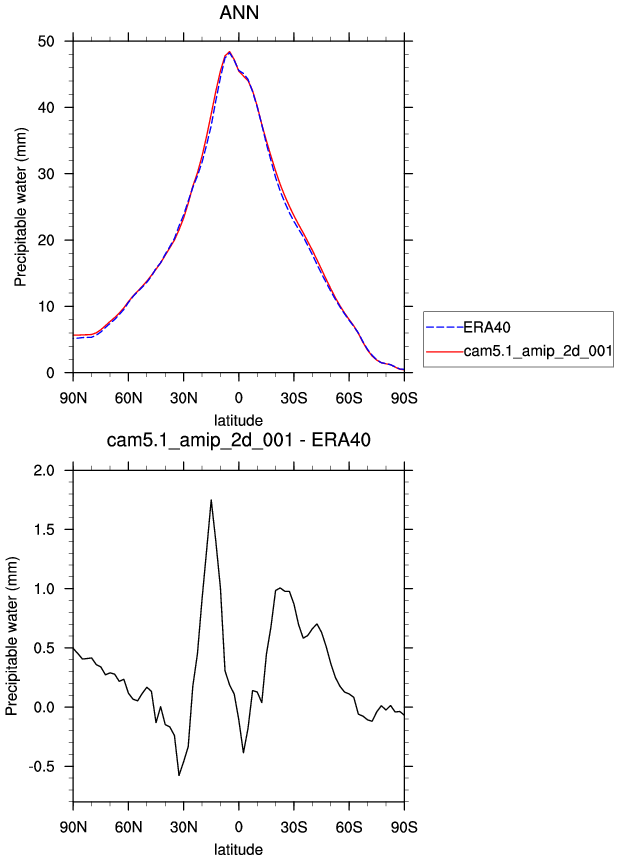
| ERA40 Reanalysis 1980-2001 | DJF | JJA | ANN | |
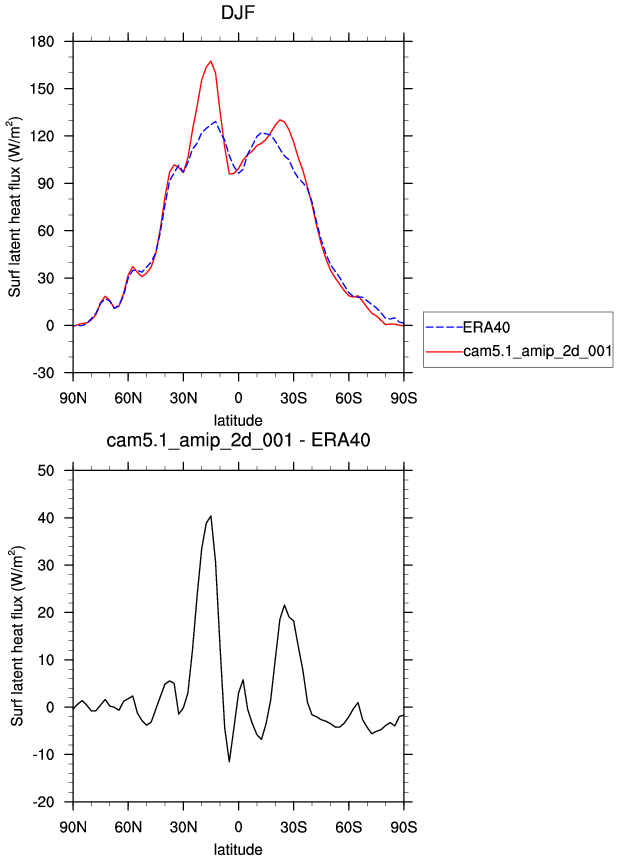
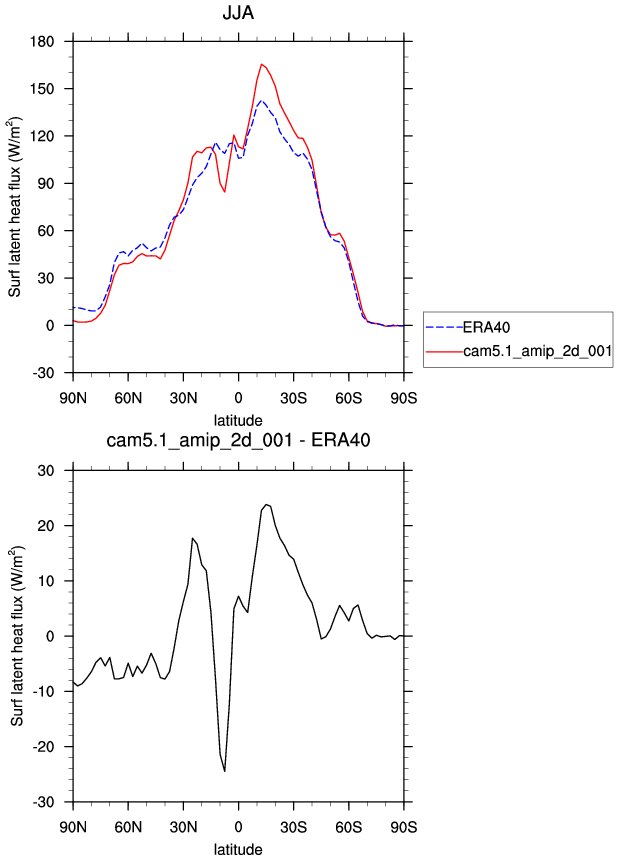
| LHFLX | Surface latent heat flux | plot | plot | plot |
| PREH2O * | Precipitable water | plot | plot | plot |
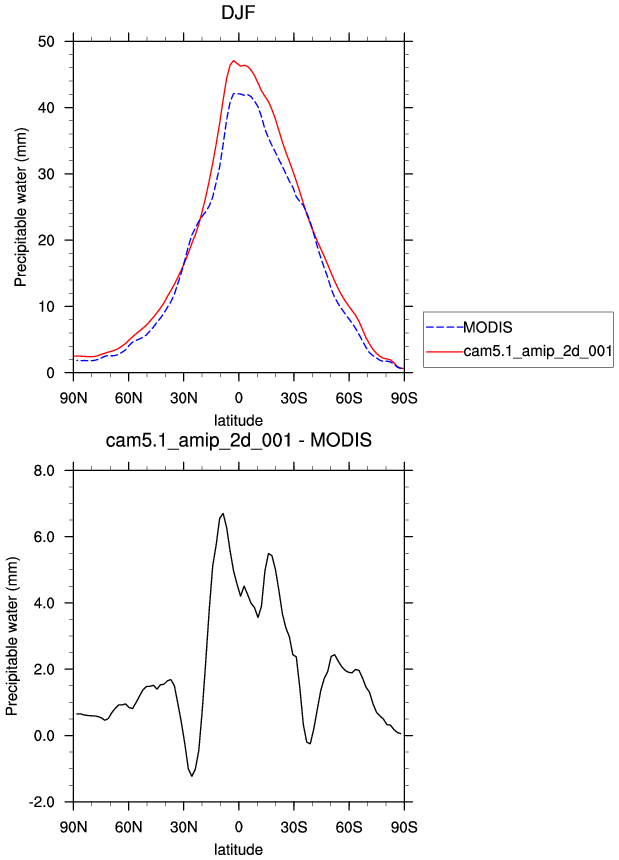
| MODIS 2000-2004 | DJF | JJA | ANN | |
| PREH2O * | Total precipitable water | plot | plot | plot |
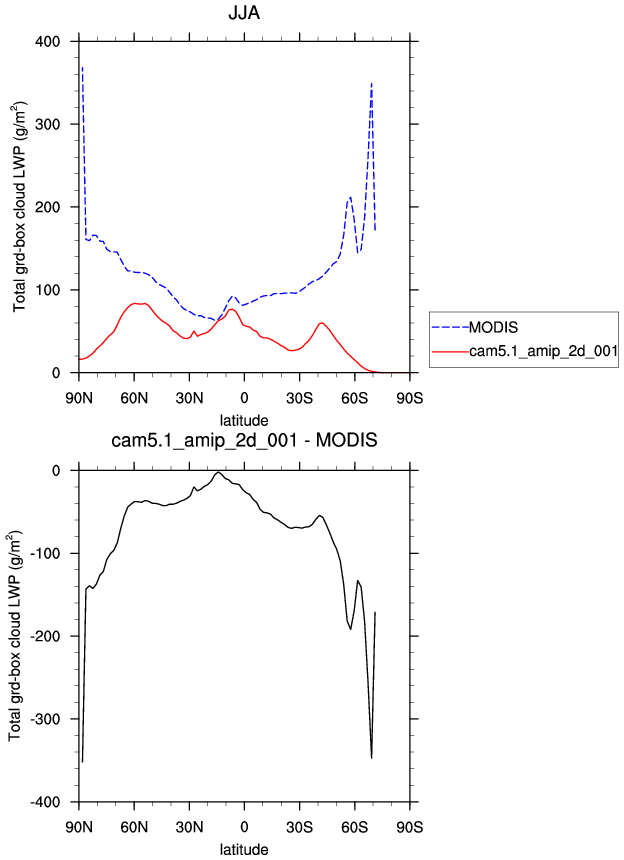
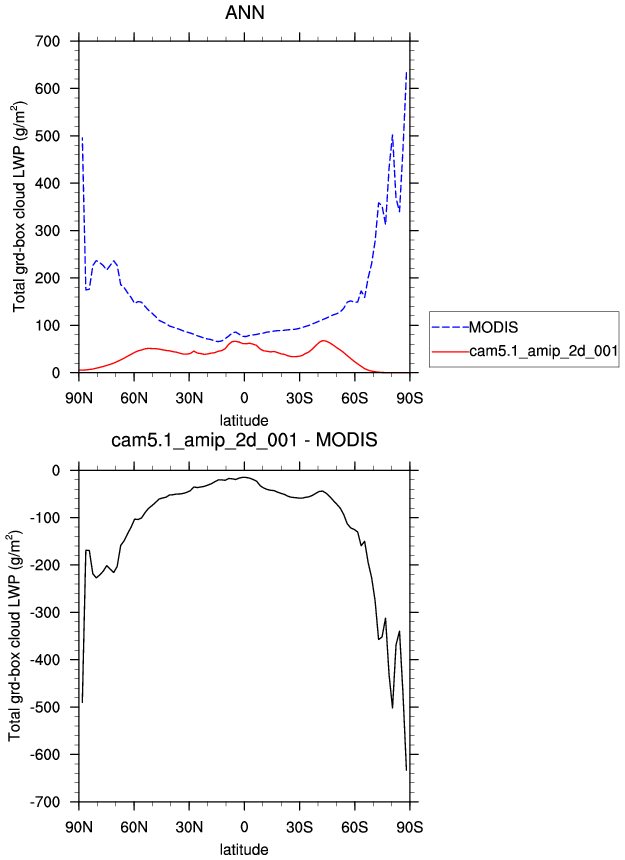
| TGCLDLWP | Cloud liquid water | plot | plot | plot |
| NVAP 1988-1999 | DJF | JJA | ANN | |
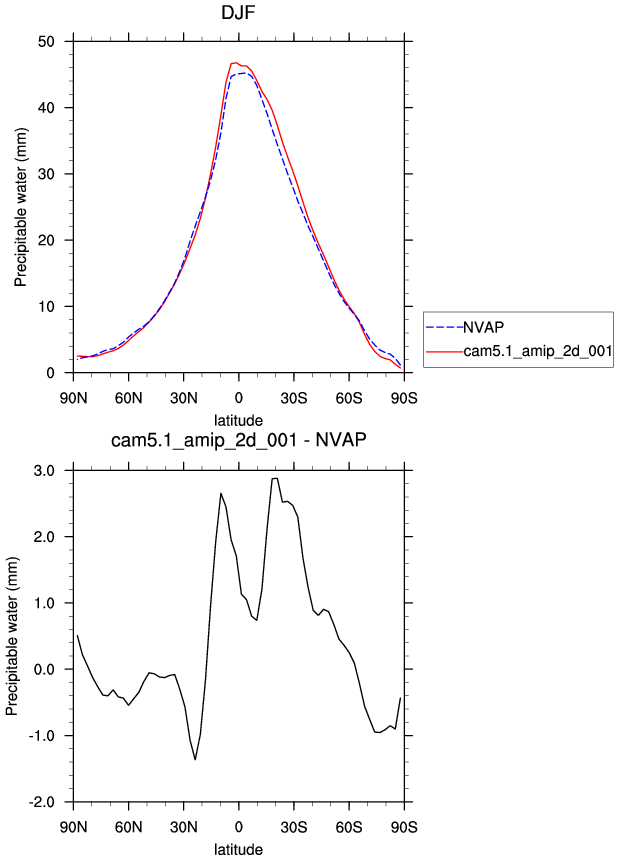
| PREH2O * | Total precipitable water | plot | plot | plot |
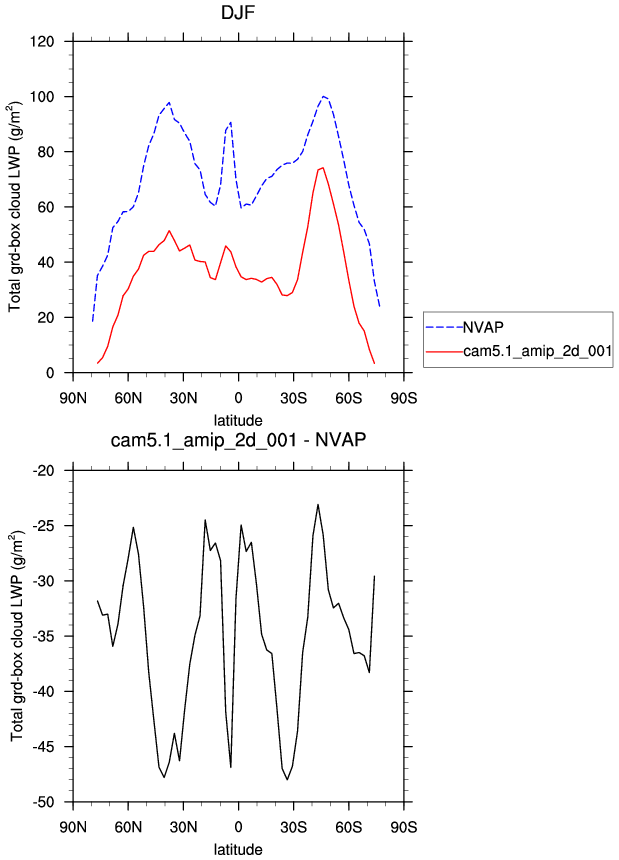
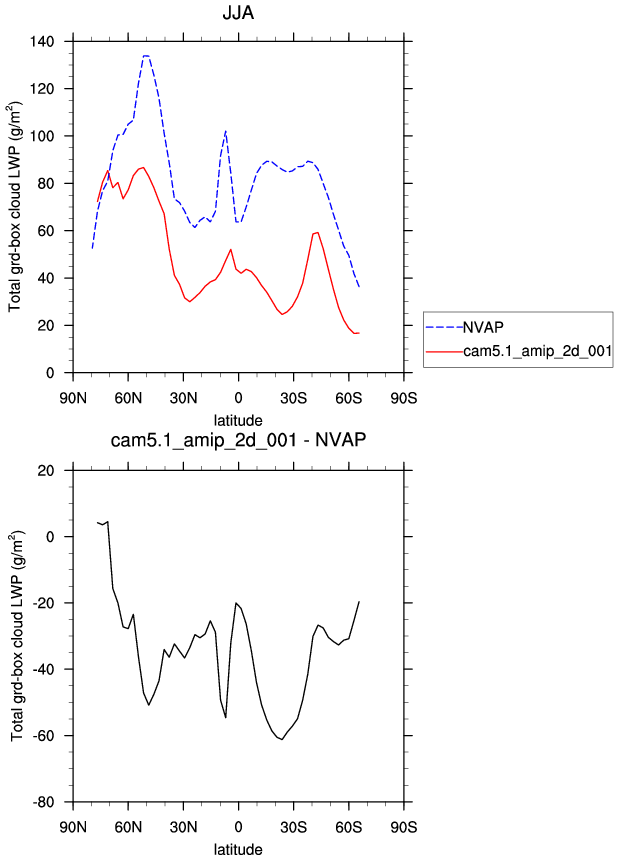
| TGCLDLWP | Cloud liquid water (ocean) | plot | plot | plot |
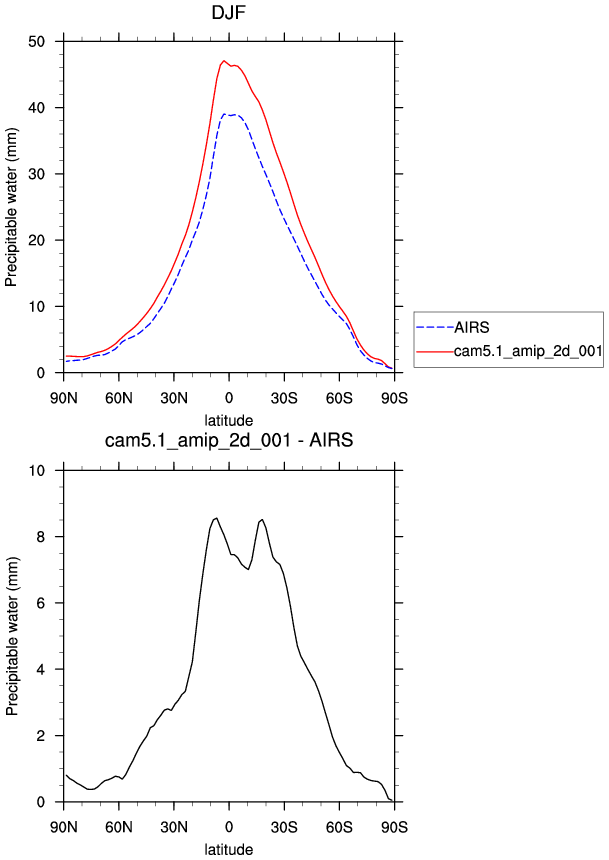
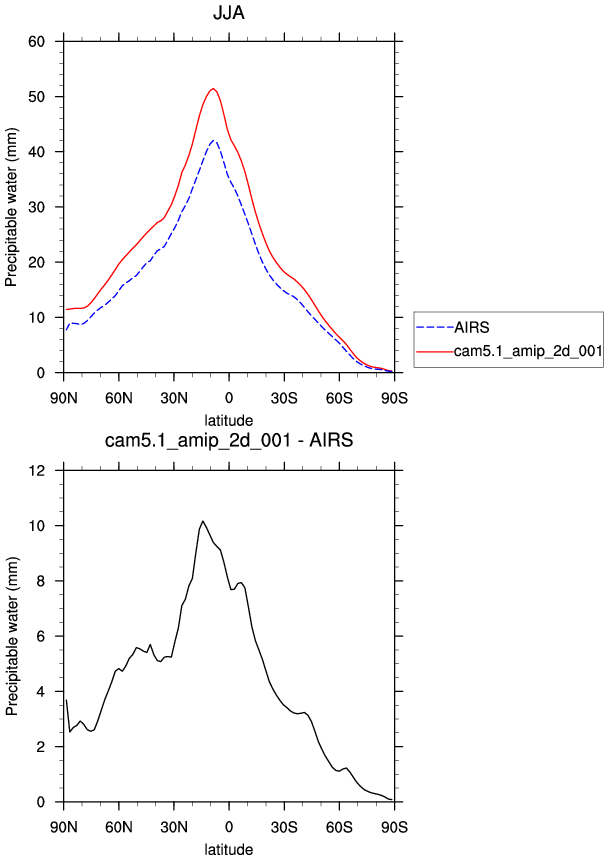
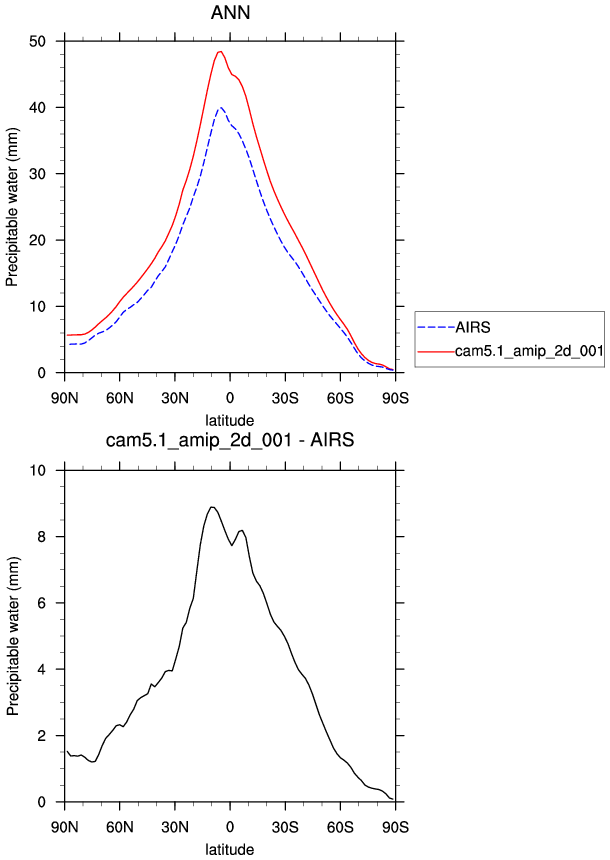
| AIRS IR Sounder 2002-06 | DJF | JJA | ANN | |
| PREH2O * | Total precipitable water | plot | plot | plot |
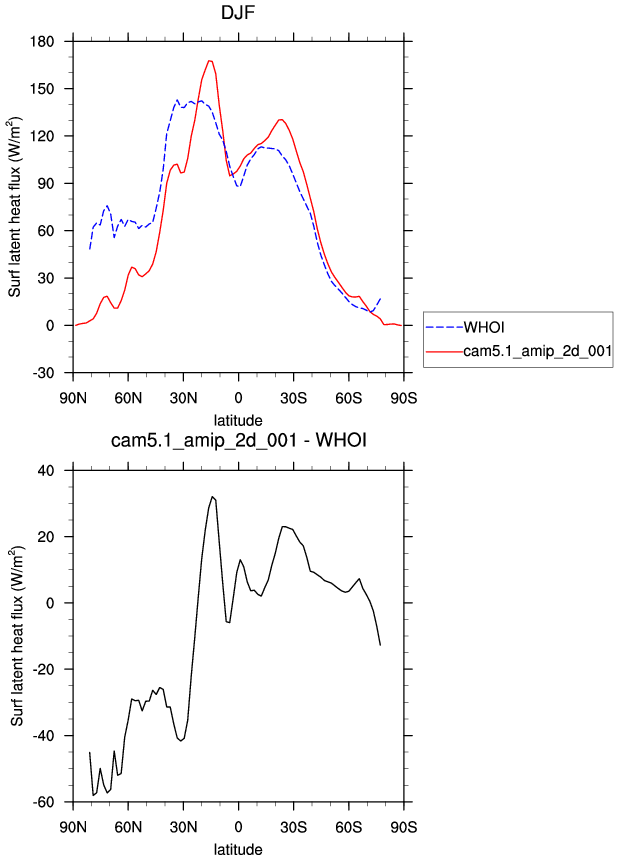
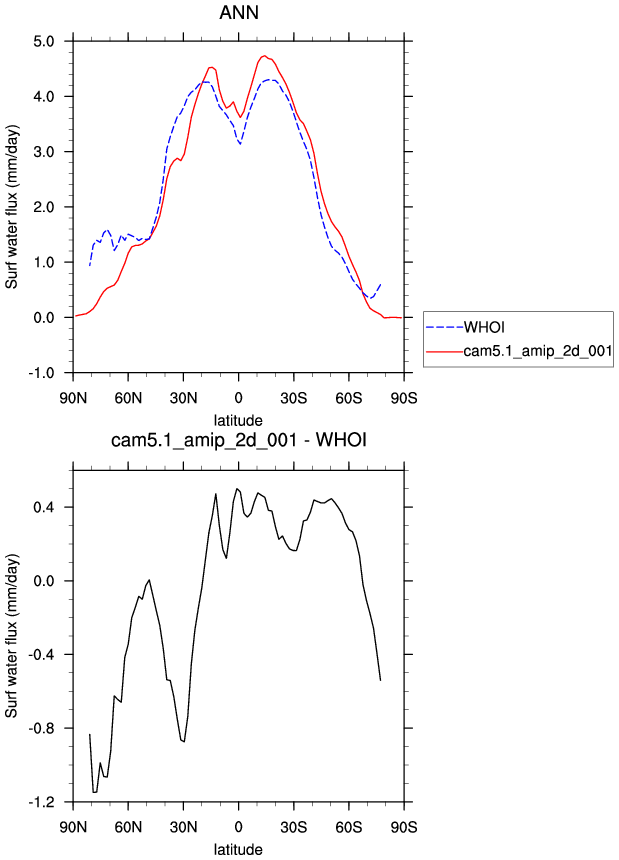
| Woods Hole OAFLUX 1958-2006 | DJF | JJA | ANN | |
| LHFLX | Latent Heat Flux | plot | plot | plot |
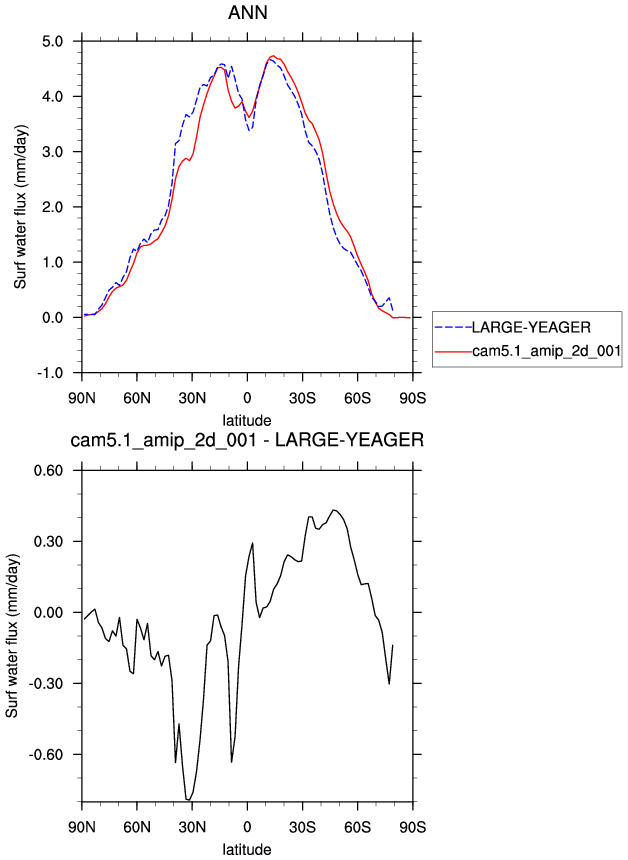
| QFLX | Surface Water Flux | plot | plot | plot |
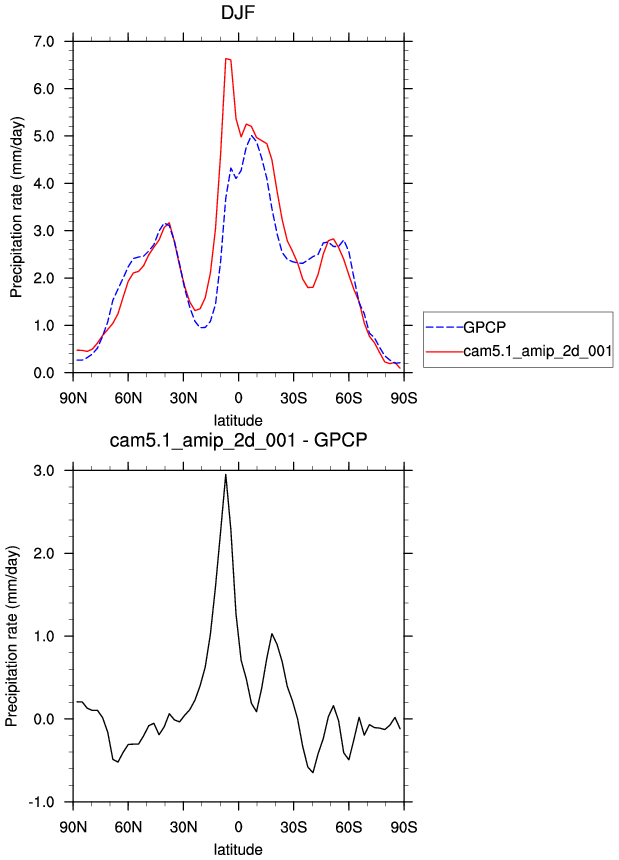
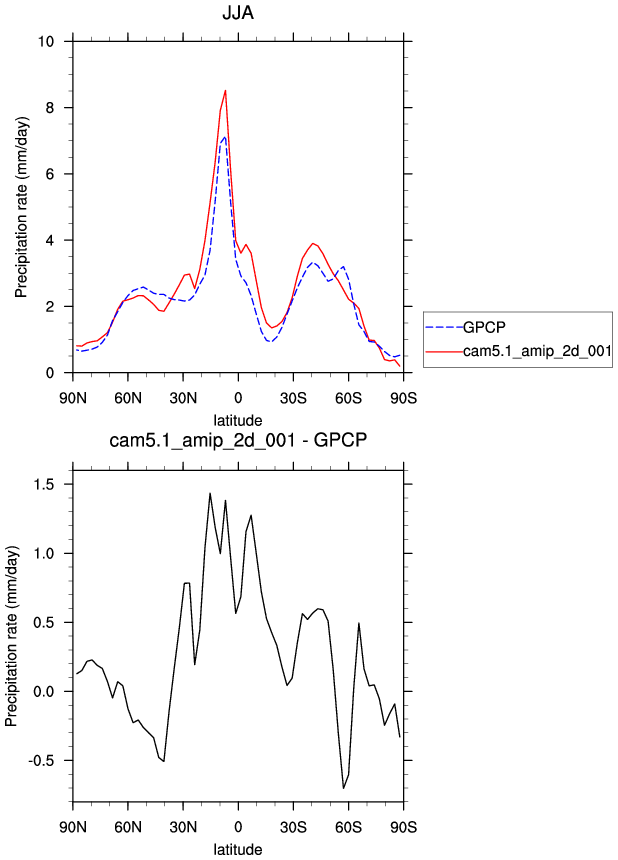
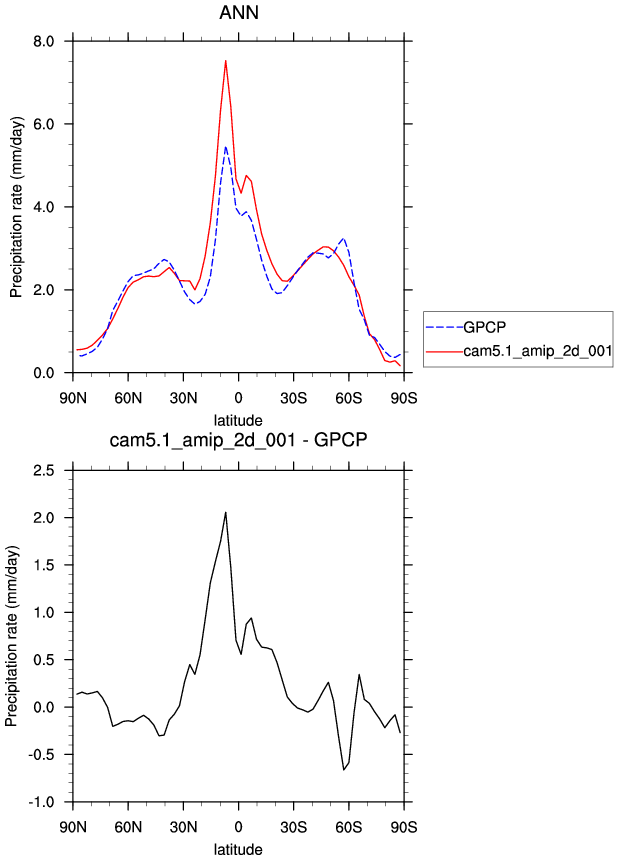
| GPCP 1979-2009 | DJF | JJA | ANN | |
| PRECT * | Precipitation rate | plot | plot | plot |
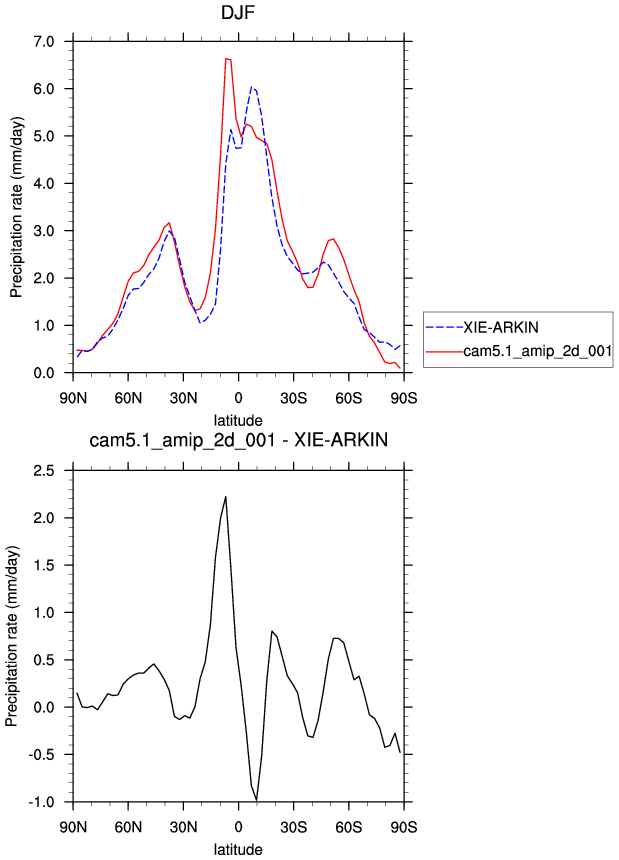
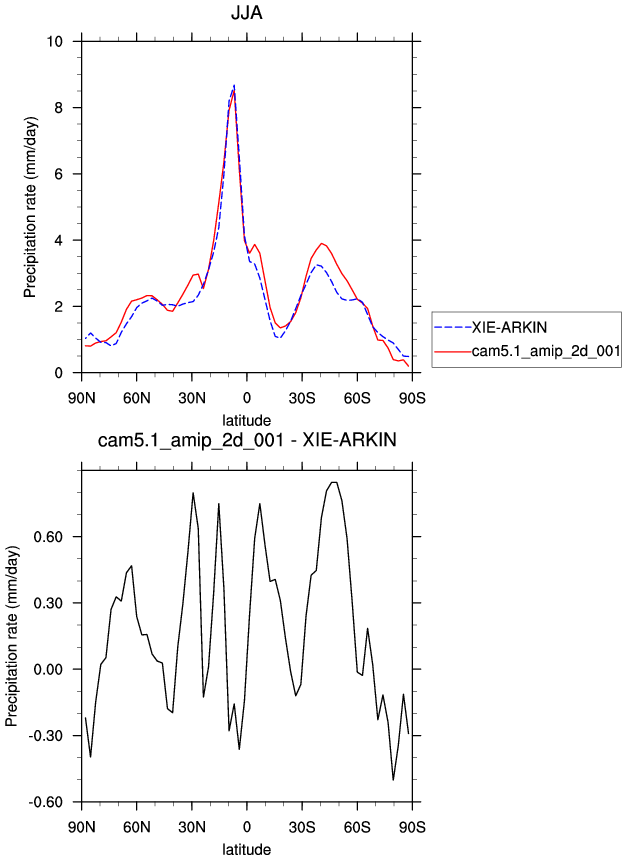
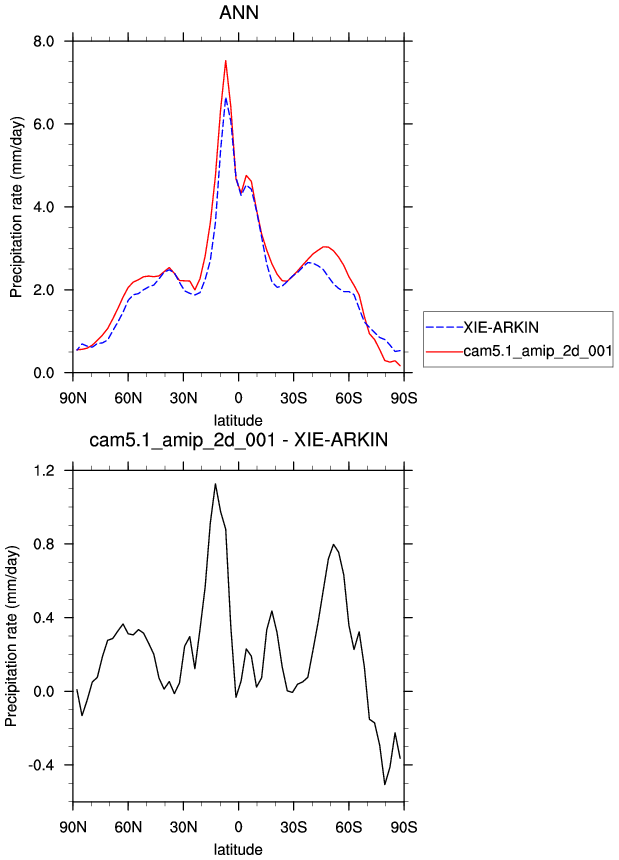
| CMAP (Xie-Arkin) 1979-98 | DJF | JJA | ANN | |
| PRECT * | Precipitation rate | plot | plot | plot |
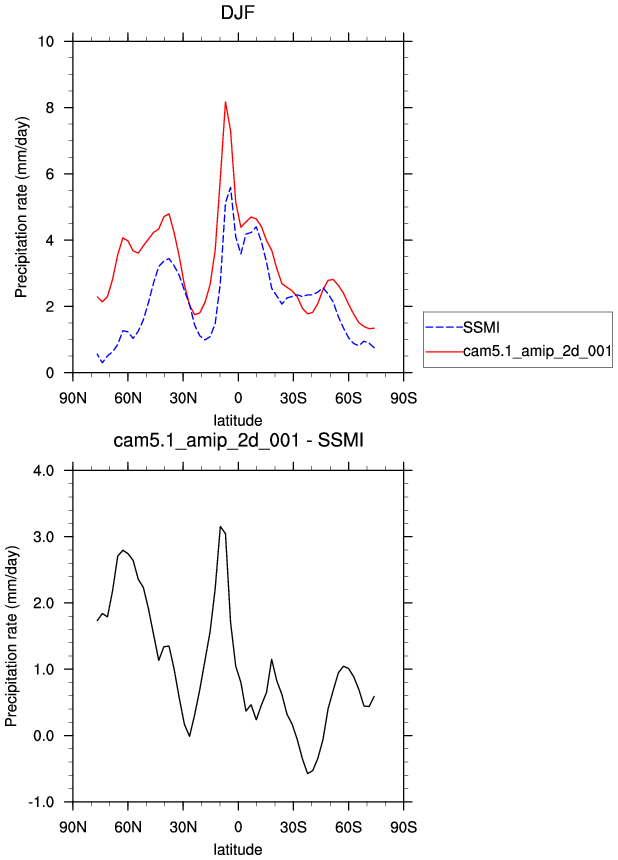
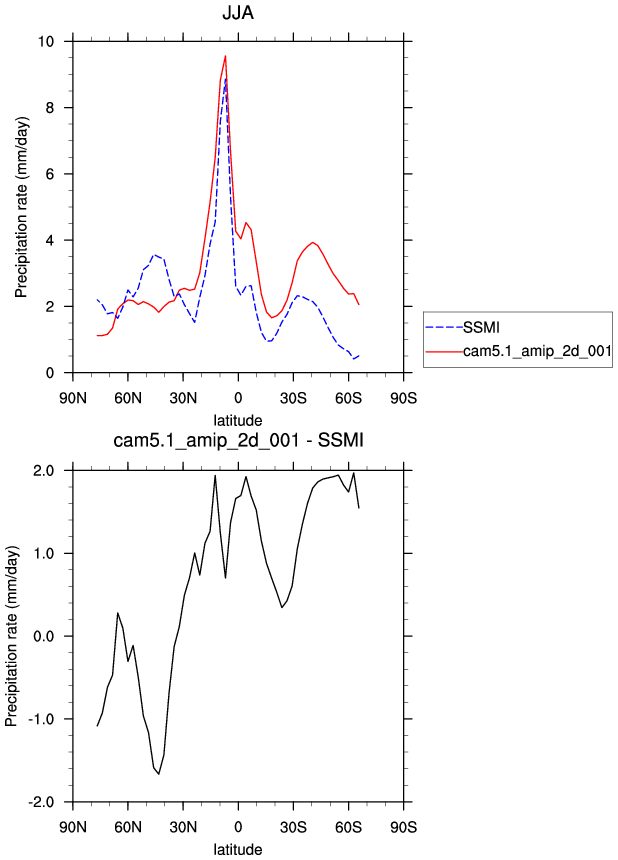
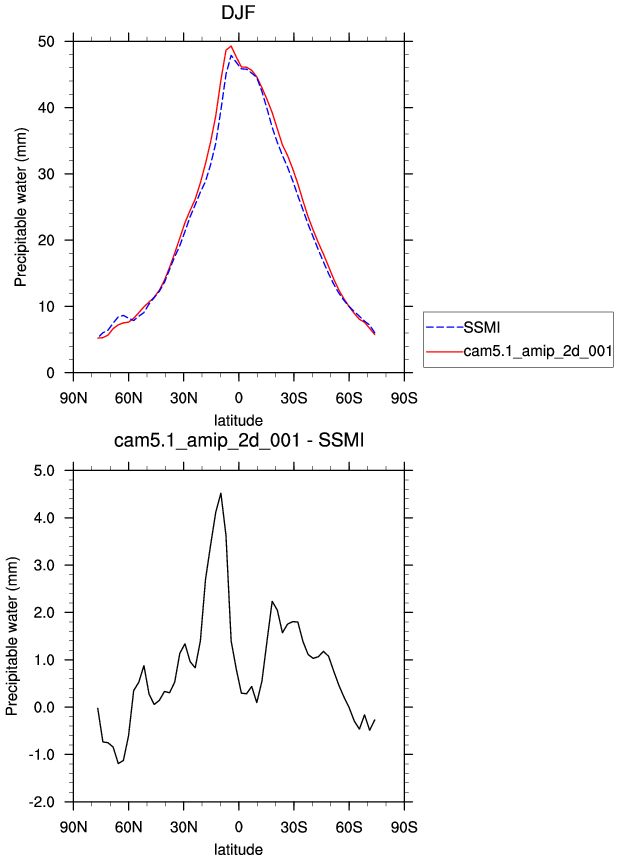
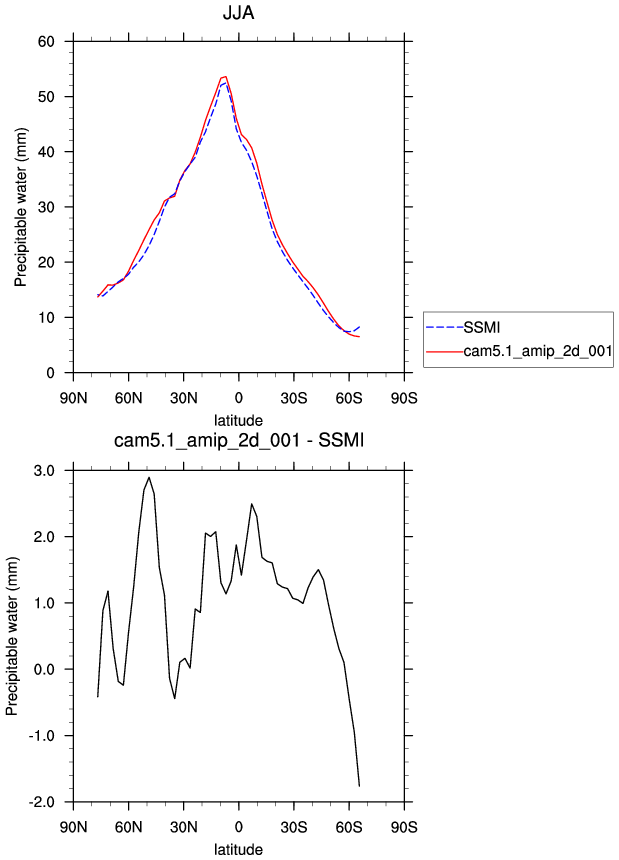
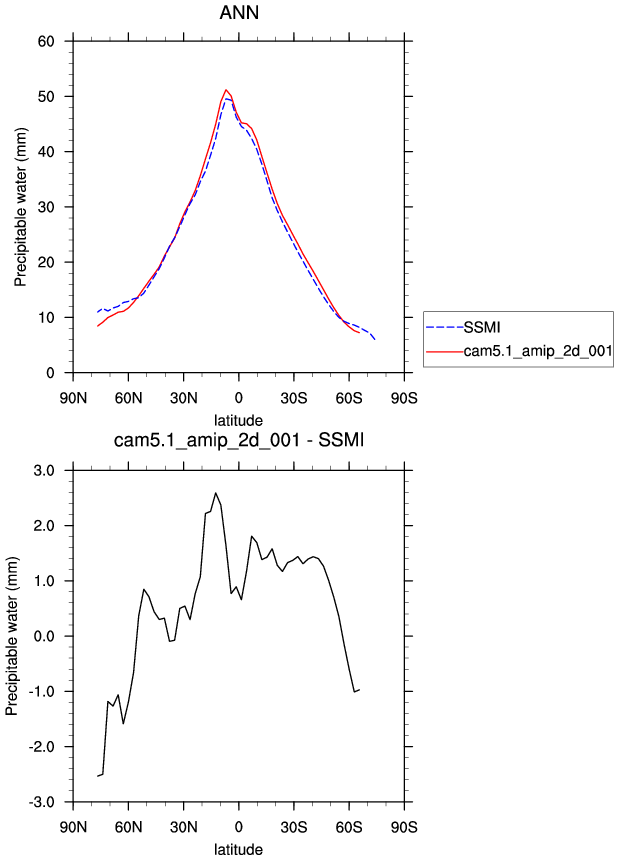
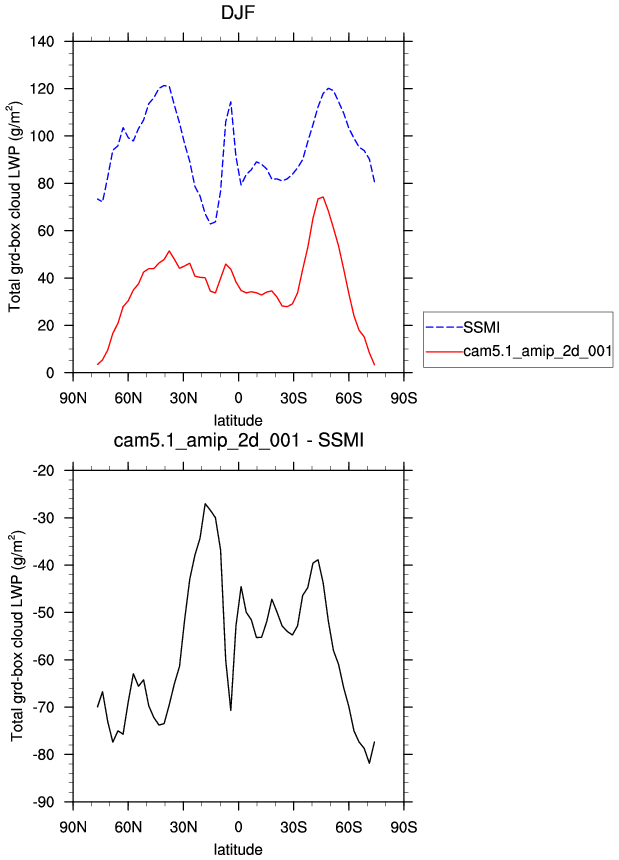
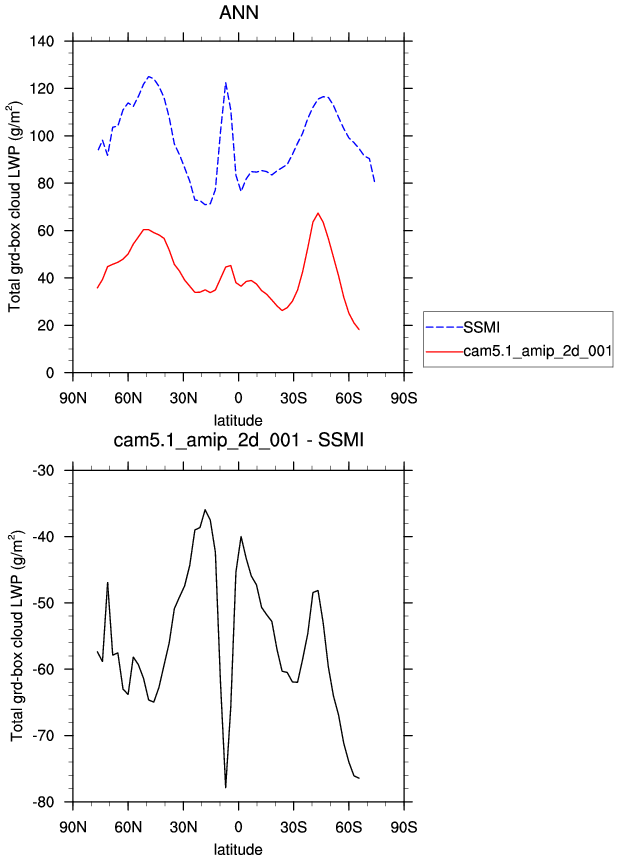
| SSM/I (Wentz) 1987-2000 | DJF | JJA | ANN | |
| PRECT * | Precipitation rate (ocean) | plot | plot | plot |
| PREH2O * | Total precipitable water (ocean) | plot | plot | plot |
| TGCLDLWP | Cloud liquid water (ocean) | plot | plot | plot |
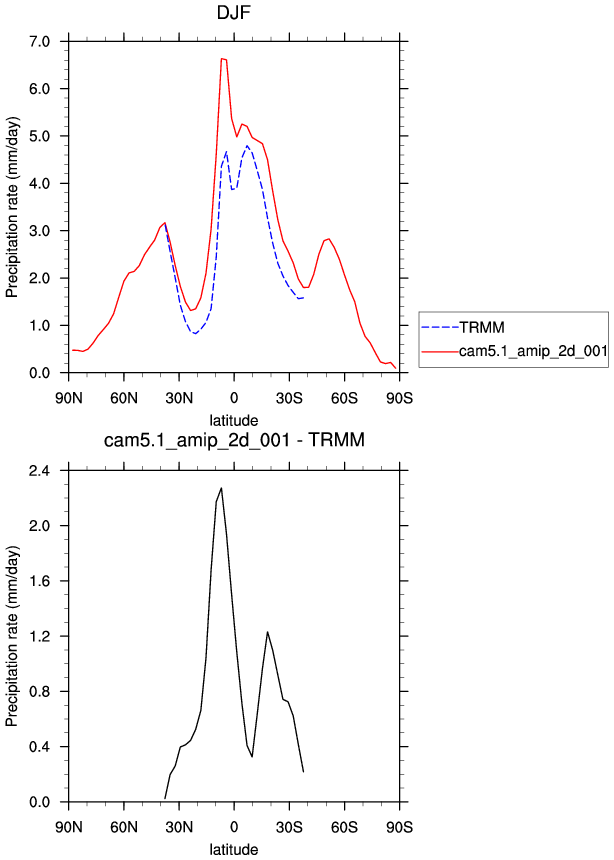
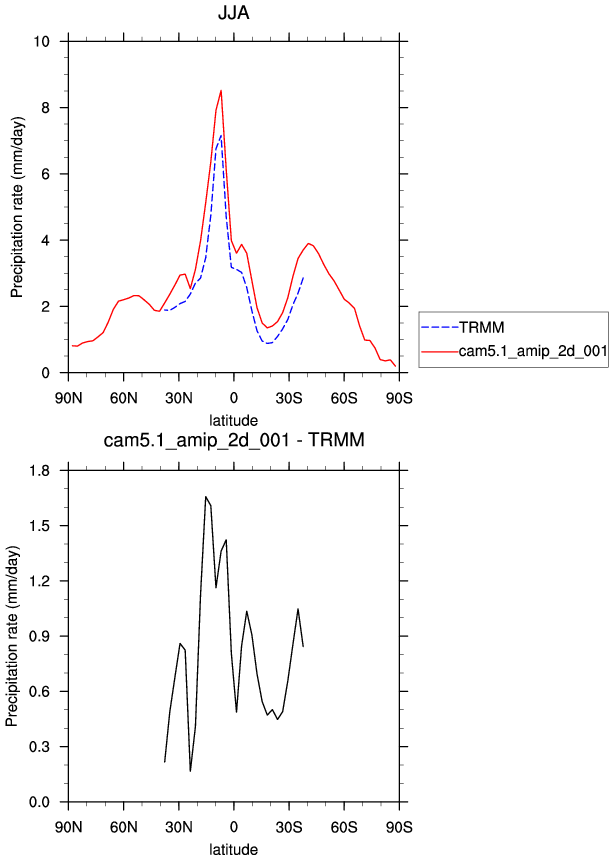
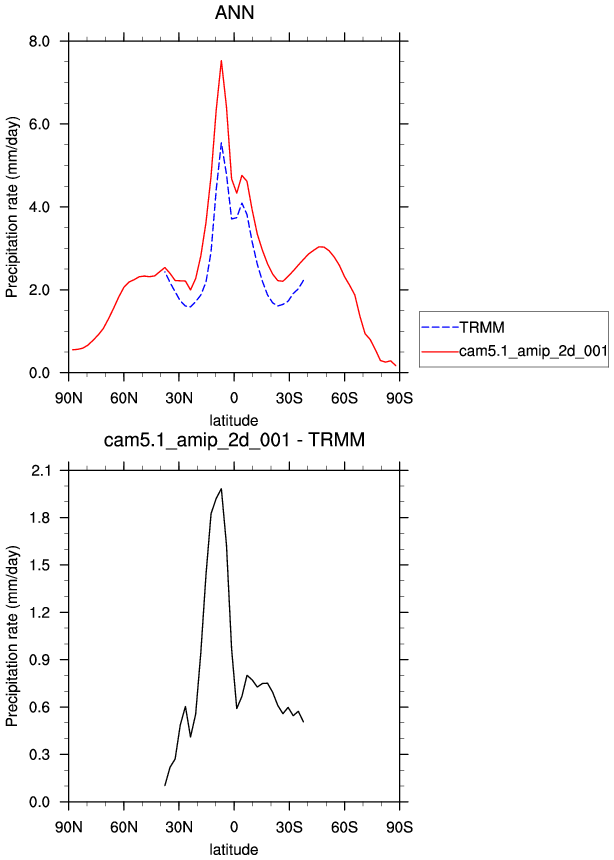
| TRMM (3B43) 1998-2009 | DJF | JJA | ANN | |
| PRECT * | Precipitation rate | plot | plot | plot |
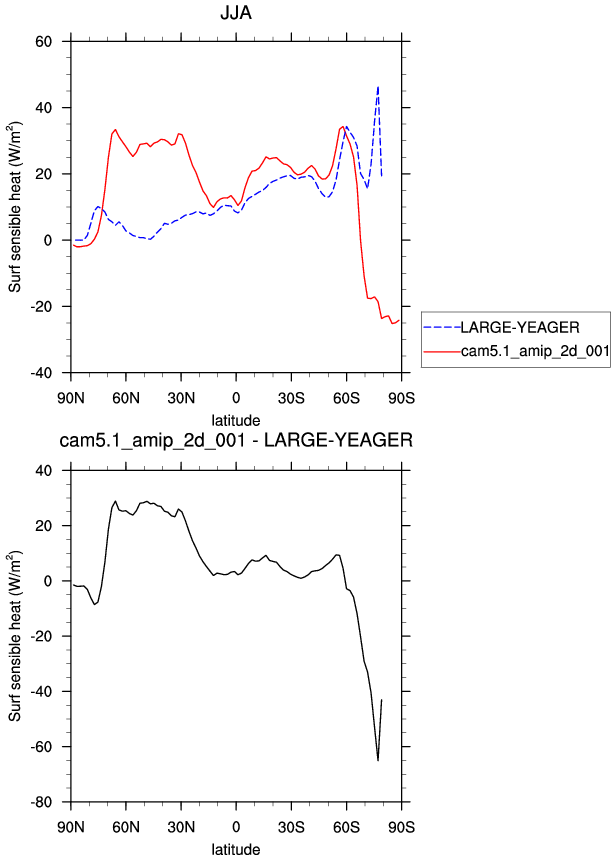
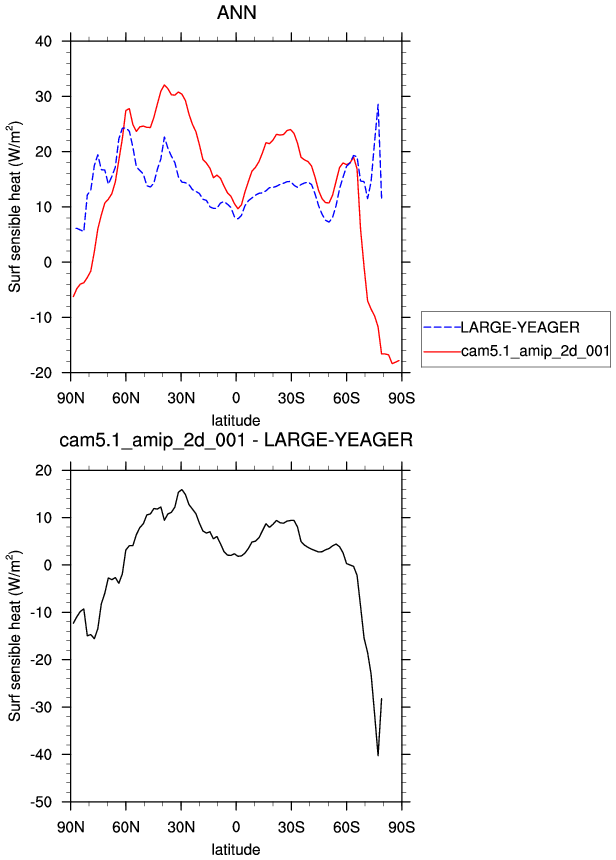
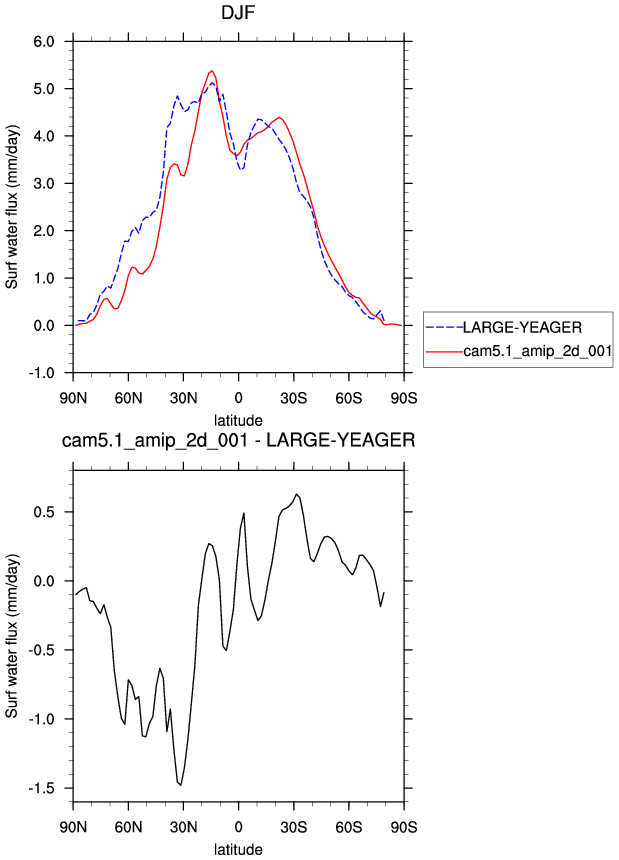
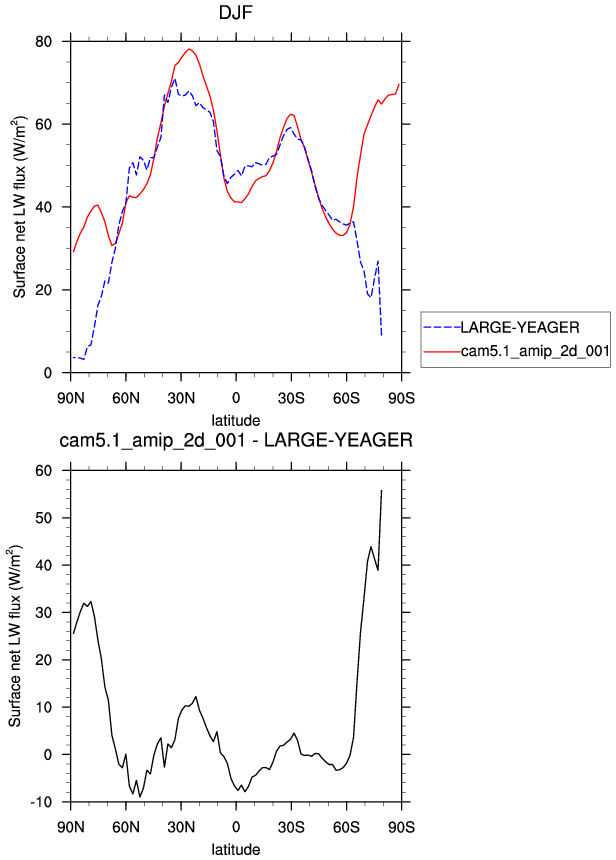
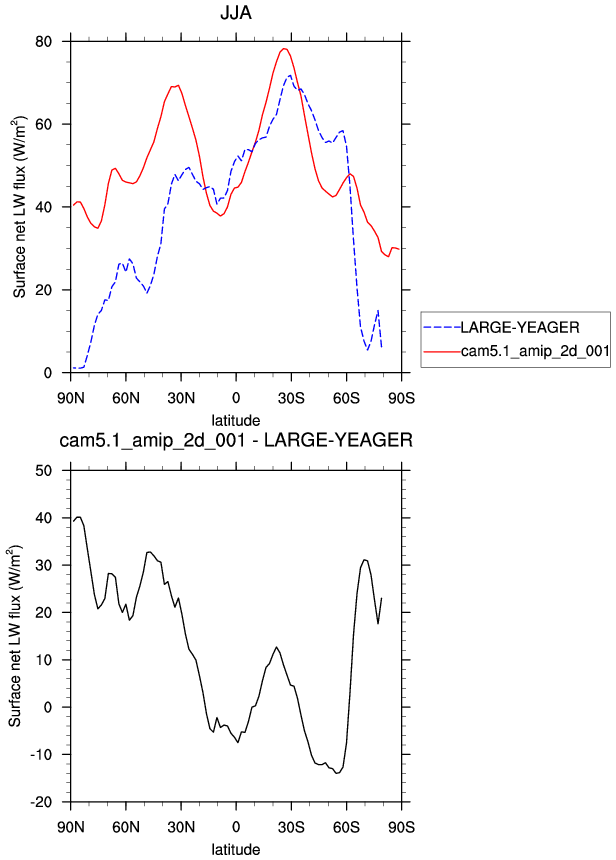
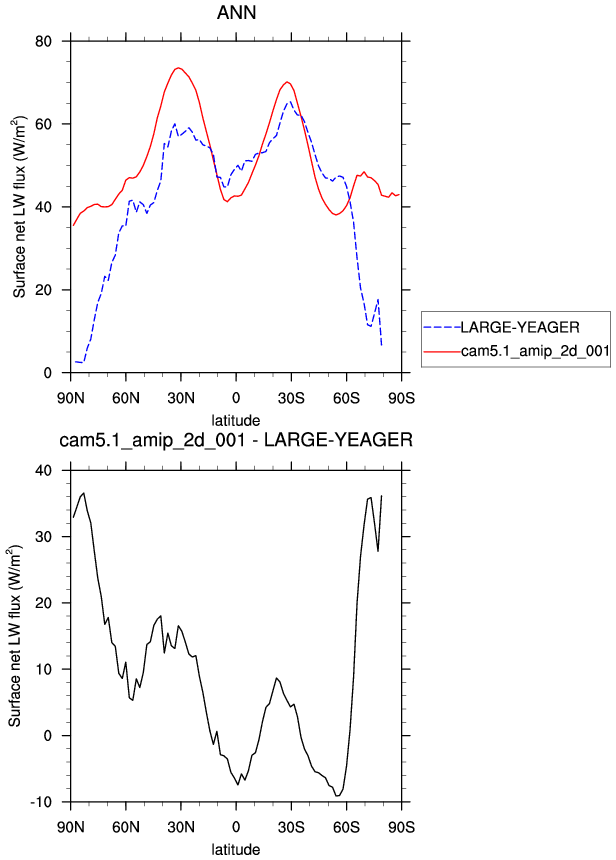
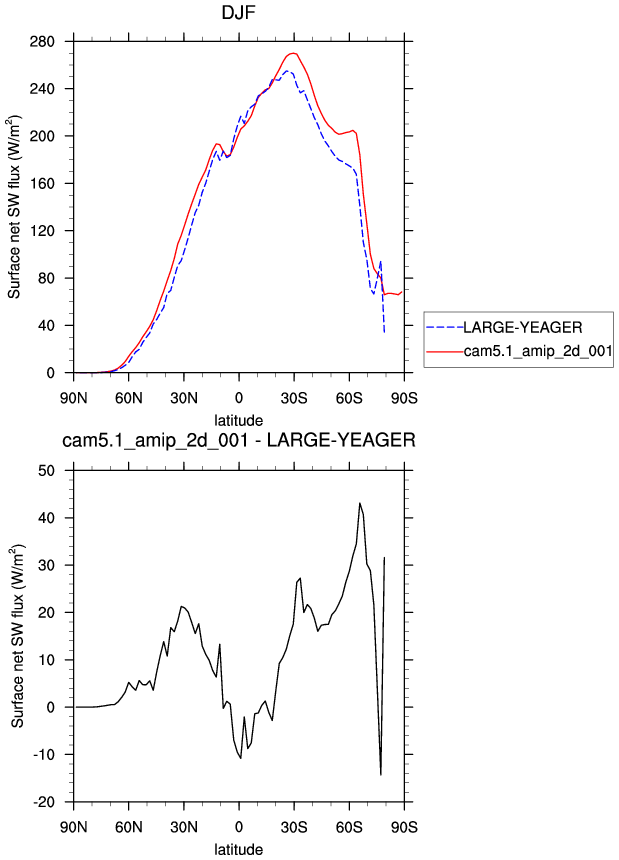
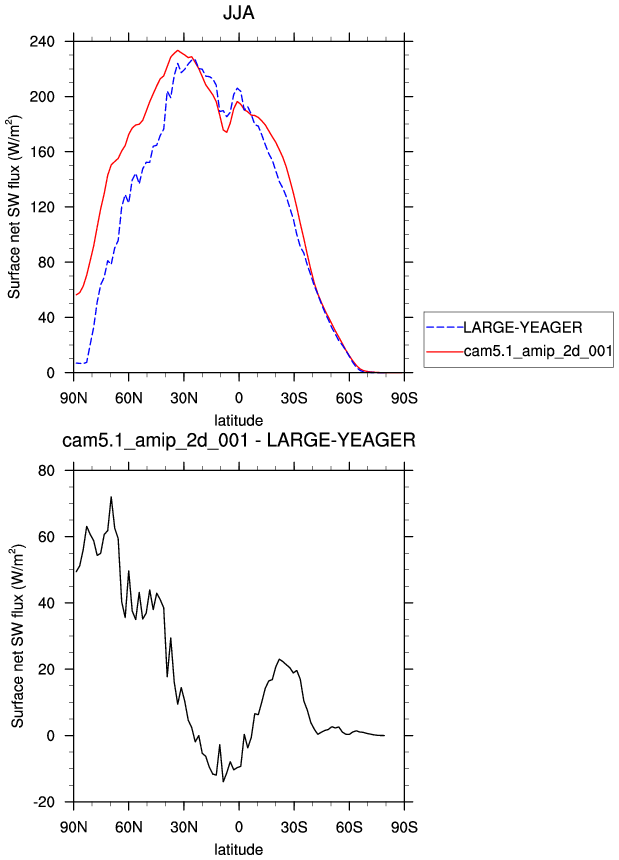
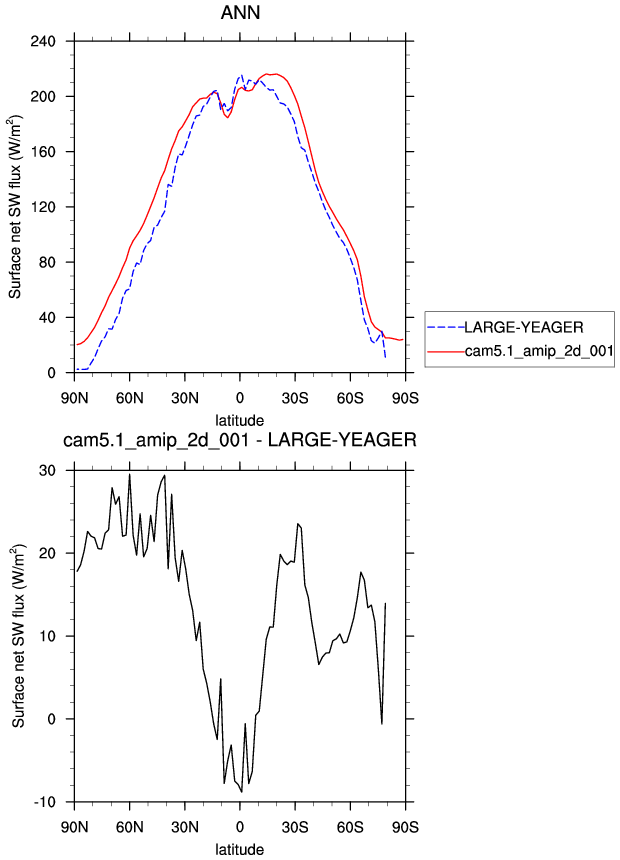
| Large-Yeager 1984-2004 | DJF | JJA | ANN | |
| SHFLX | Surface sensible heat flux | plot | plot | plot |
| QFLX | Surface water flux | plot | plot | plot |
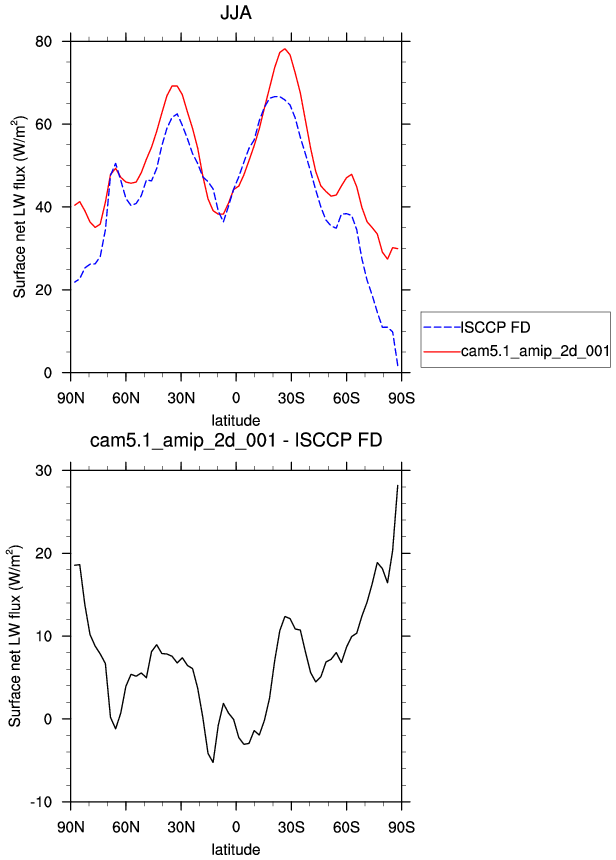
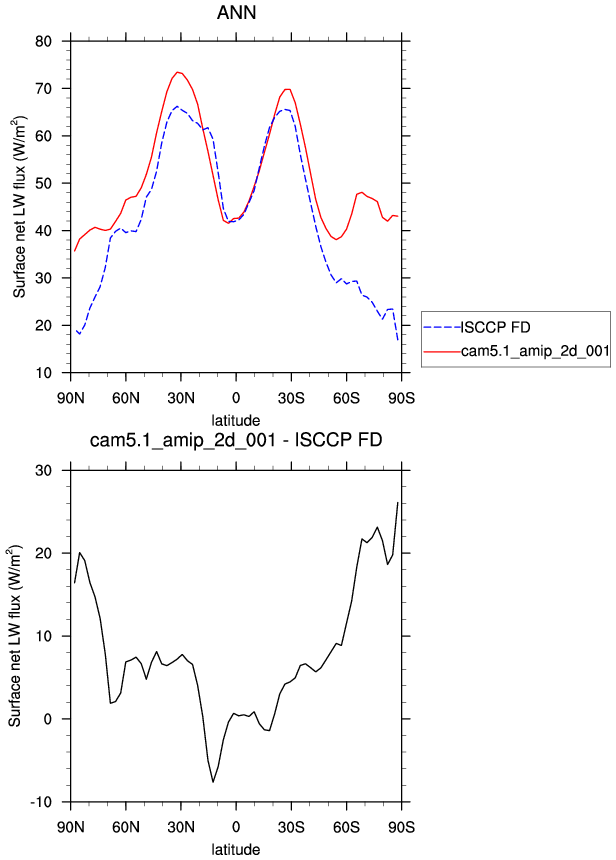
| FLNS | Surf Net LW flux | plot | plot | plot |
| FSNS | Surf Net SW flux | plot | plot | plot |
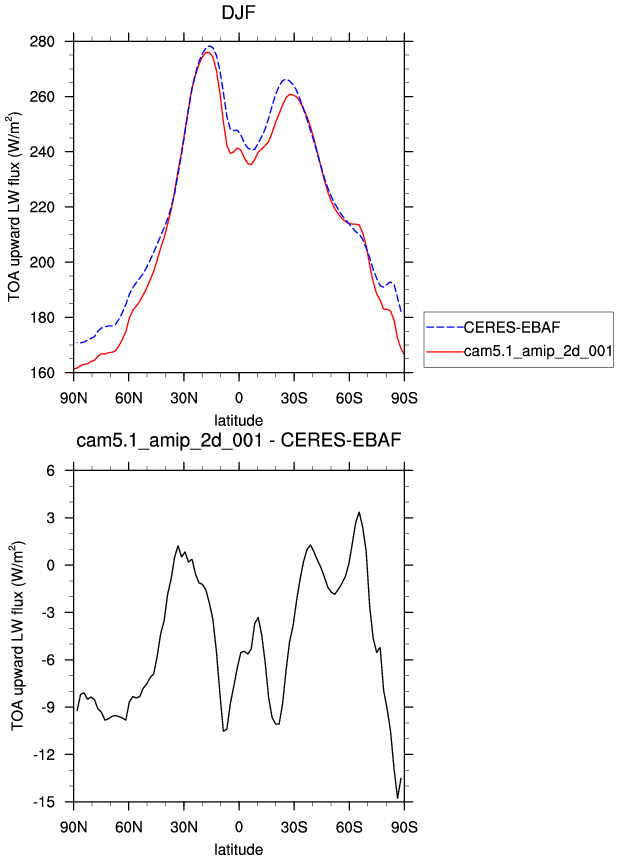
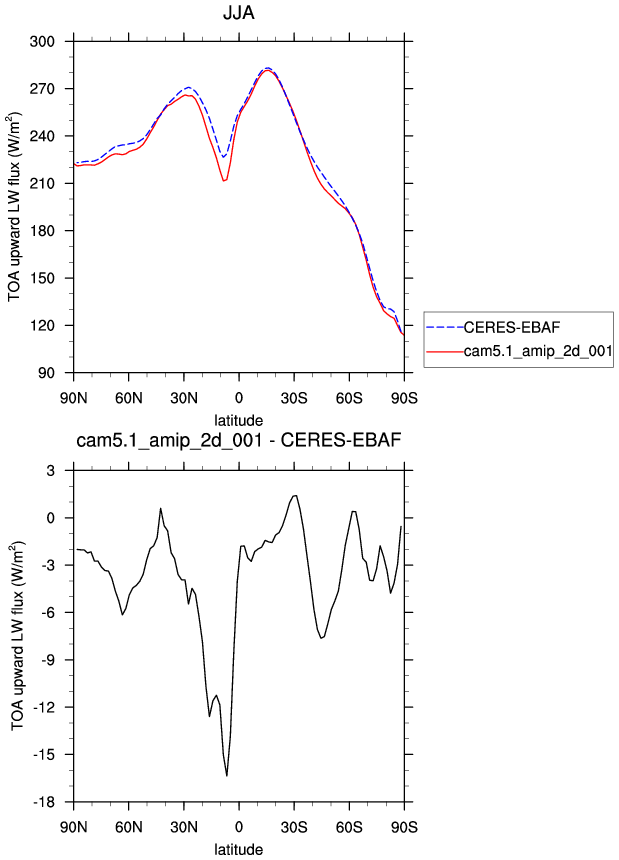
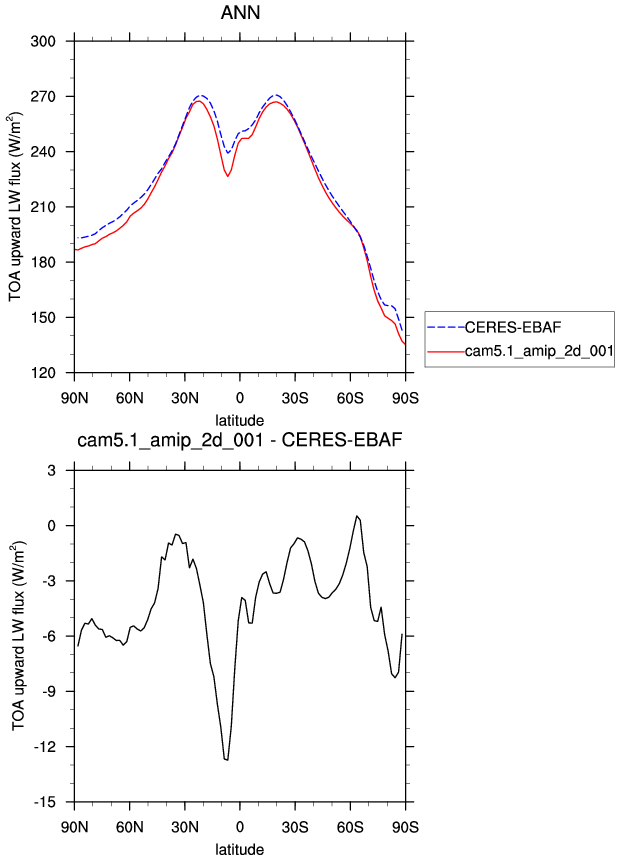
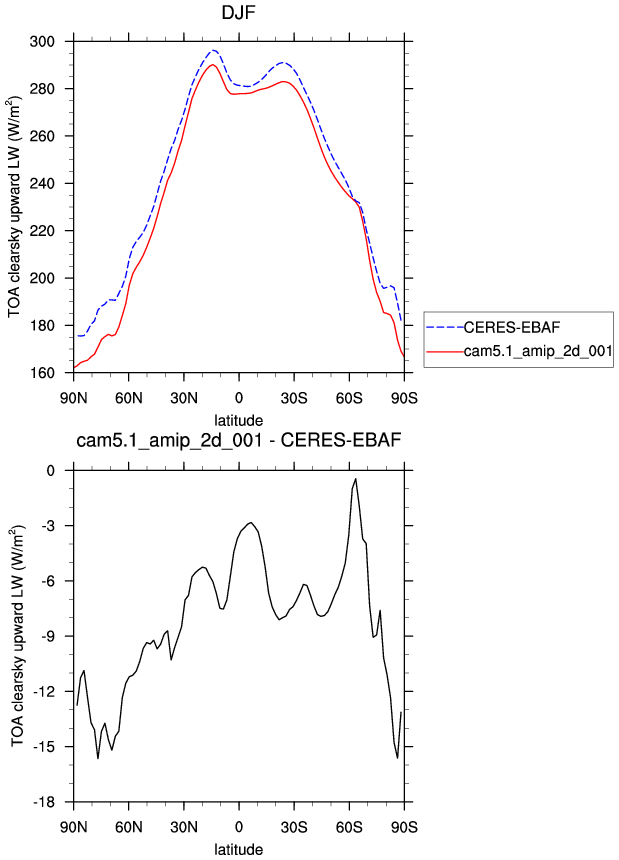
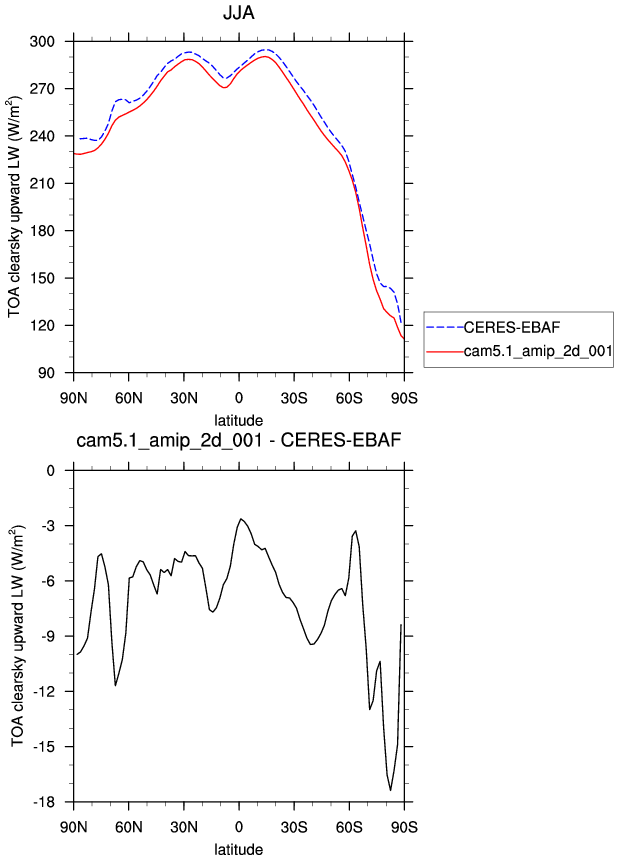
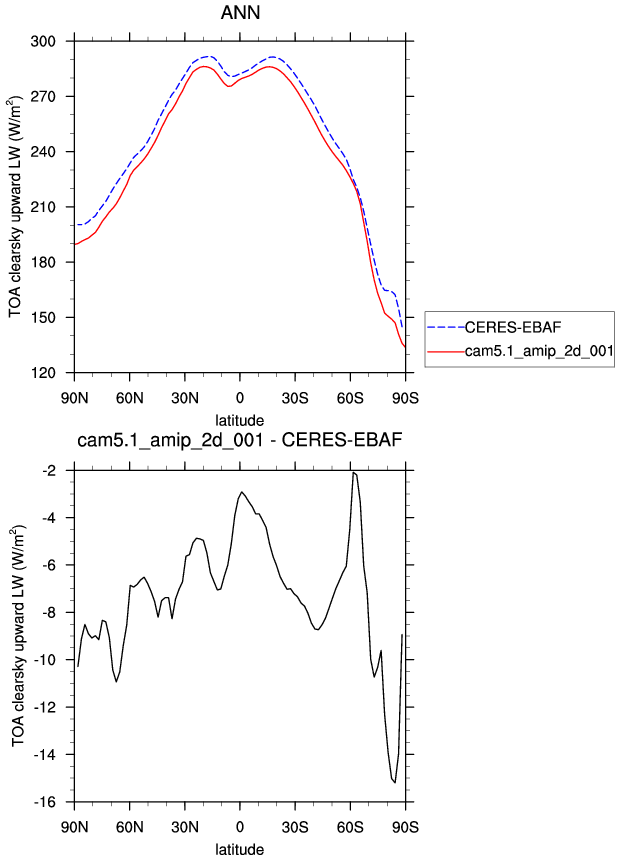
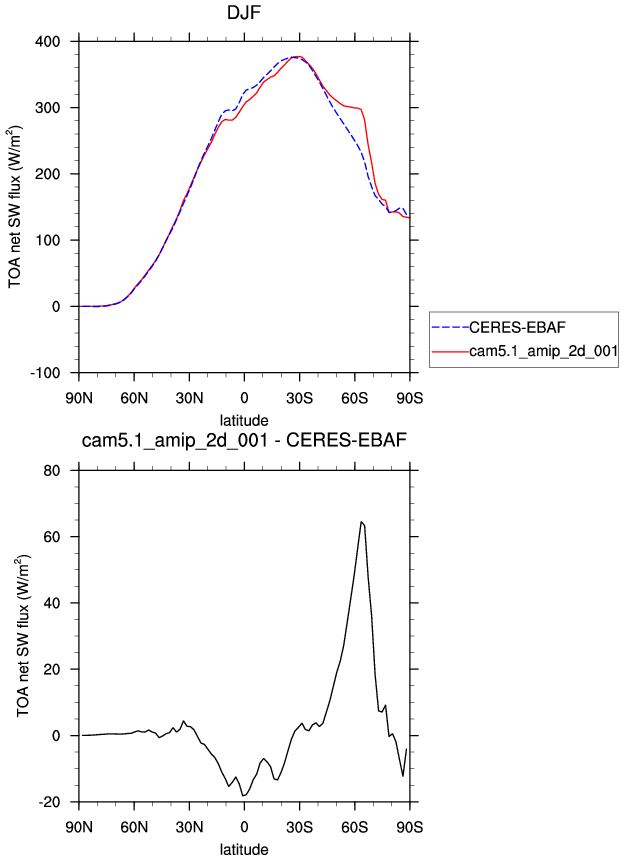
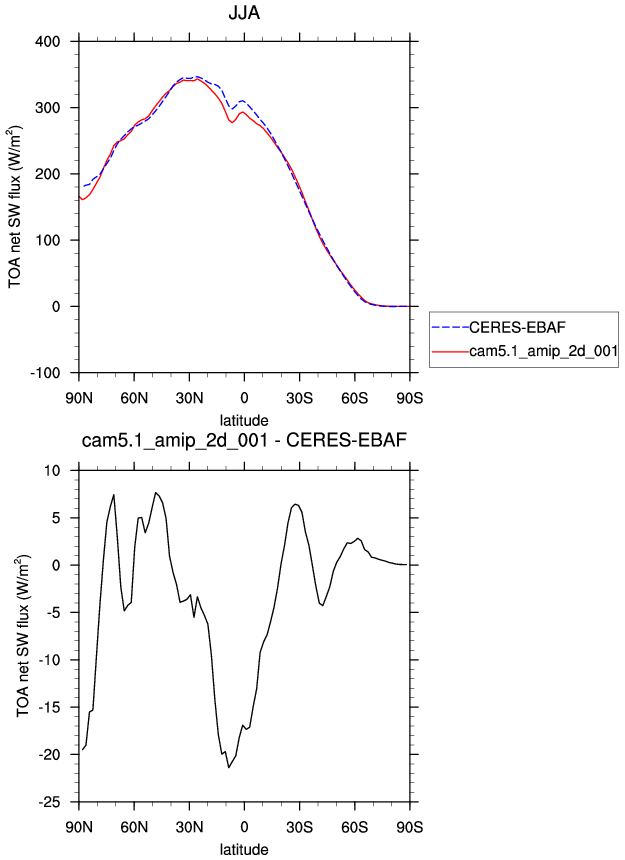
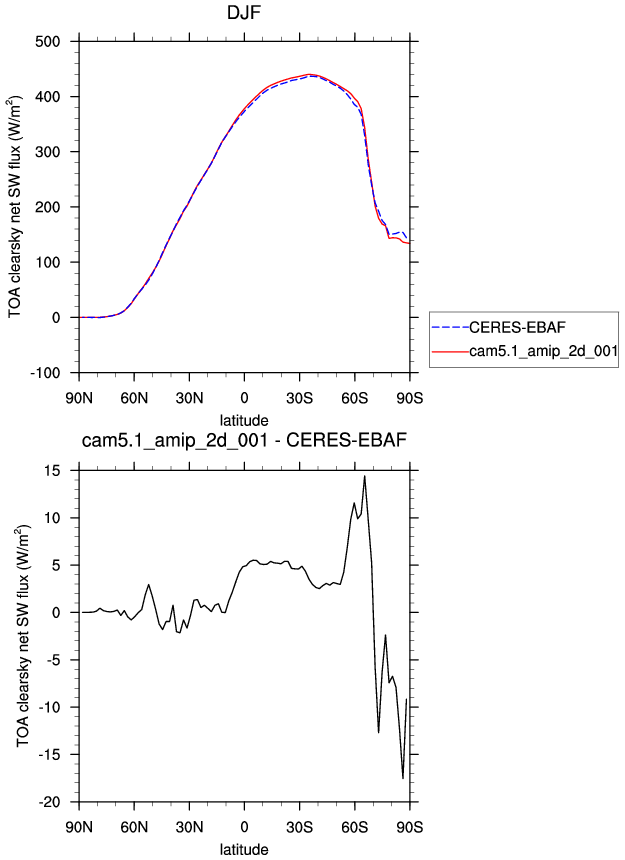
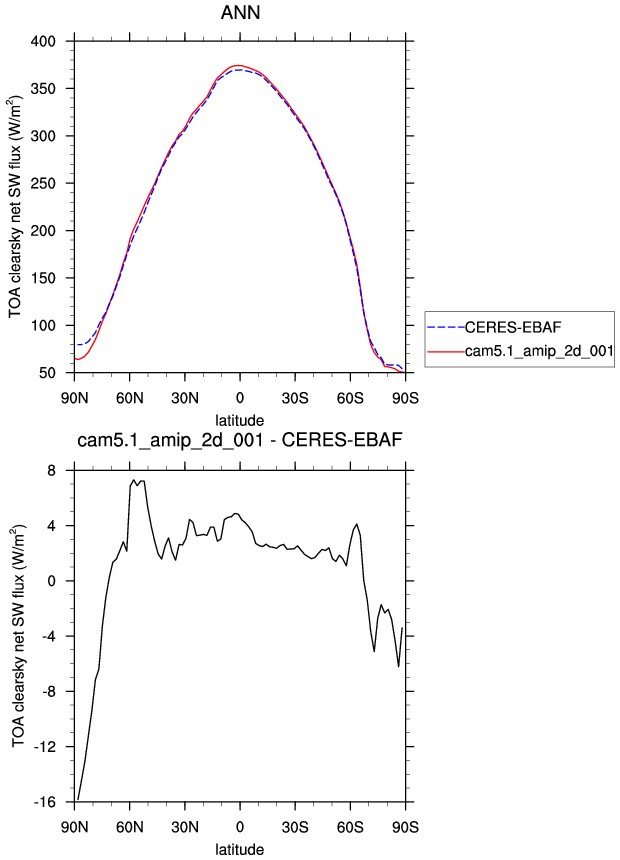
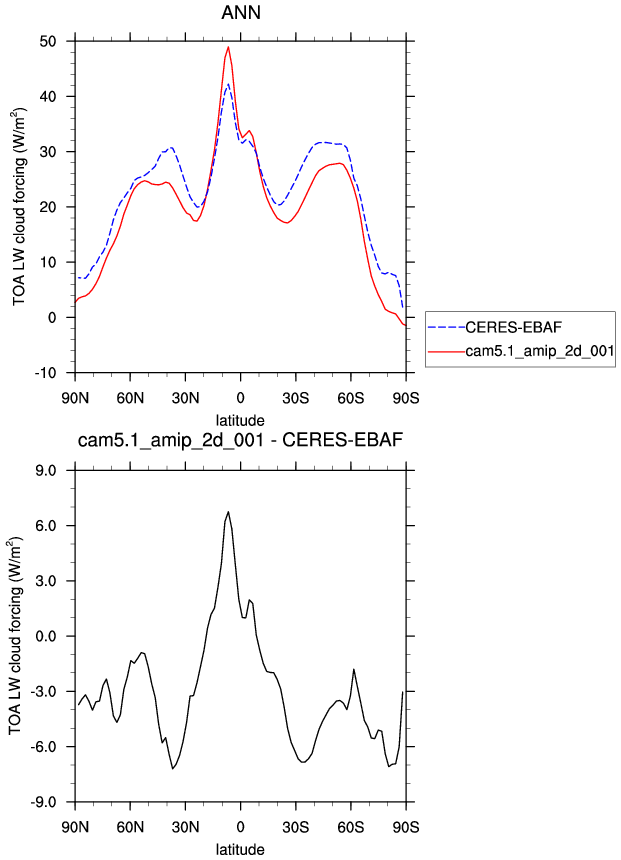
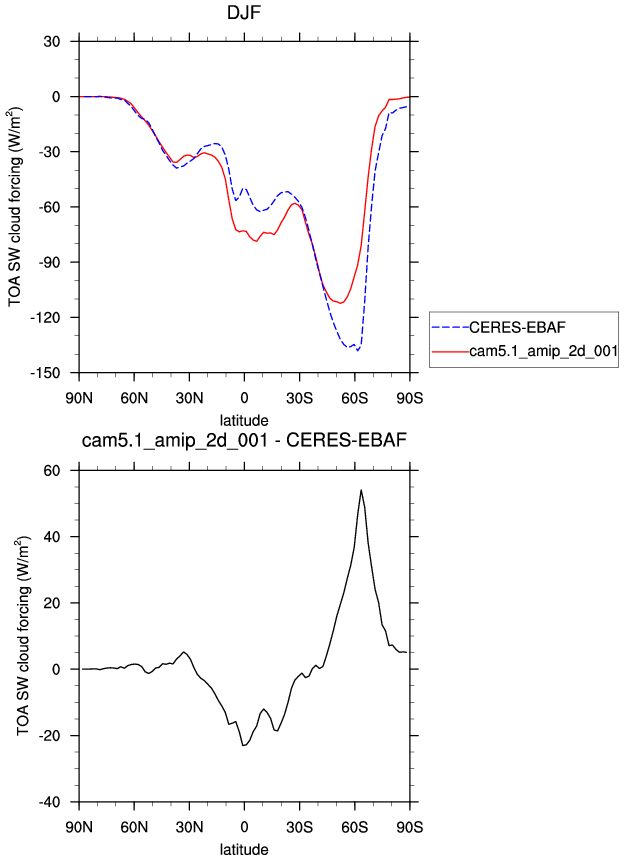
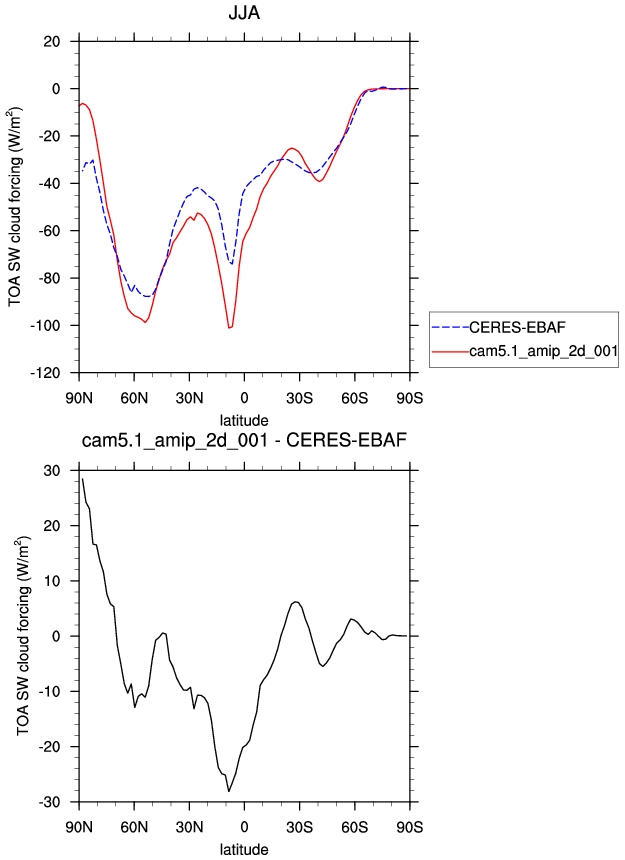
| CERES-EBAF March 2000-Feb 2010 | DJF | JJA | ANN | |
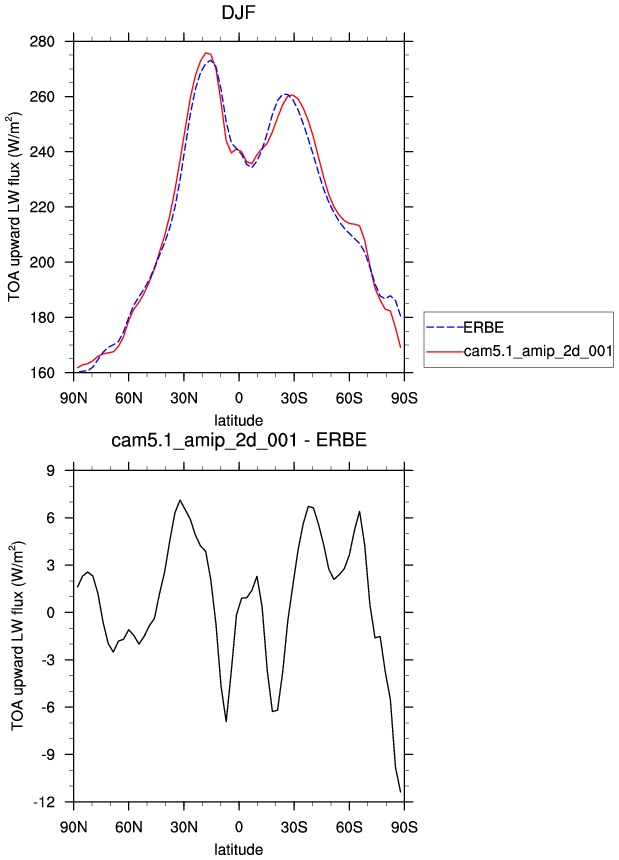
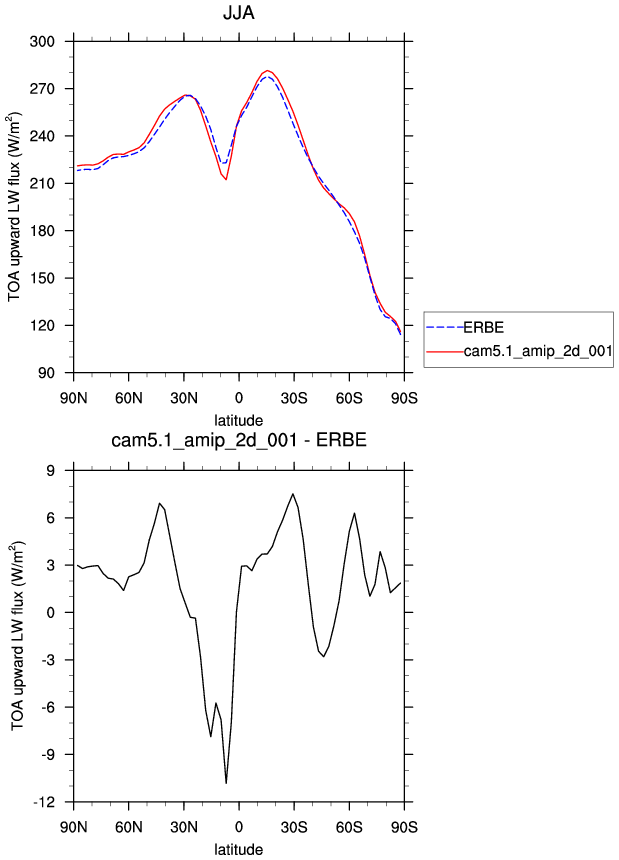
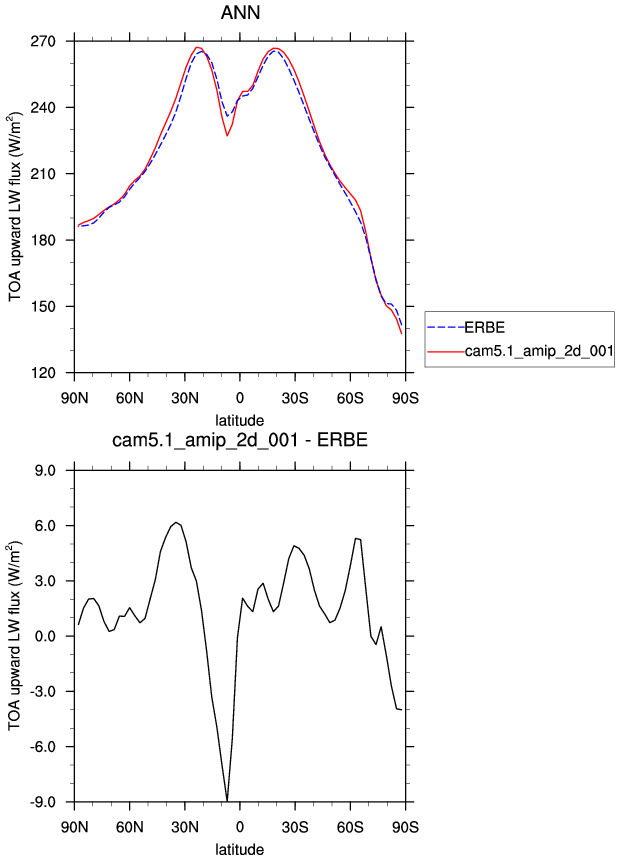
| FLUT * | TOA upward LW flux | plot | plot | plot |
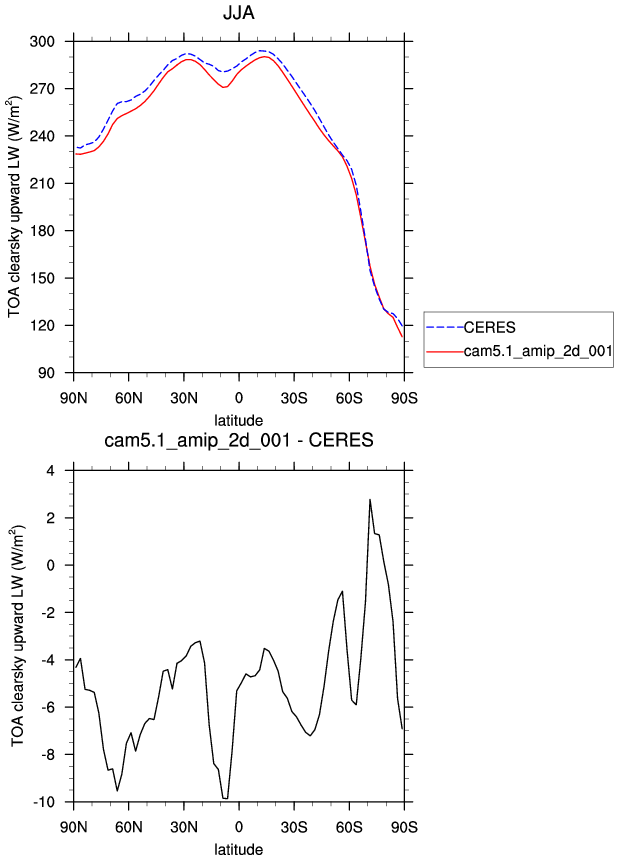
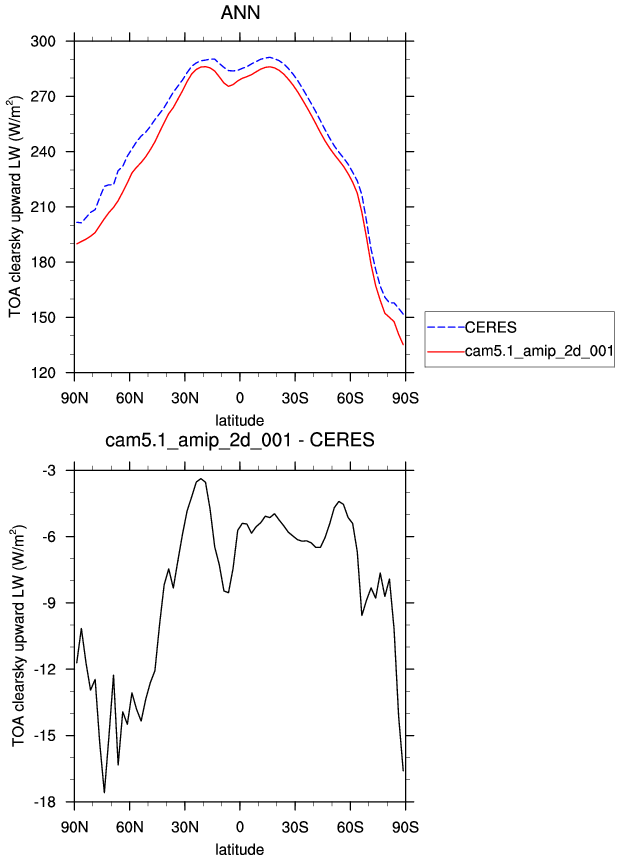
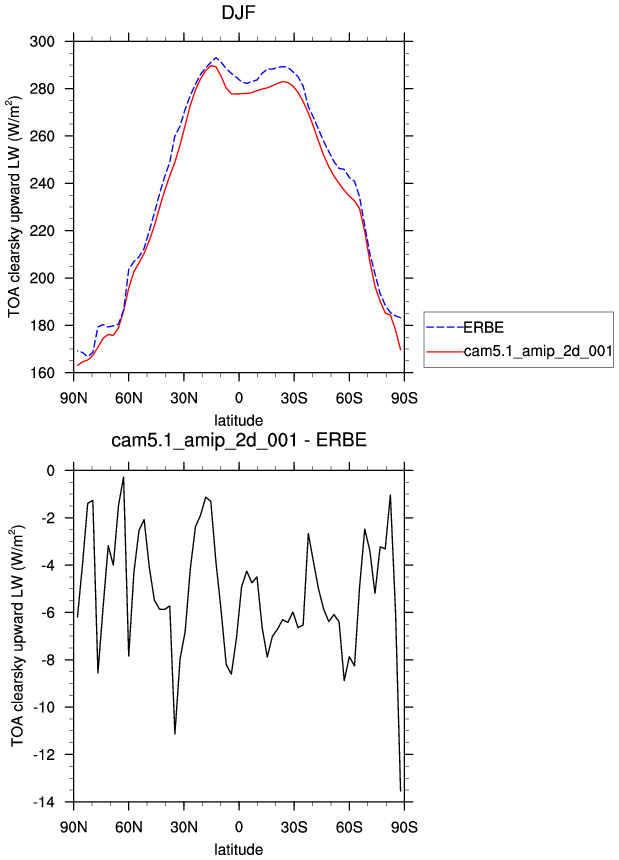
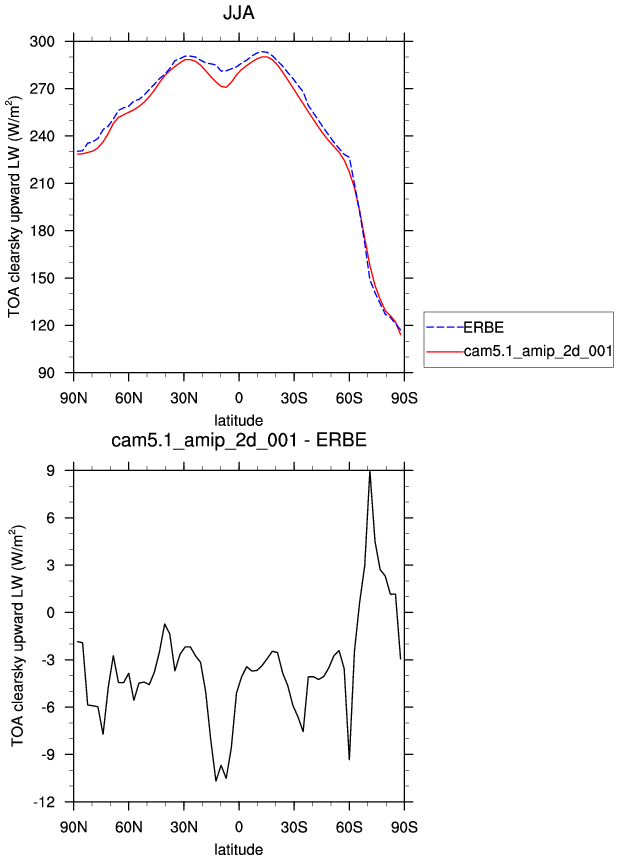
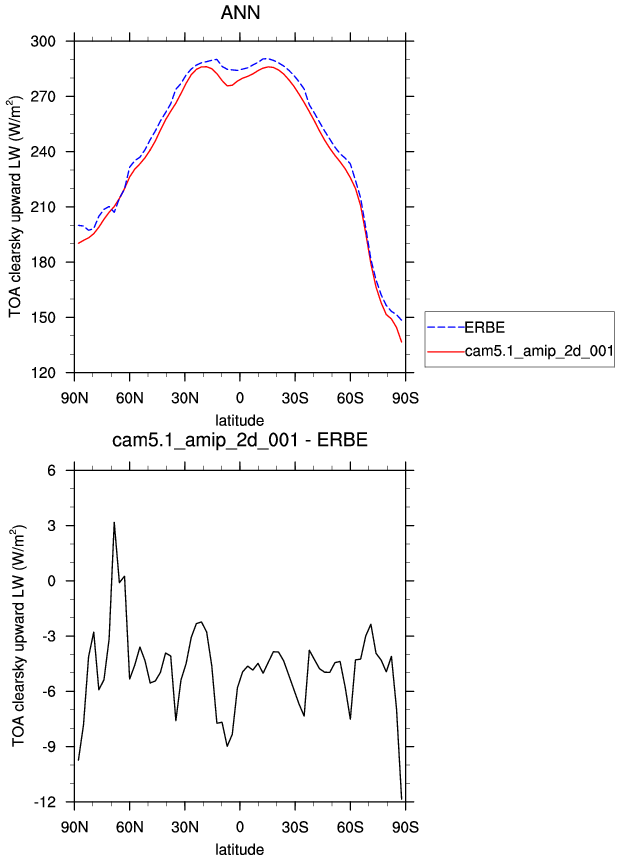
| FLUTC * | TOA clearsky upward LW flux | plot | plot | plot |
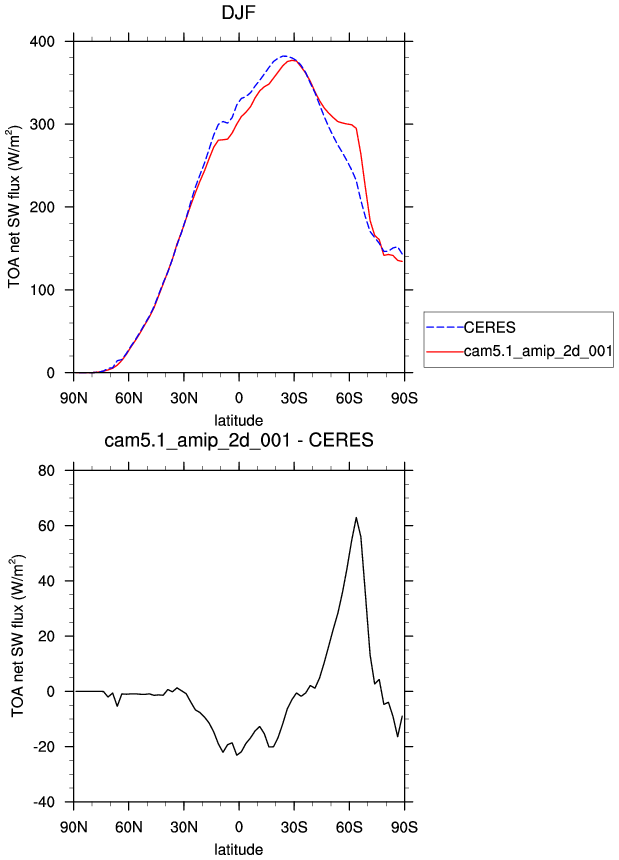
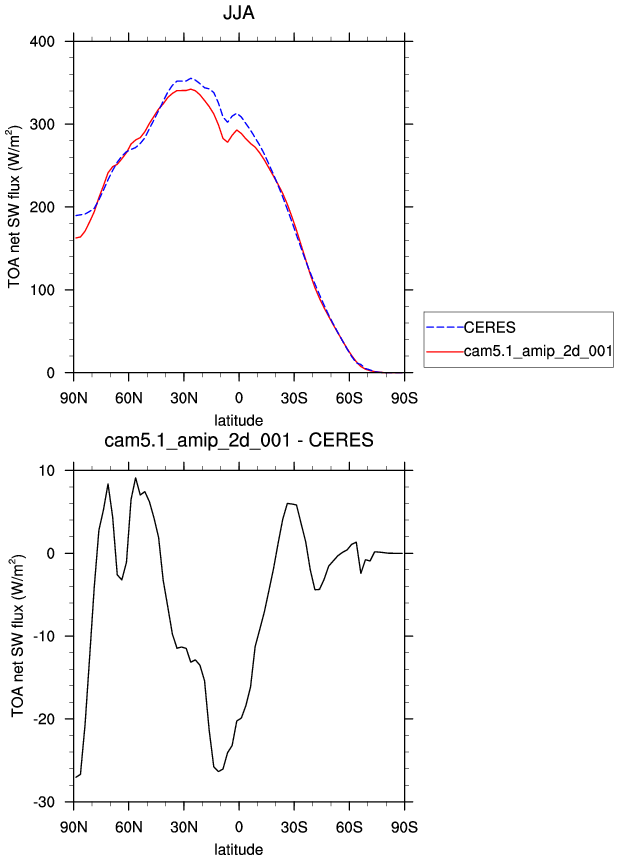
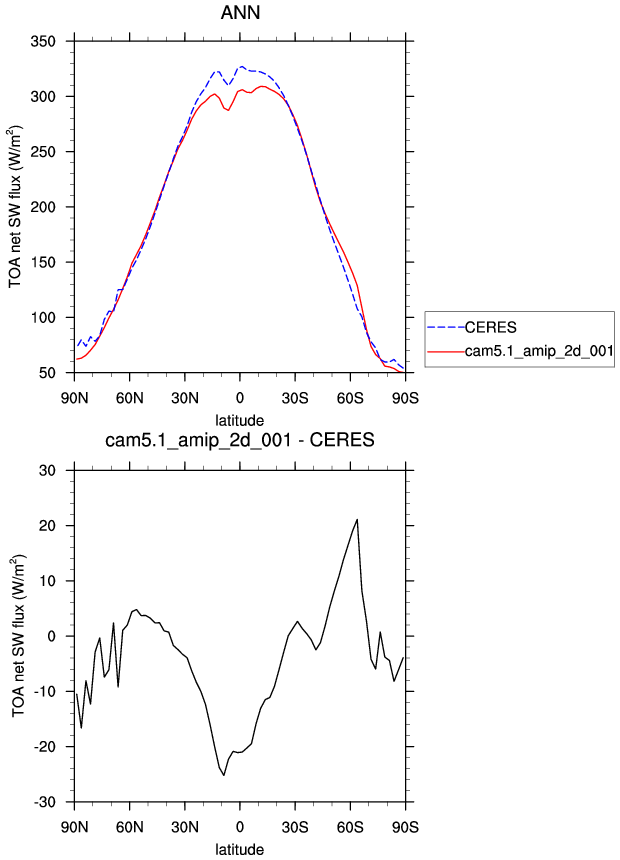
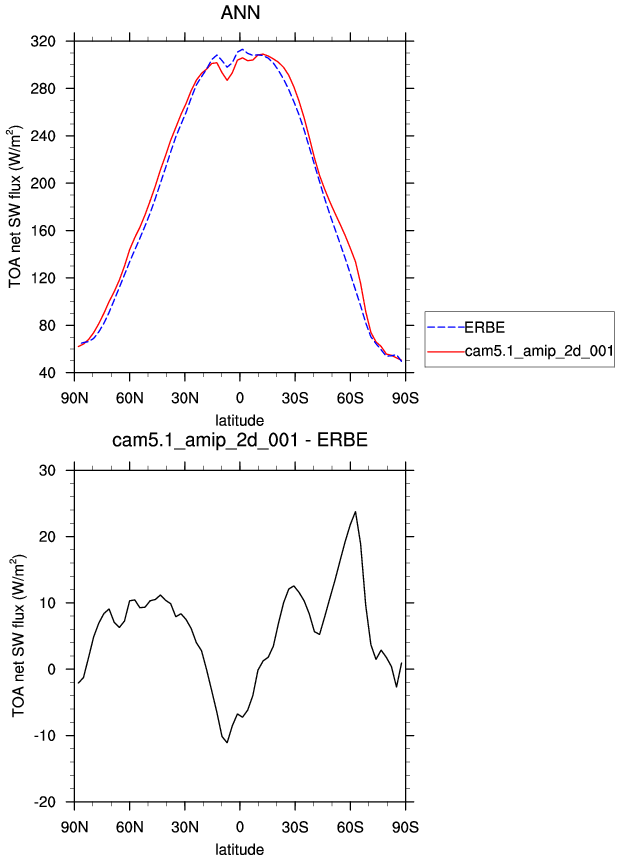
| FSNTOA * | TOA net SW flux | plot | plot | plot |
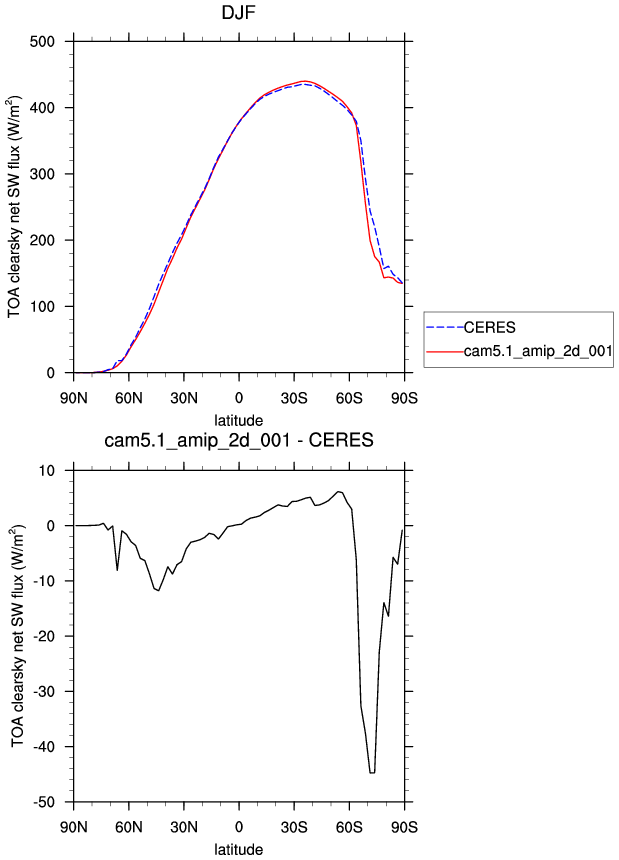
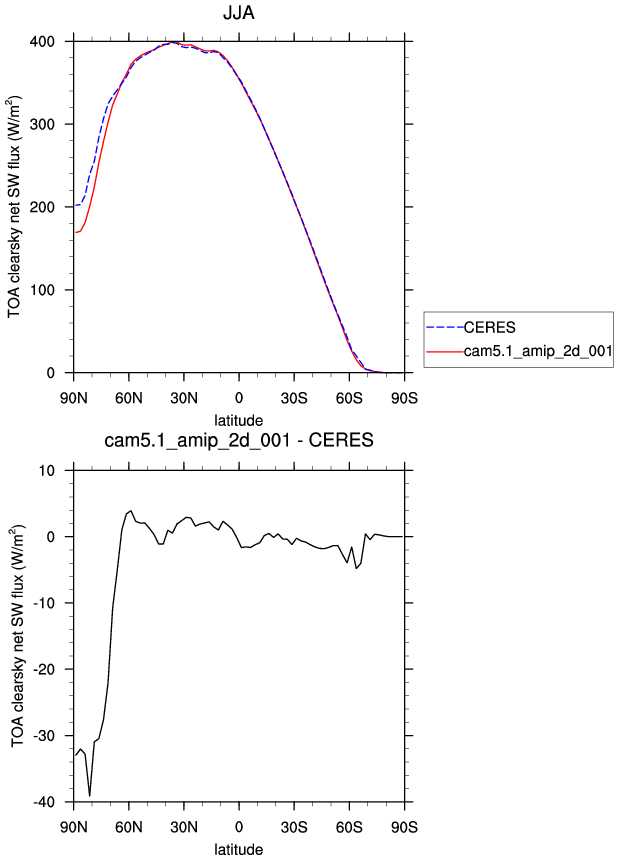
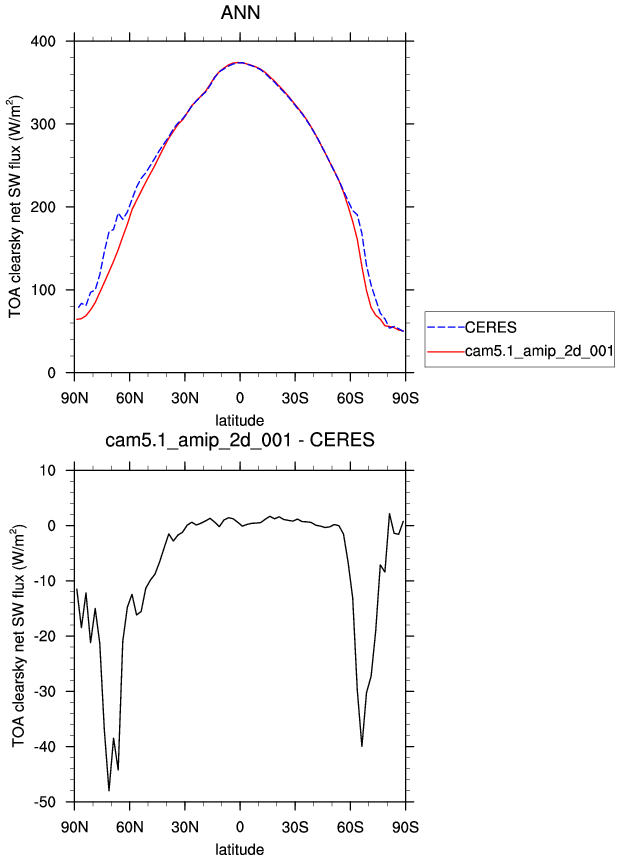
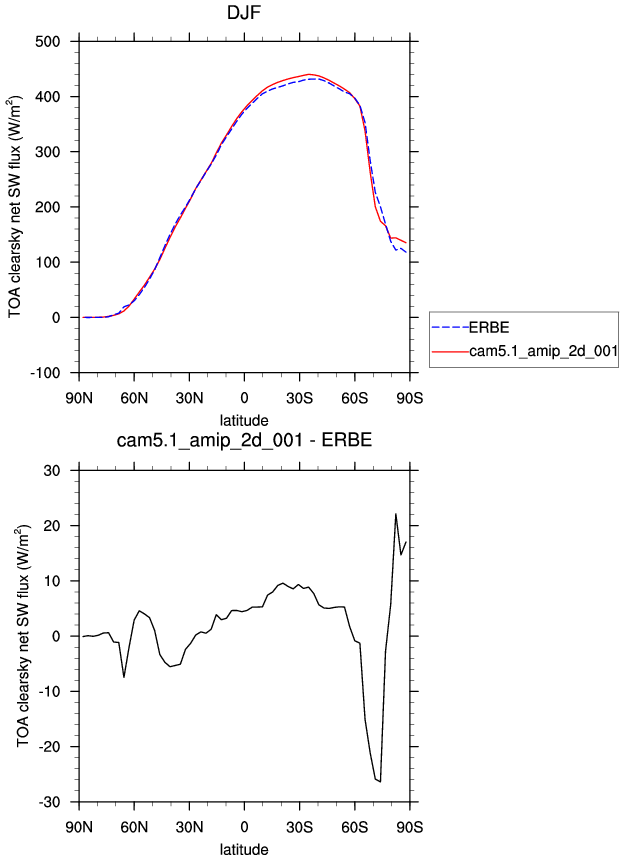
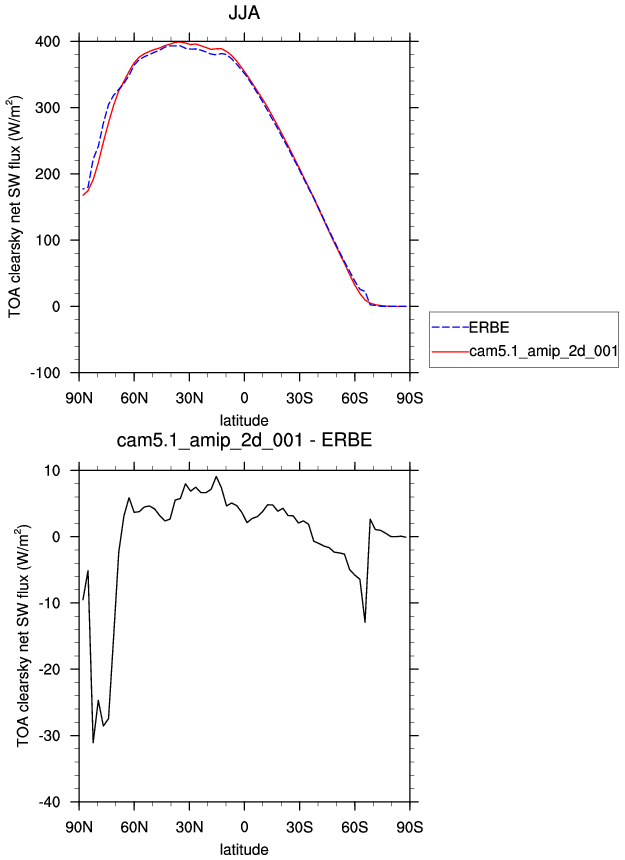
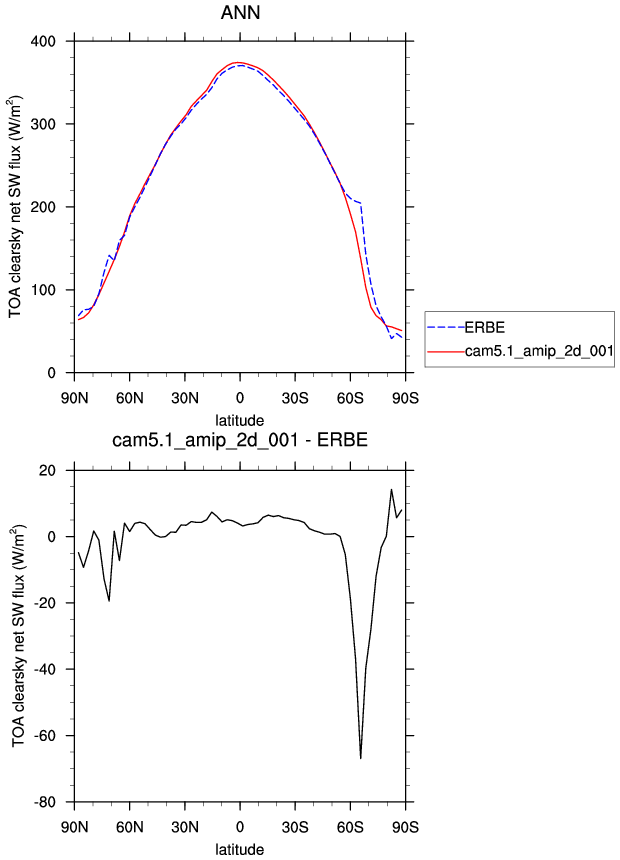
| FSNTOAC * | TOA clearsky net SW flux | plot | plot | plot |
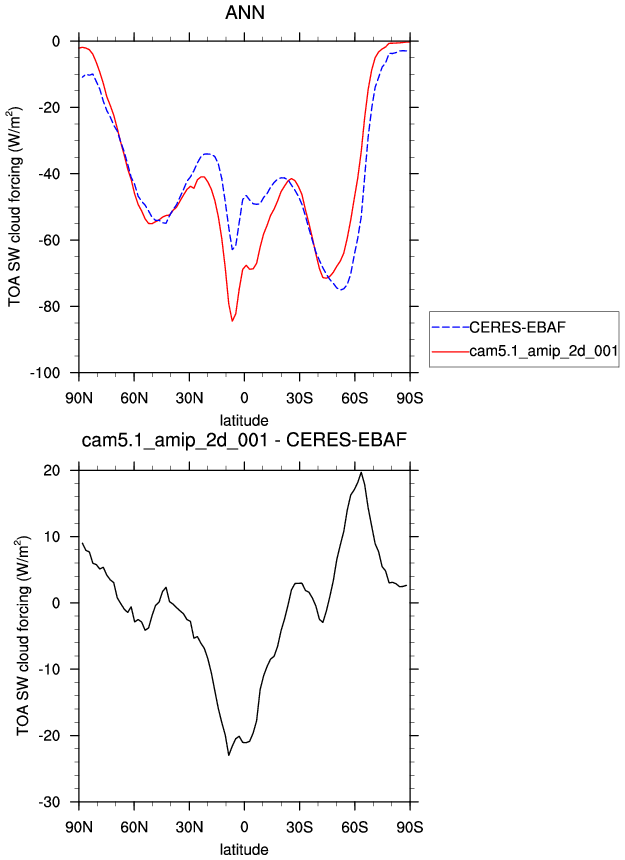
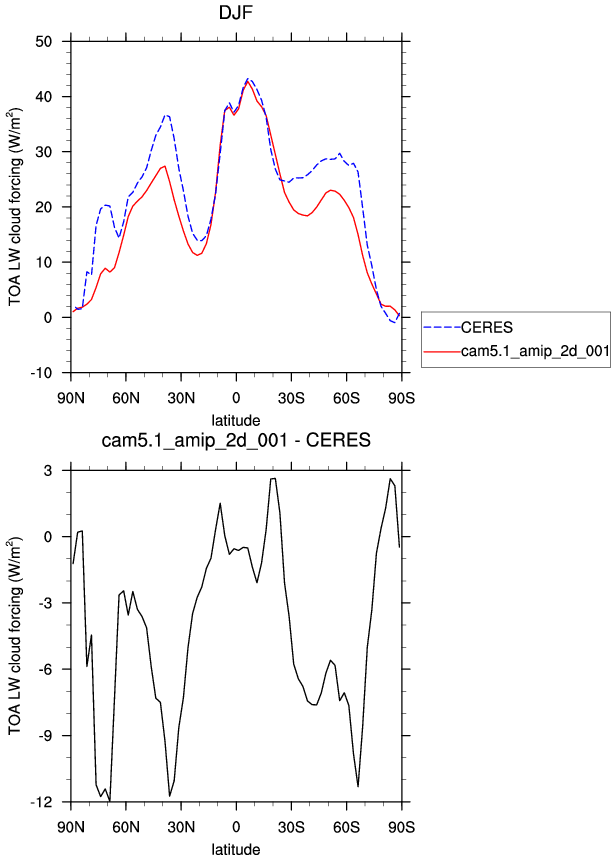
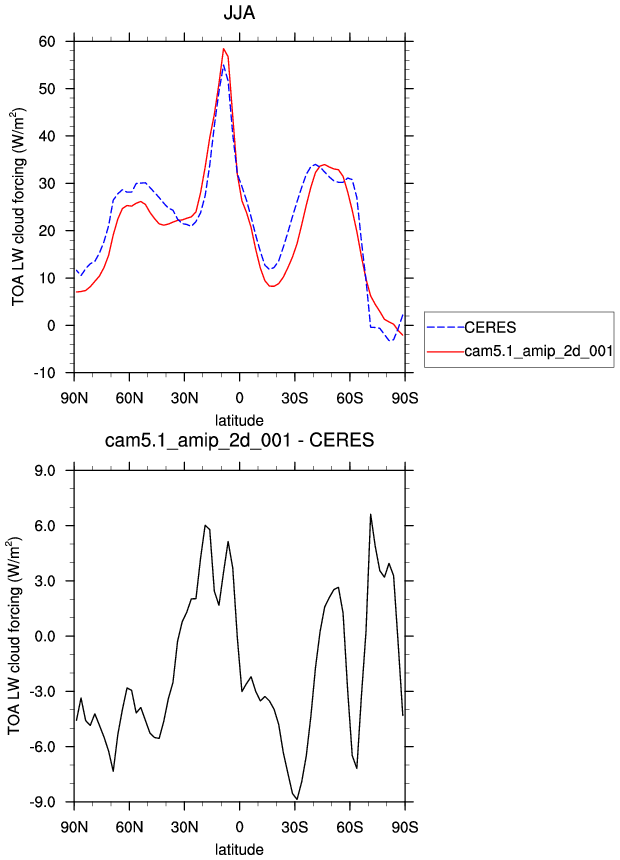
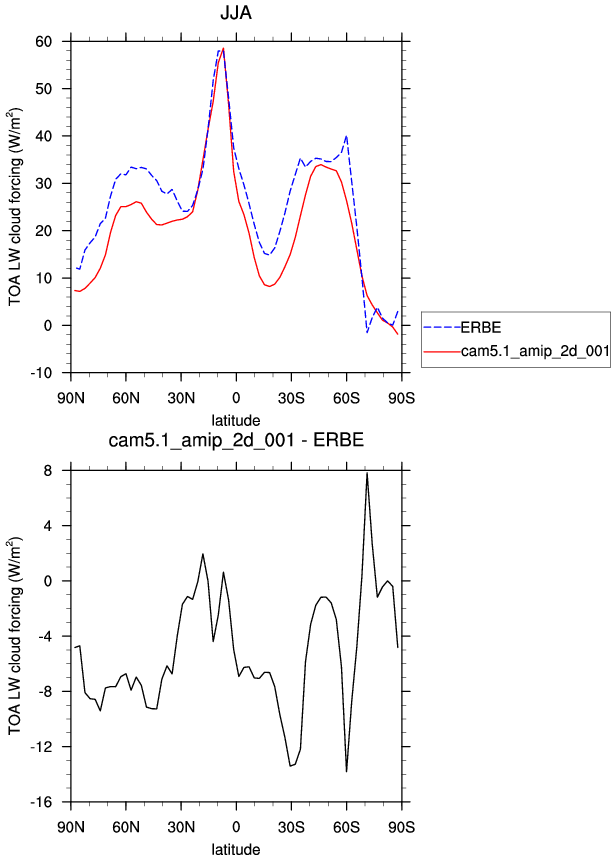
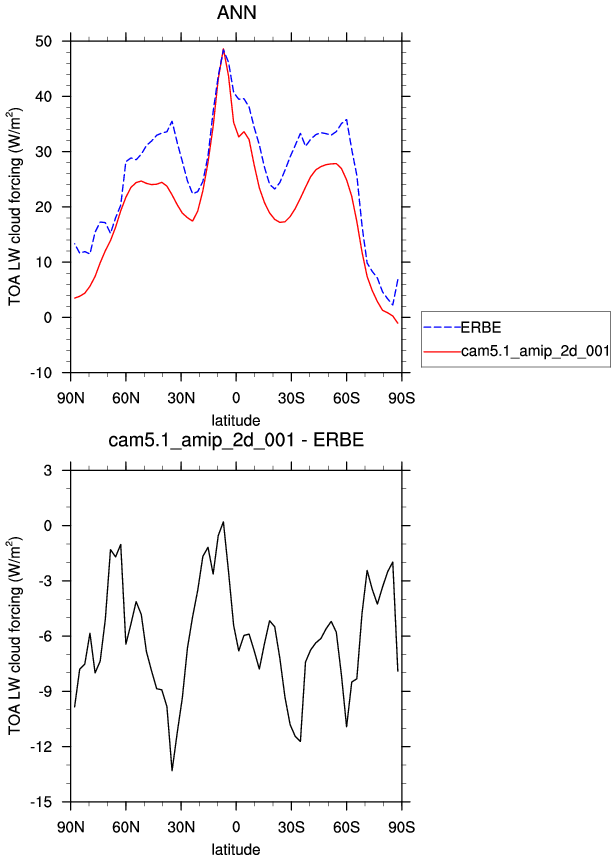
| LWCF * | TOA longwave cloud forcing | plot | plot | plot |
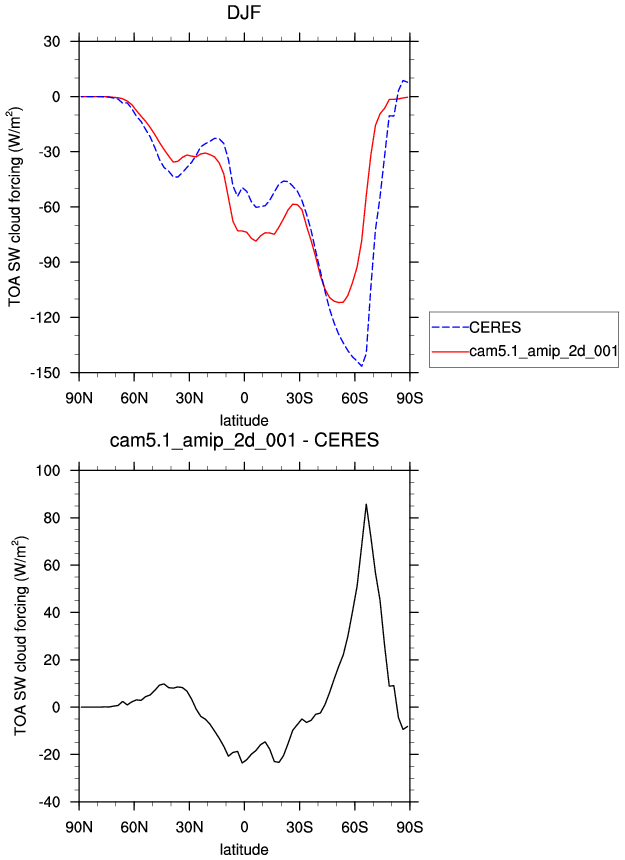
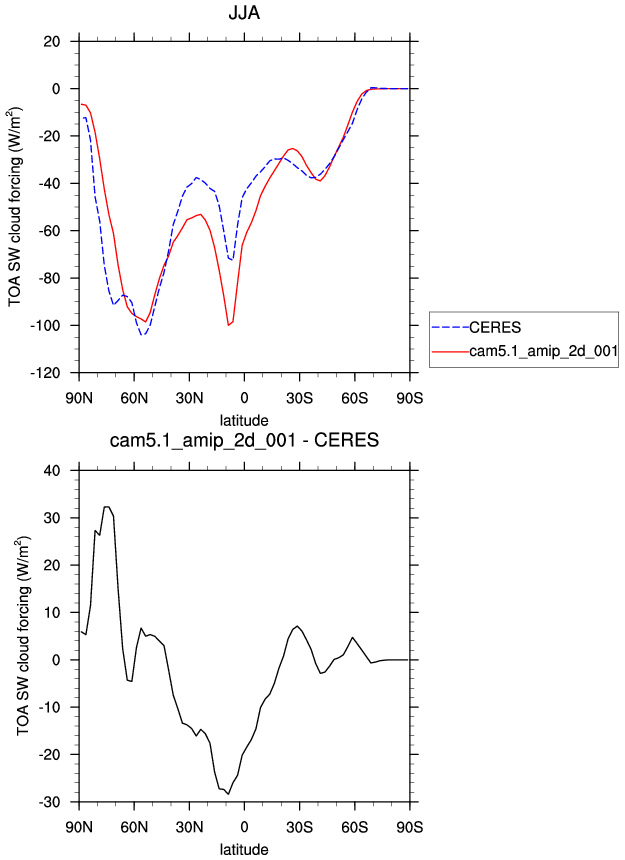
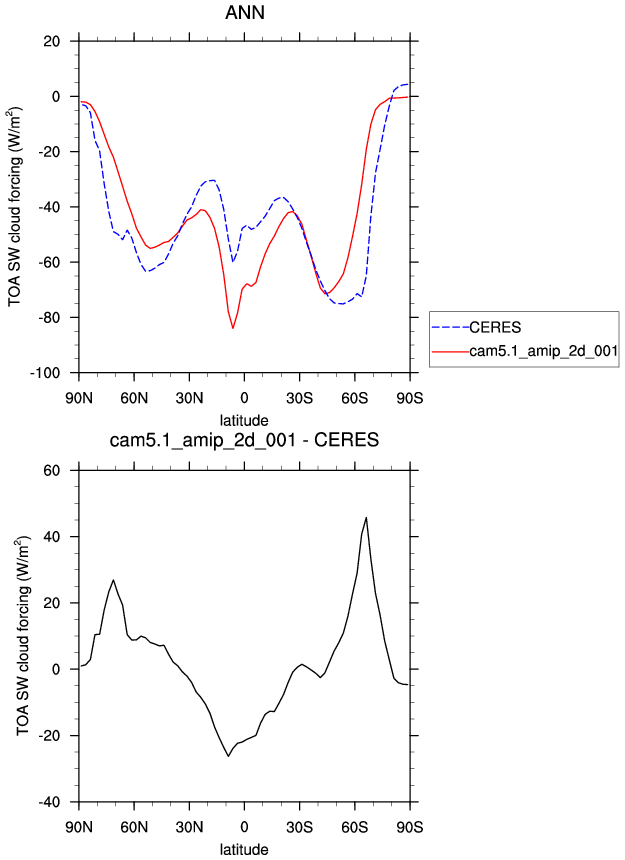
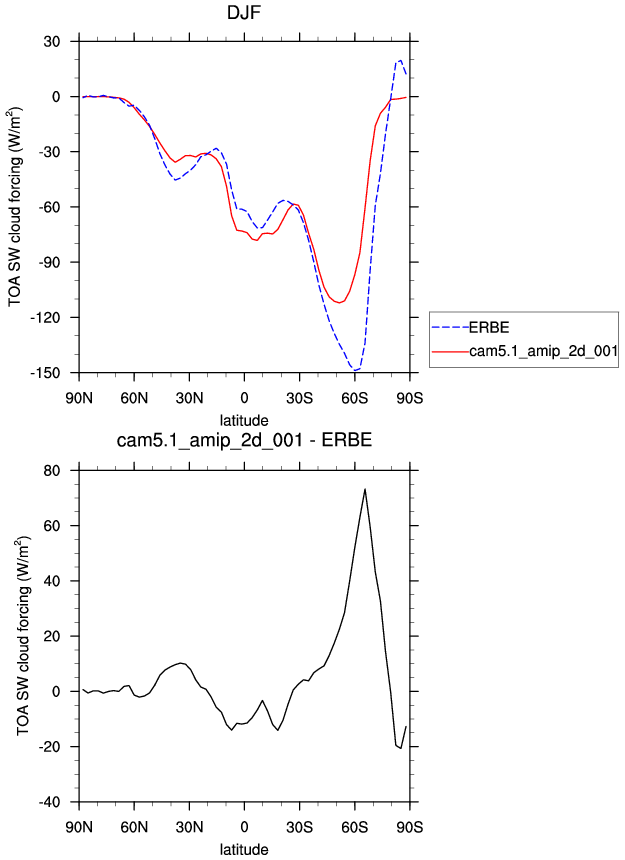
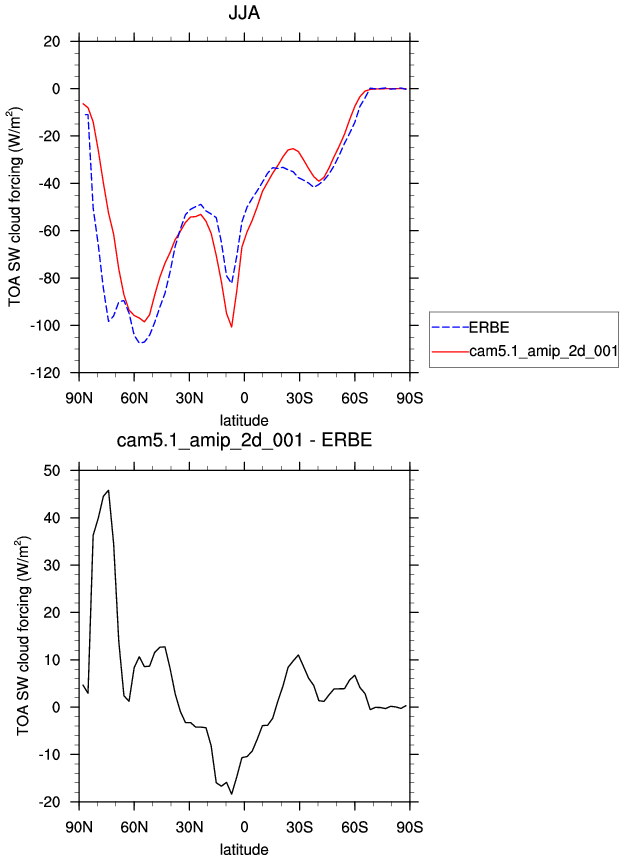
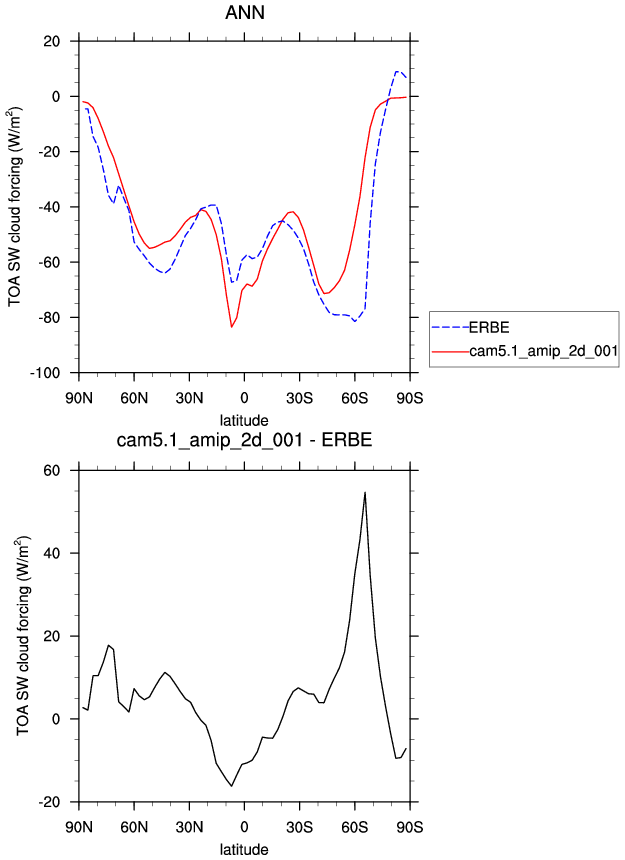
| SWCF * | TOA shortwave cloud forcing | plot | plot | plot |
| CERES 2000-2003 | DJF | JJA | ANN | |
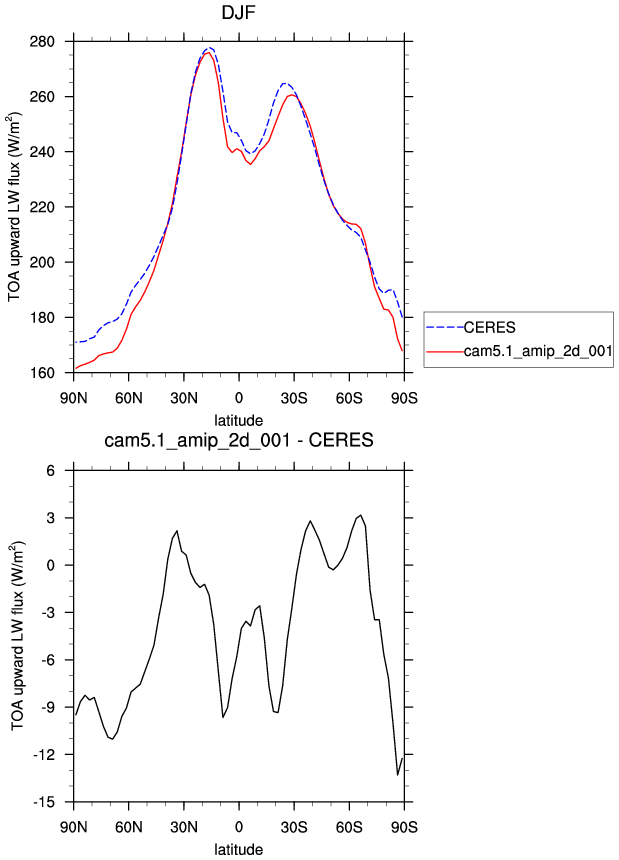
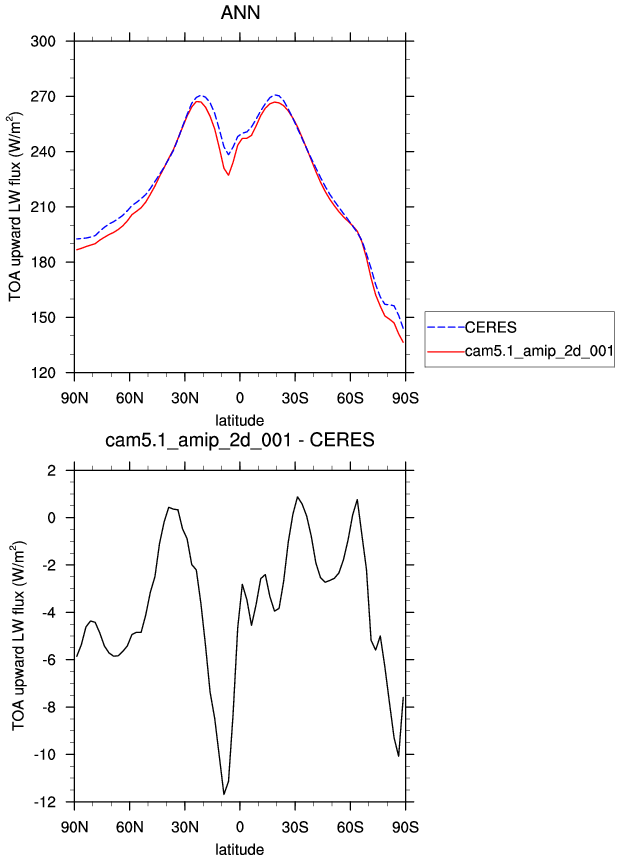
| FLUT * | TOA upward LW flux | plot | plot | plot |
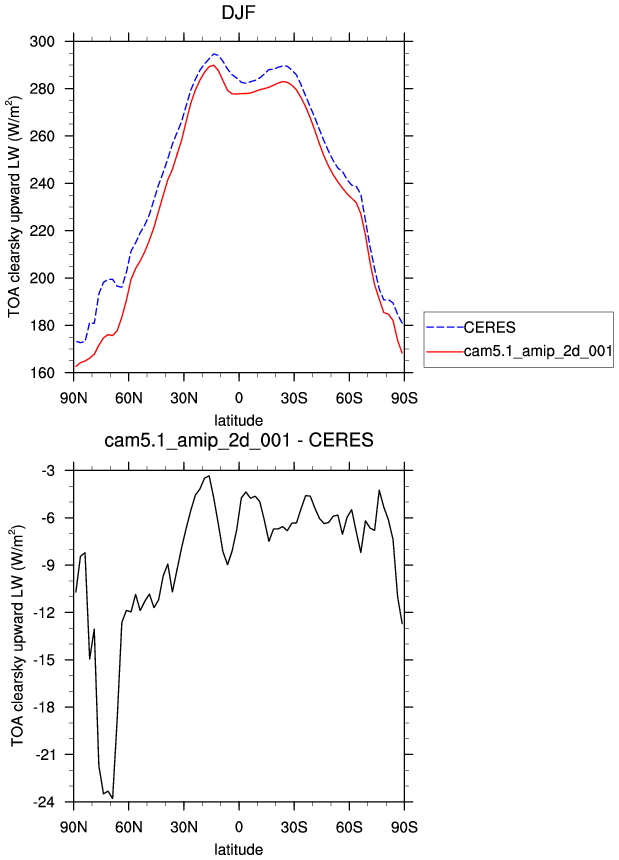
| FLUTC * | TOA clearsky upward LW flux | plot | plot | plot |
| FSNTOA * | TOA net SW flux | plot | plot | plot |
| FSNTOAC * | TOA clearsky net SW flux | plot | plot | plot |
| LWCF * | TOA longwave cloud forcing | plot | plot | plot |
| SWCF * | TOA shortwave cloud forcing | plot | plot | plot |
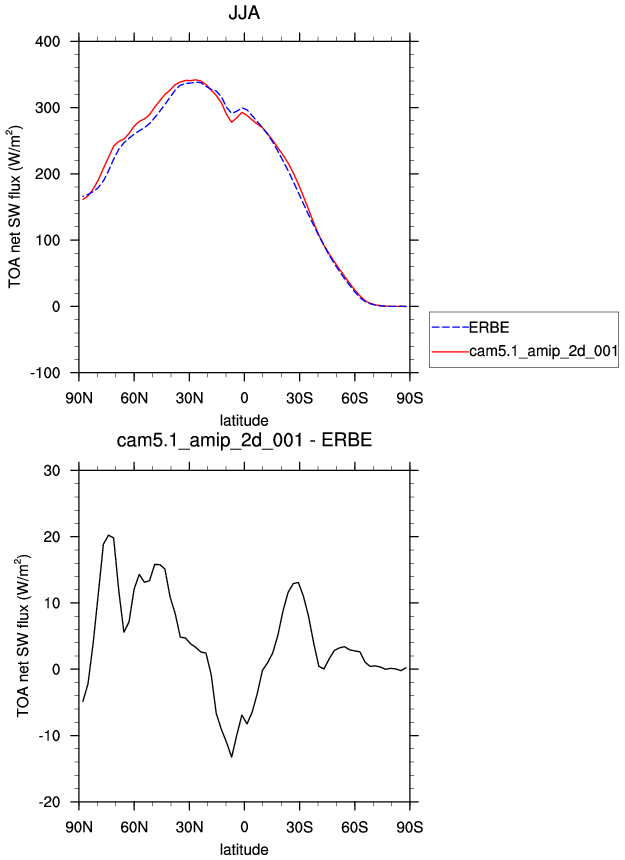
| ERBE Feb1985-Apr1989 | DJF | JJA | ANN | |
| FLUT * | TOA upward longwave flux | plot | plot | plot |
| FLUTC * | TOA clearsky upward longwave flux | plot | plot | plot |
| FSNTOA * | TOA net shortwave flux | plot | plot | plot |
| FSNTOAC * | TOA clearsky net shortwave flux | plot | plot | plot |
| LWCF * | TOA longwave cloud forcing | plot | plot | plot |
| SWCF * | TOA shortwave cloud forcing | plot | plot | plot |
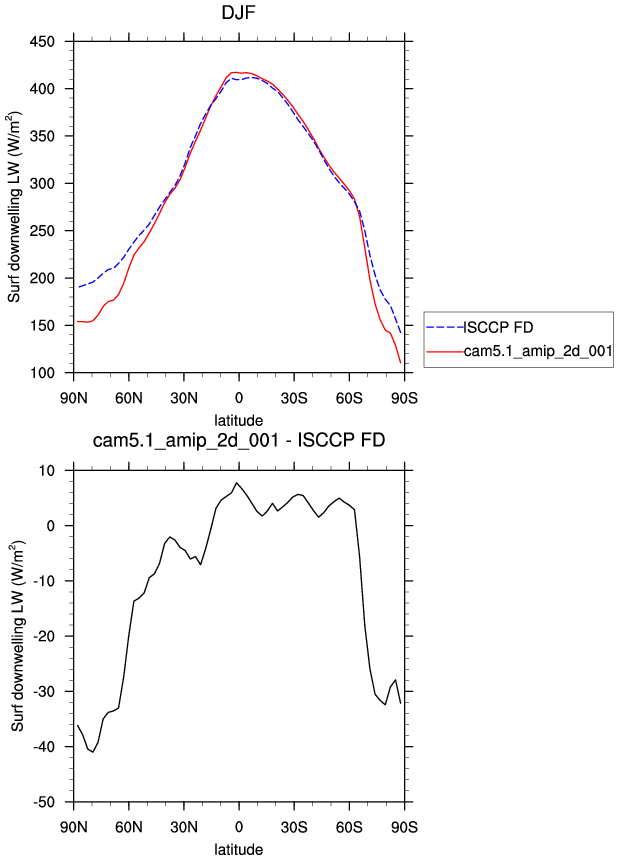
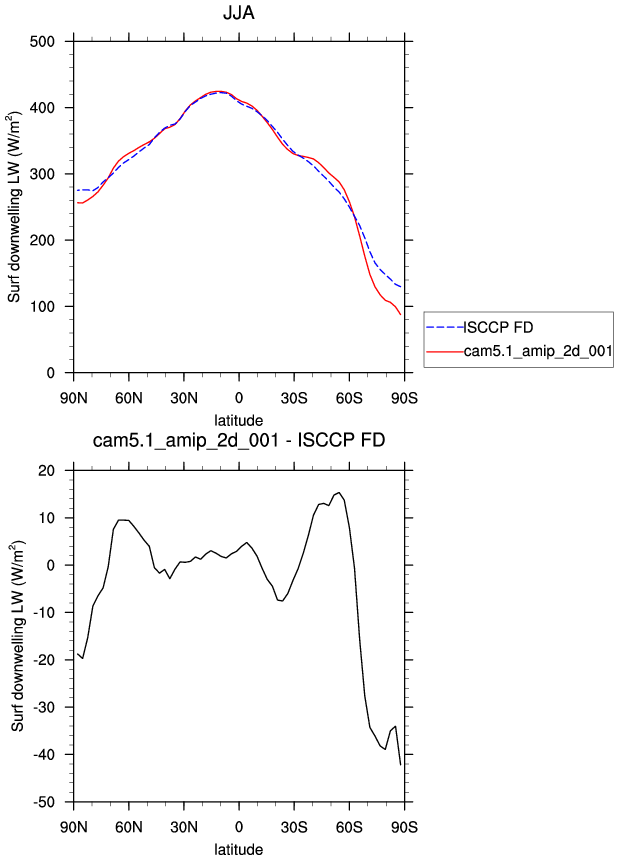
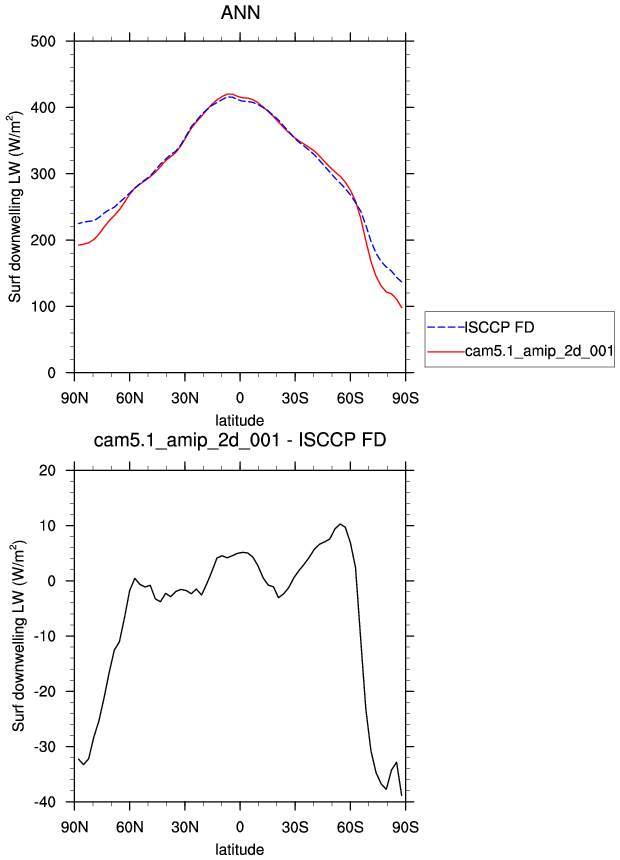
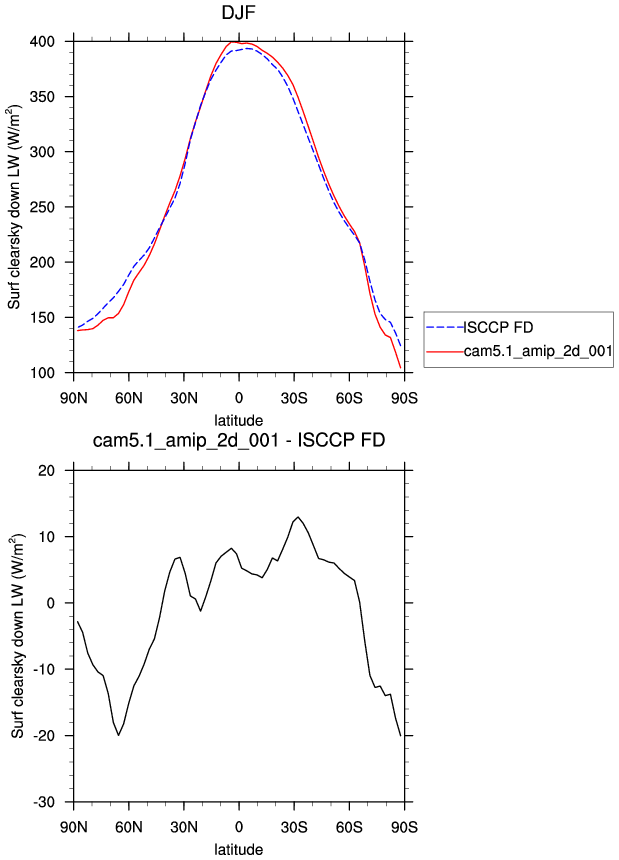
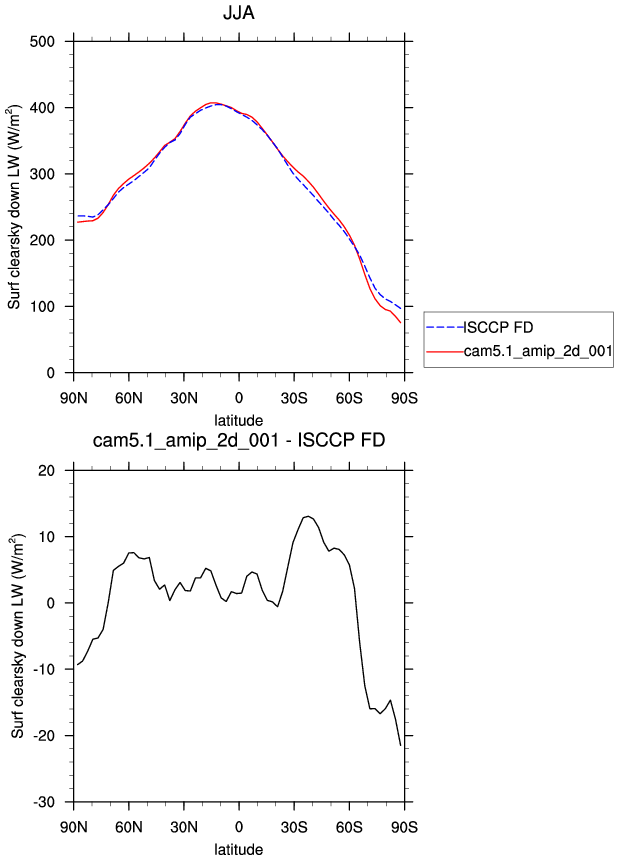
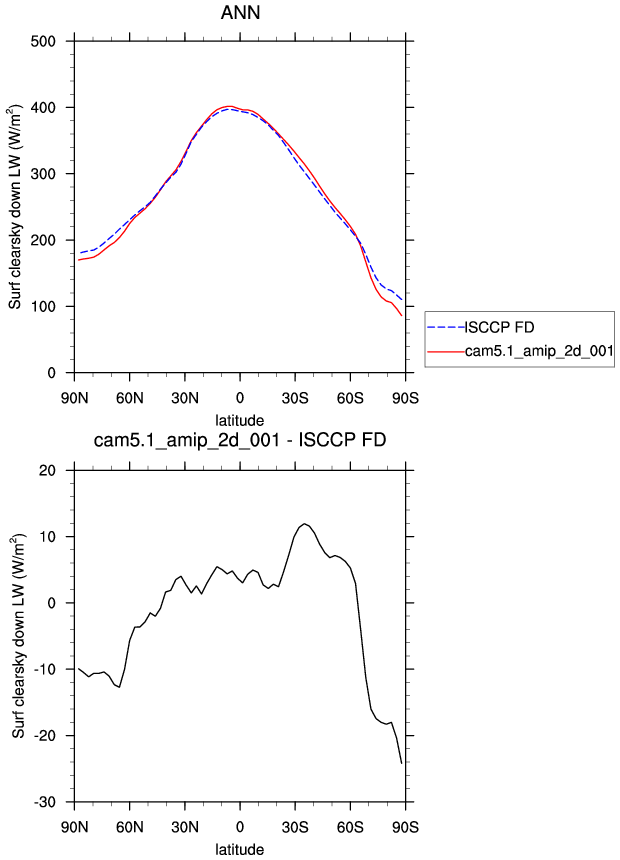
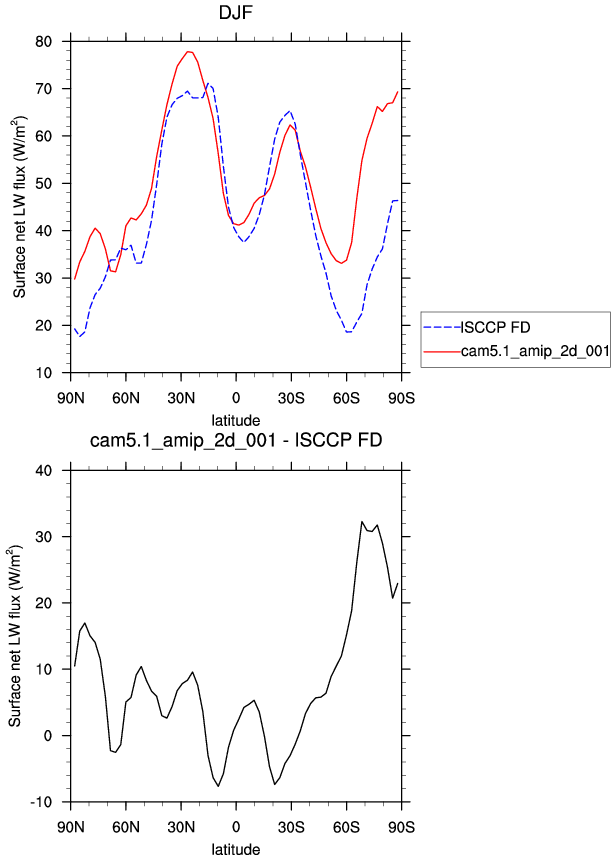
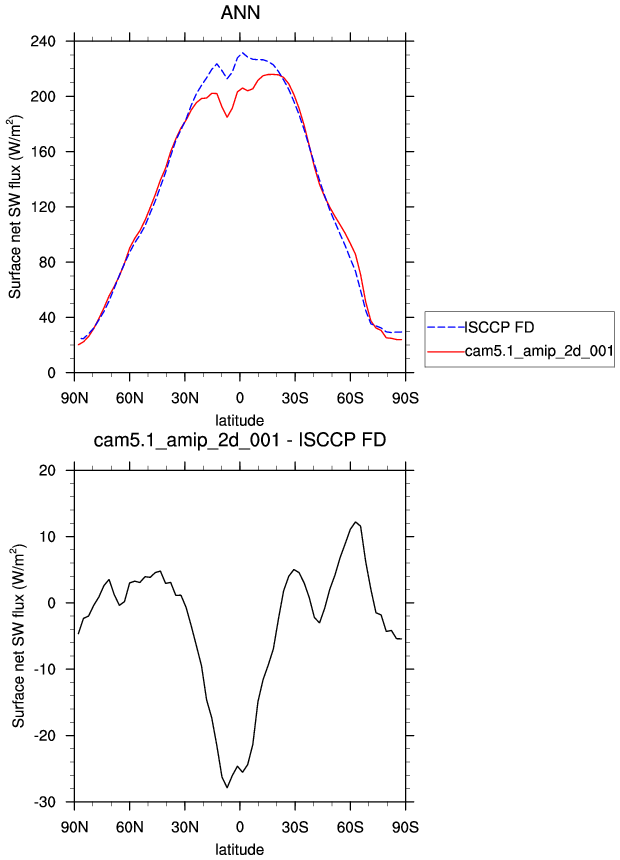
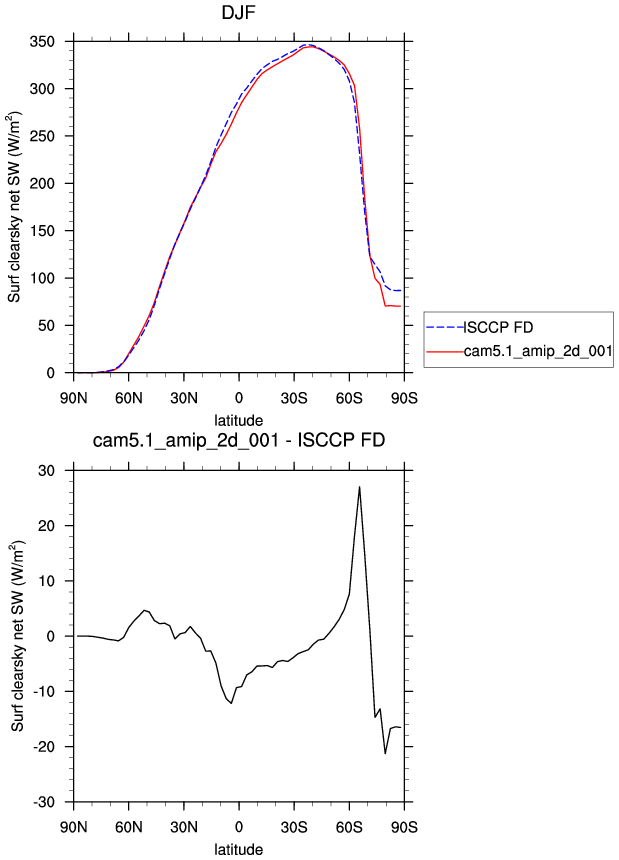
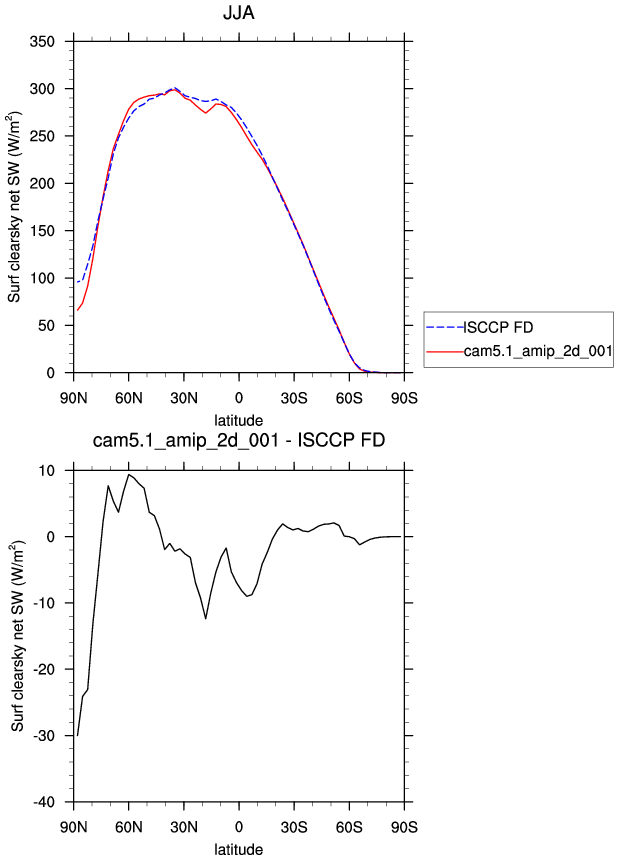
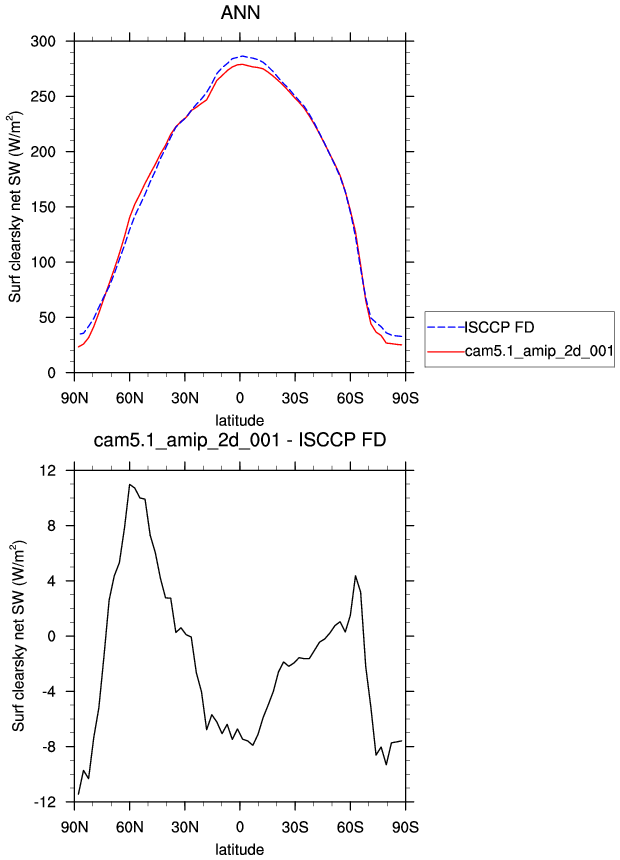
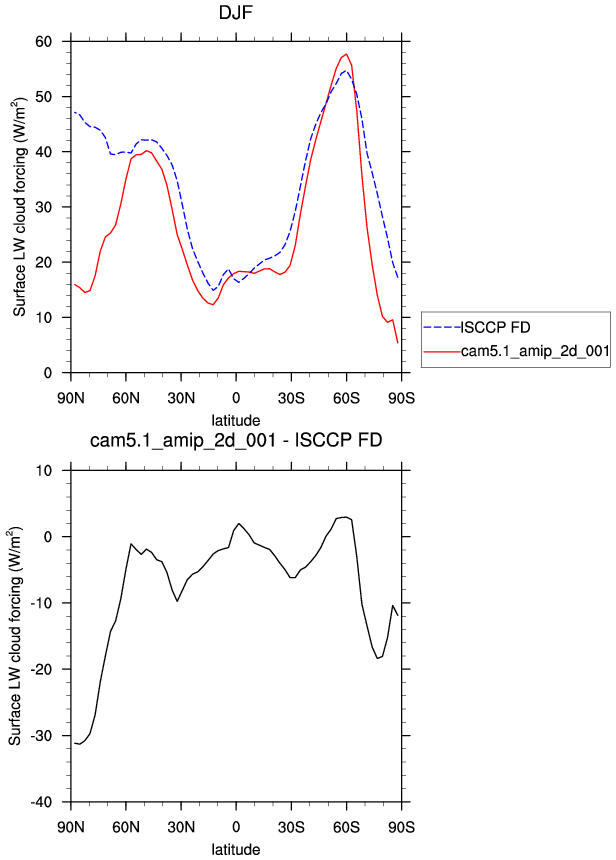
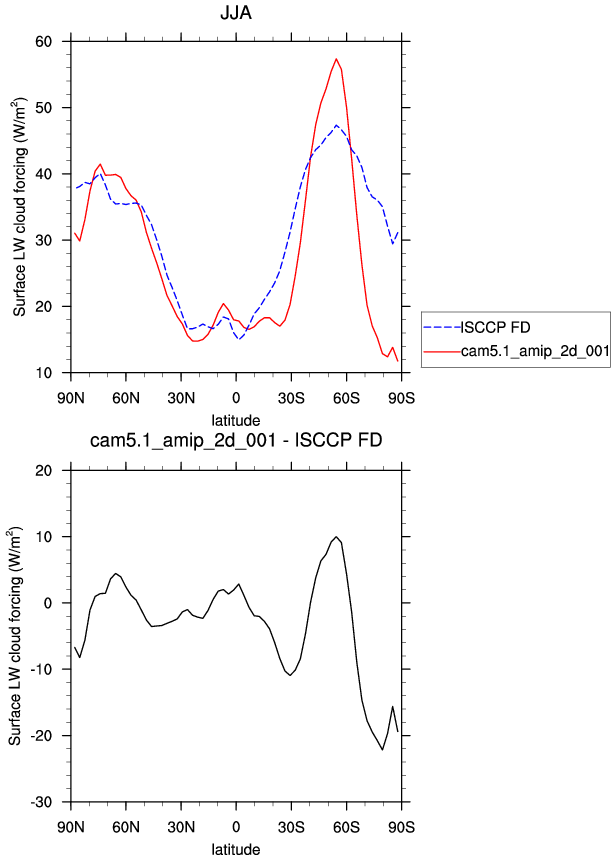
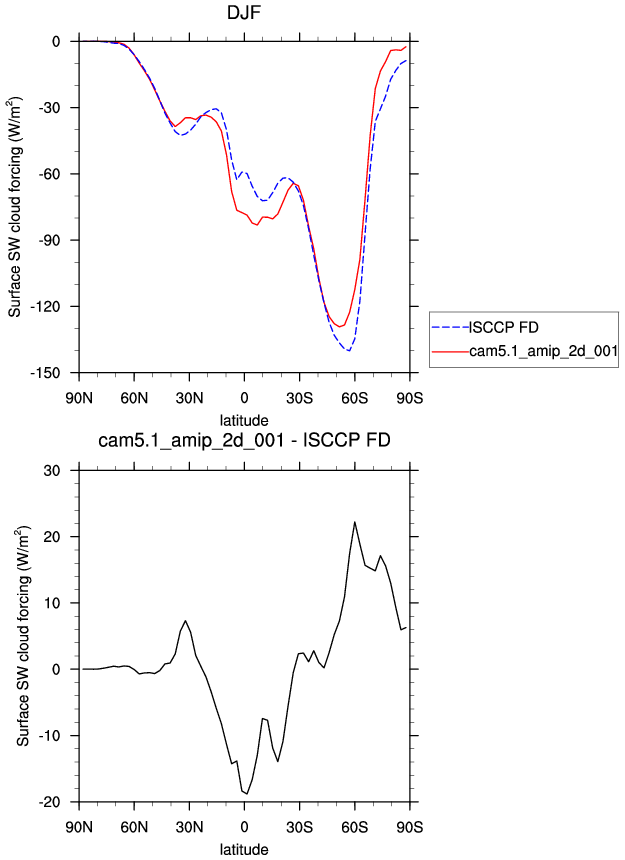
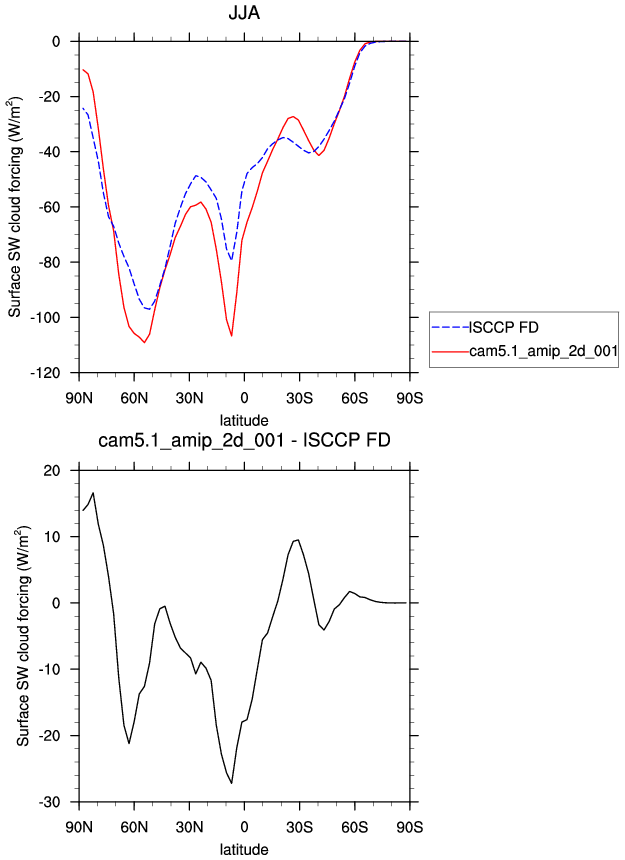
| ISCCP FD Jul1983-Dec2000 | DJF | JJA | ANN | |
| FLDS | Surf LW downwelling flux | plot | plot | plot |
| FLDSC | Clearsky Surf LW downwelling flux | plot | plot | plot |
| FLNS | Surf Net LW flux | plot | plot | plot |
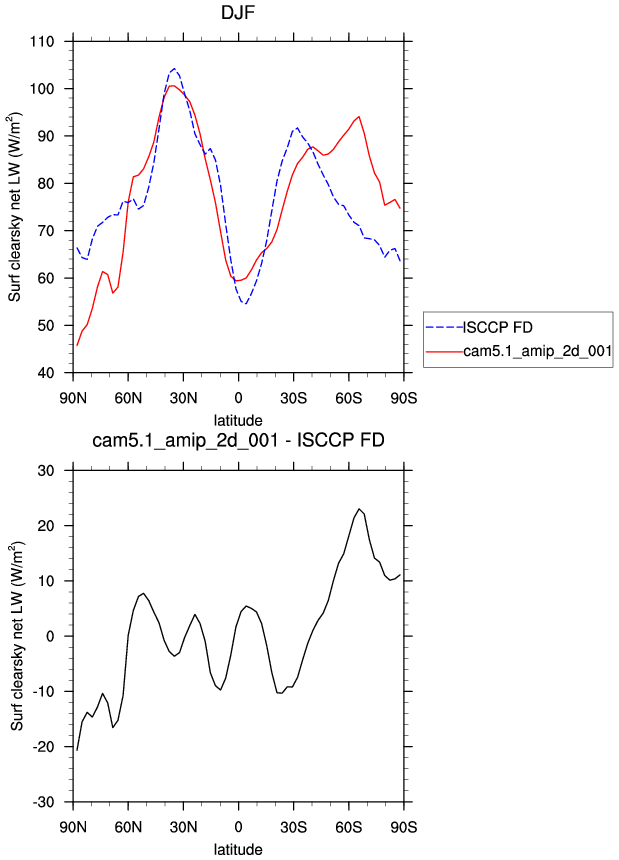
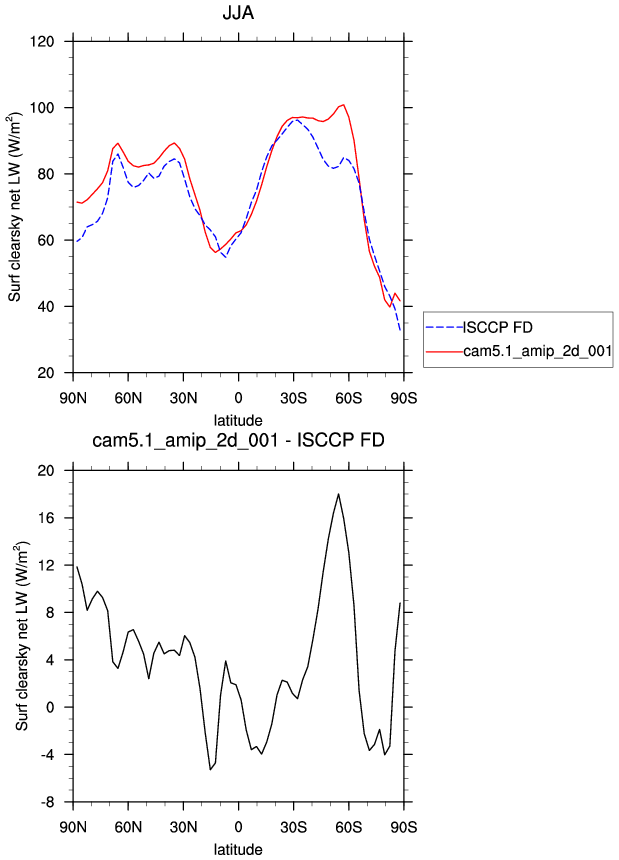
| FLNSC | Clearsky Surf Net LW flux | plot | plot | plot |
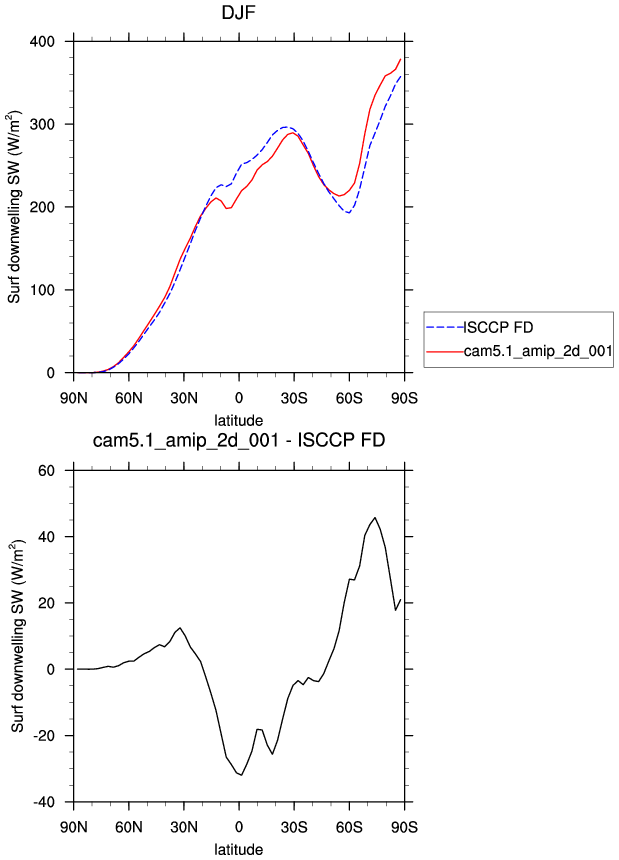
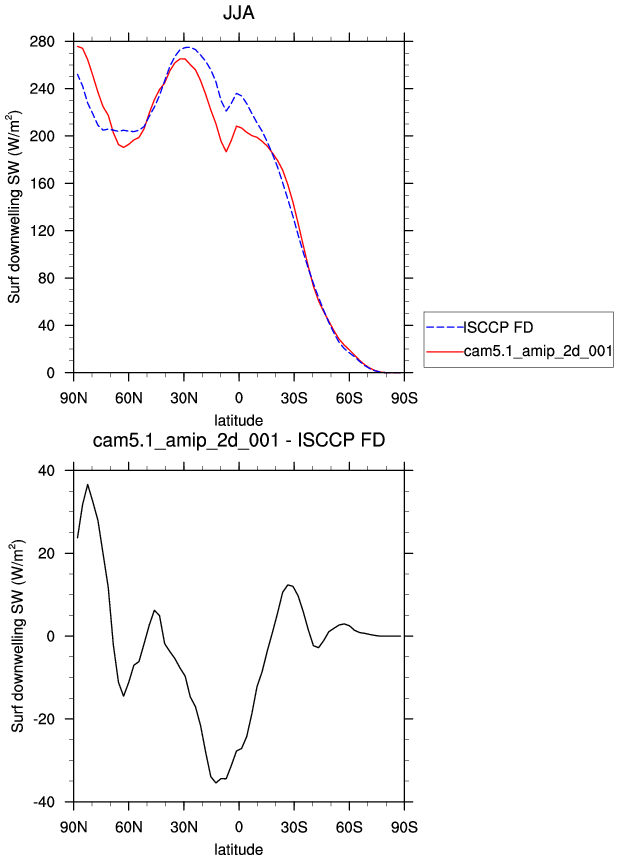
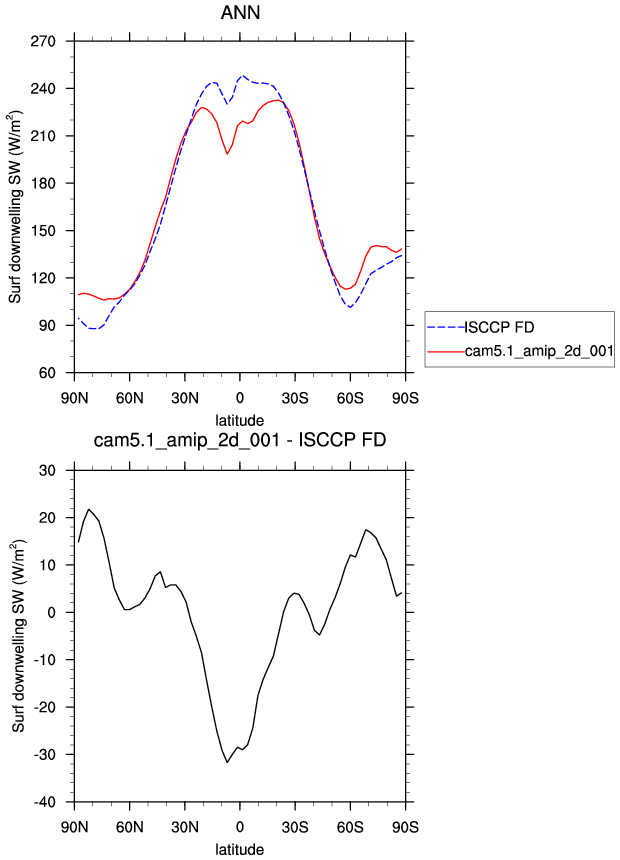
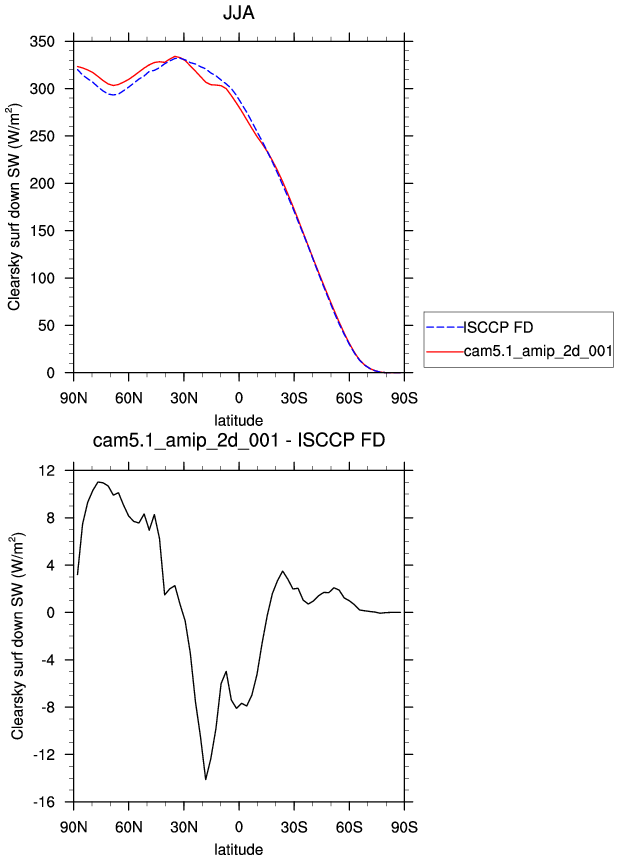
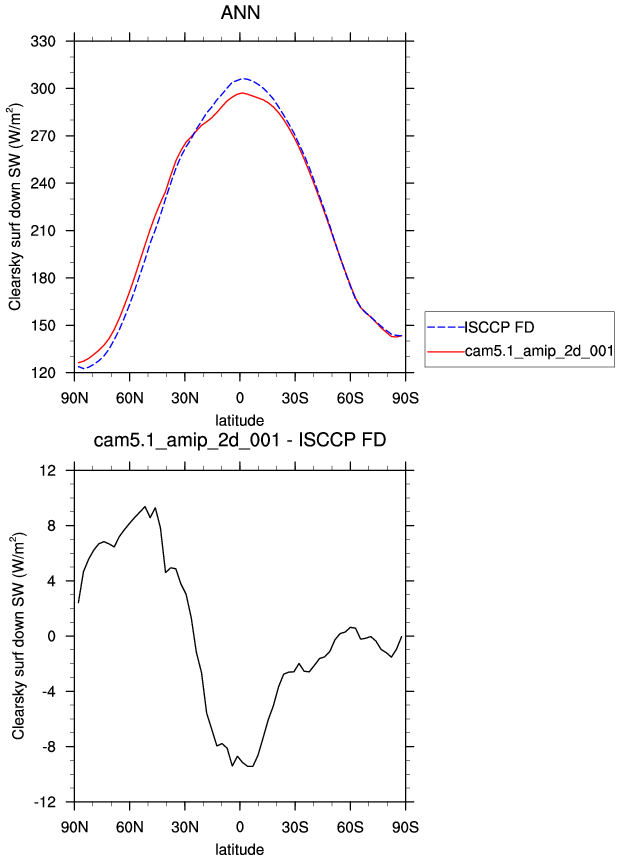
| FSDS | Surf SW downwelling flux | plot | plot | plot |
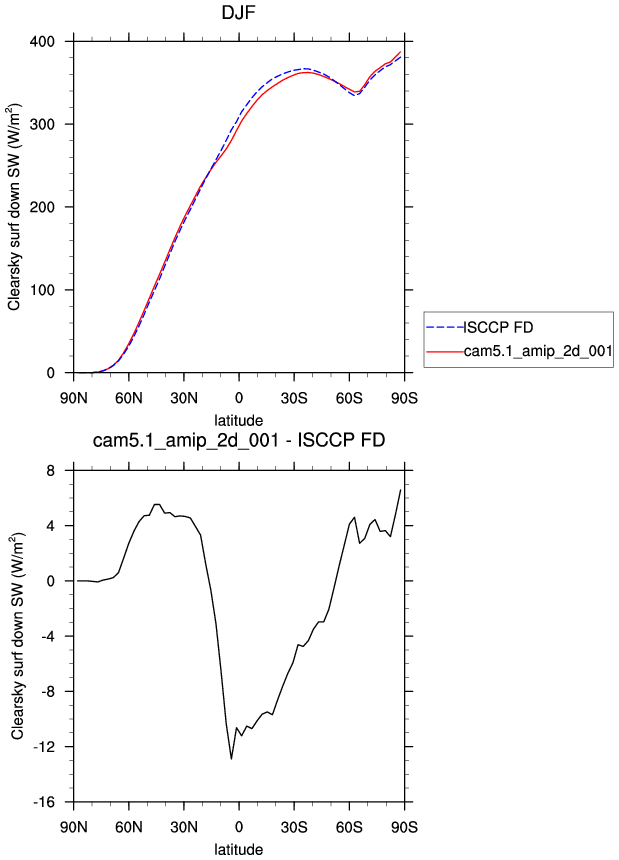
| FSDSC | Clearsky Surf SW downwelling flux | plot | plot | plot |
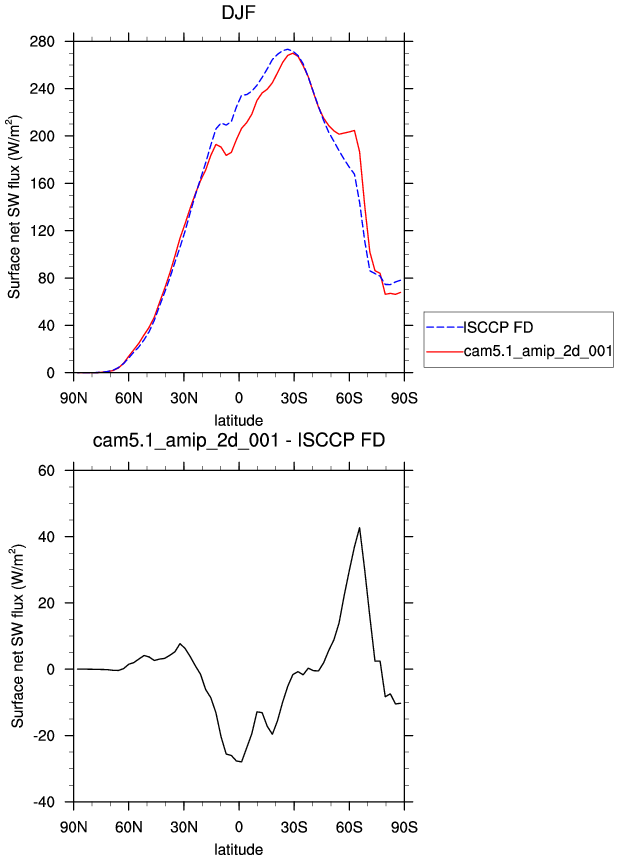
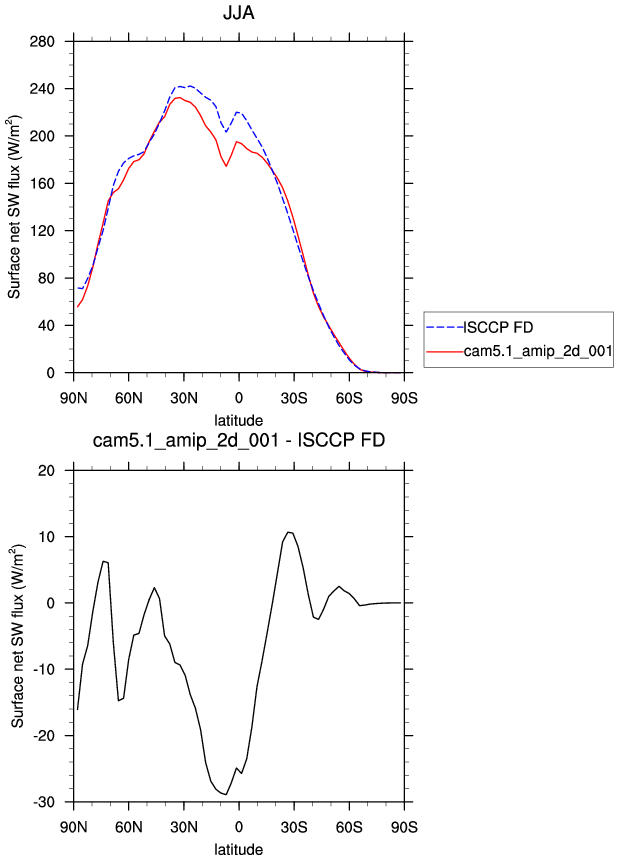
| FSNS | Surf Net SW flux | plot | plot | plot |
| FSNSC | Clearsky Surf Net SW flux | plot | plot | plot |
| LWCFSRF | Surf LW cloud forcing | plot | plot | plot |
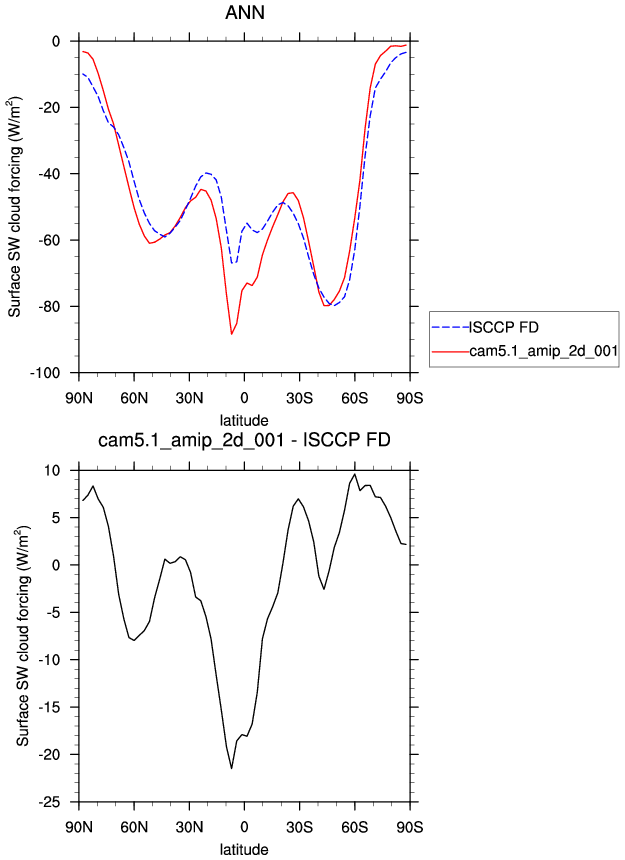
| SWCFSRF | Surf SW cloud forcing | plot | plot | plot |
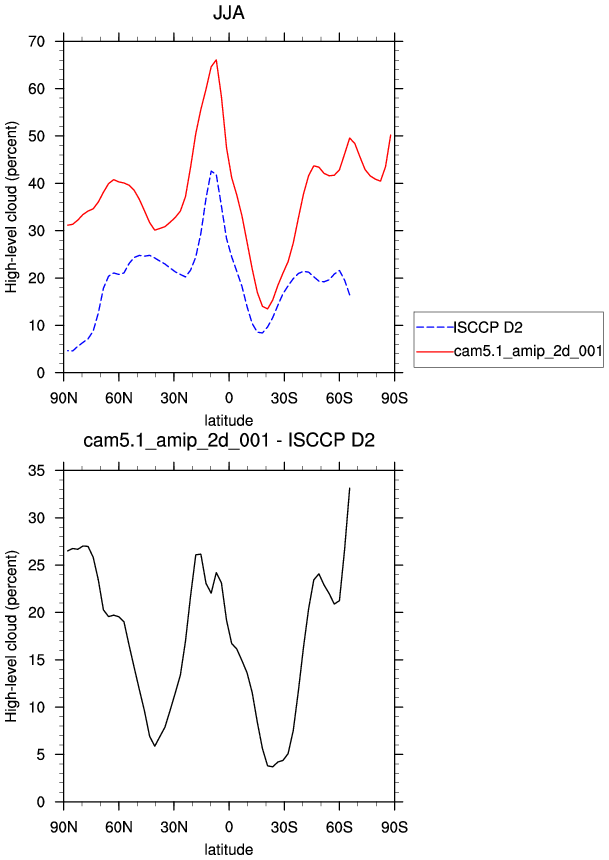
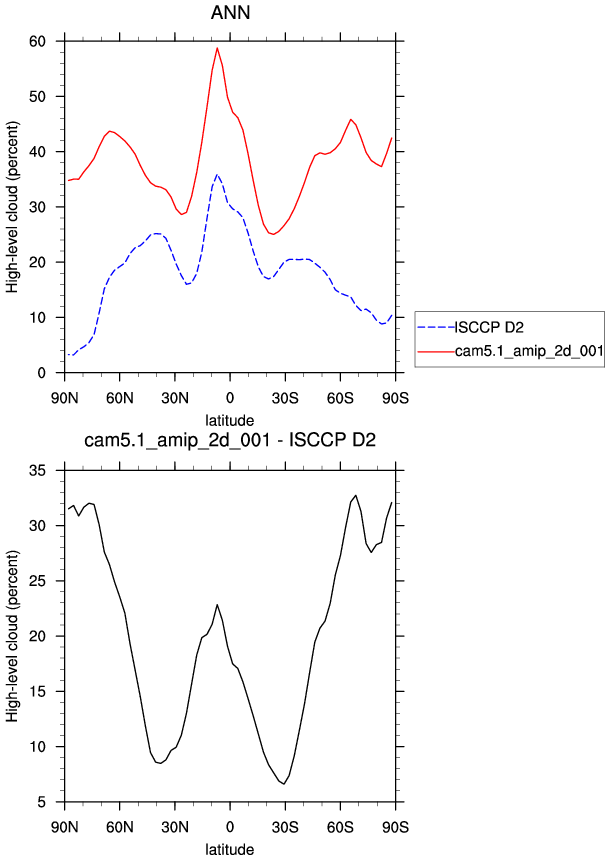
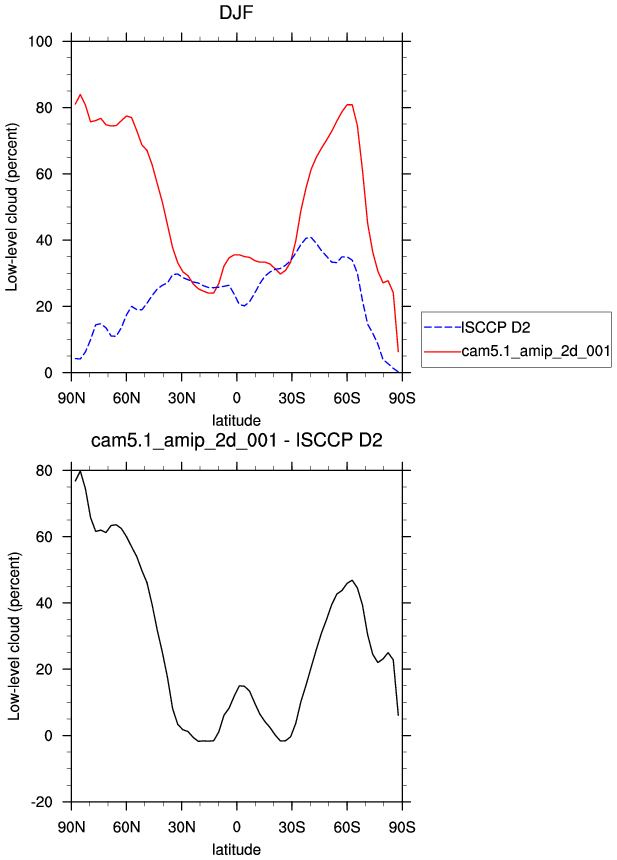
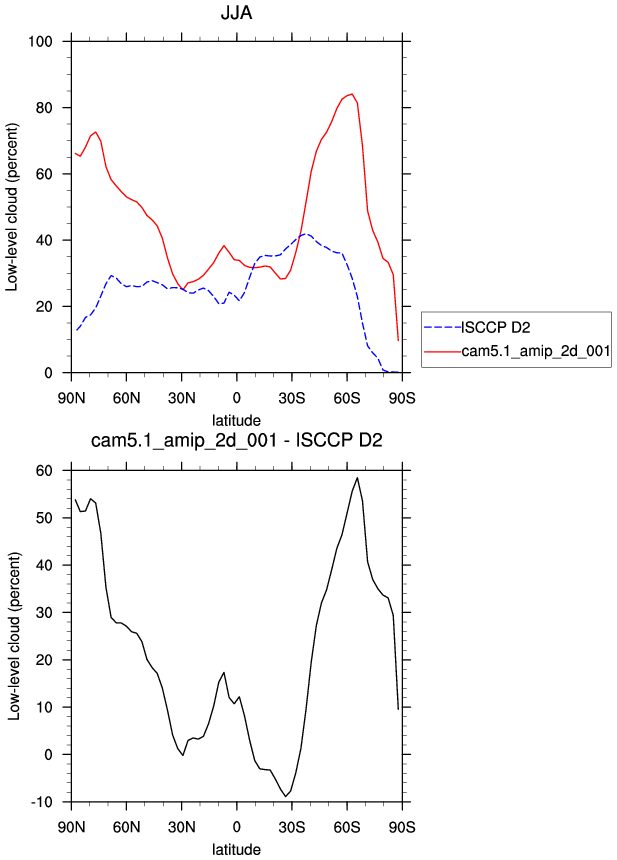
| ISCCP D2 1983-2001 | DJF | JJA | ANN | |
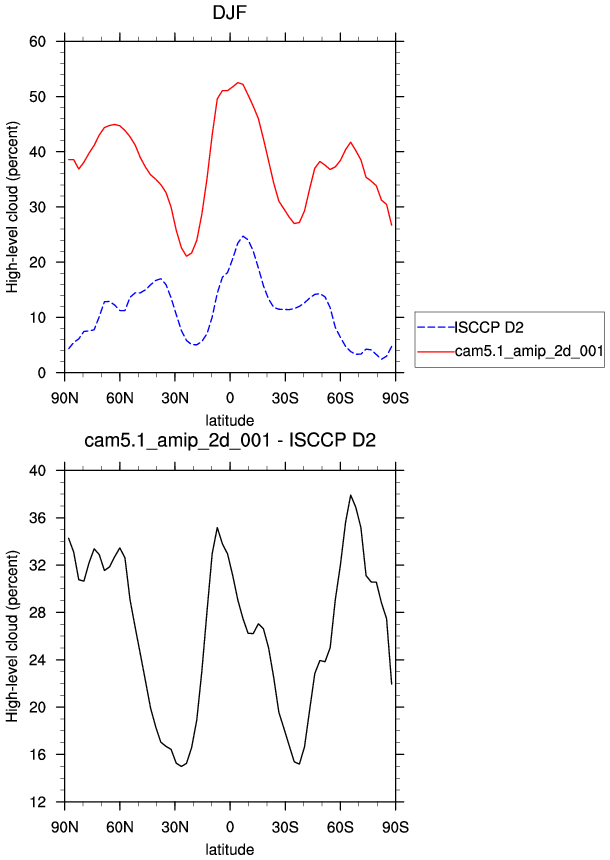
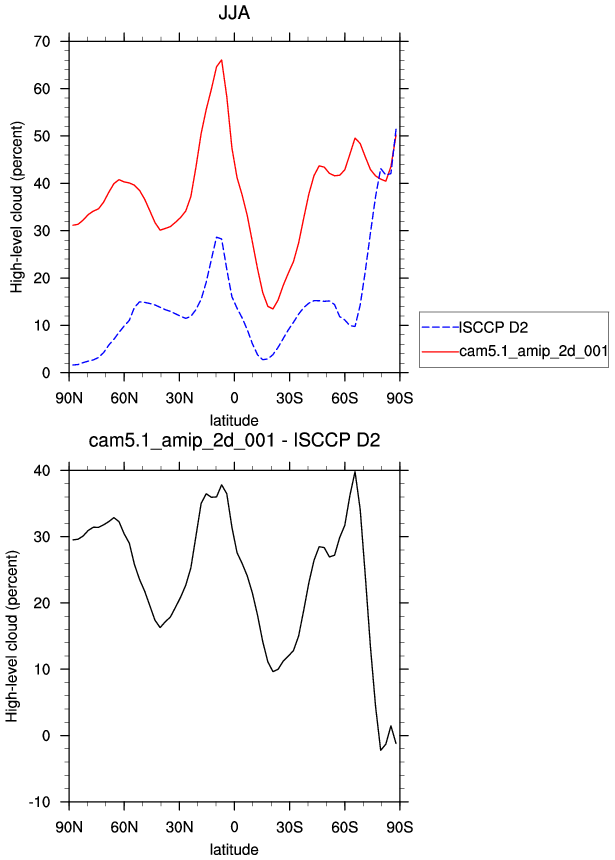
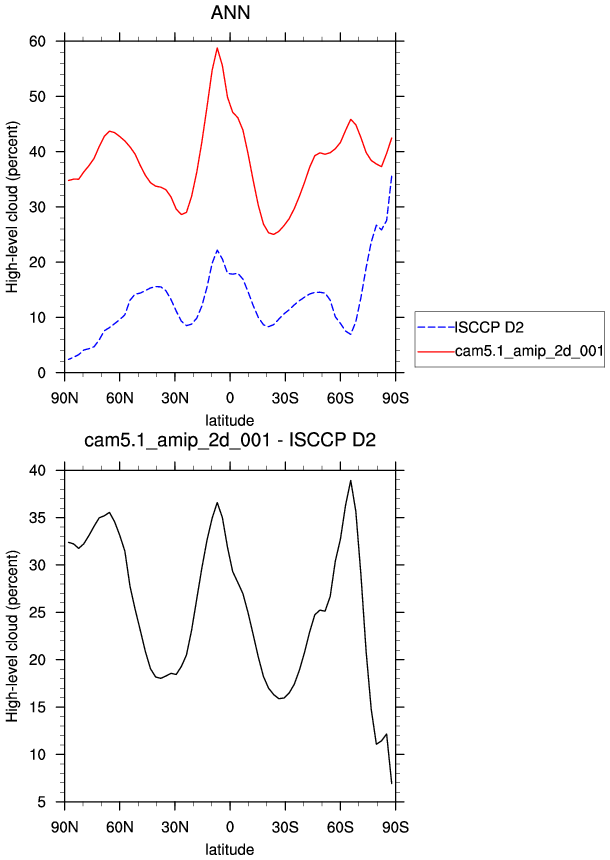
| CLDHGH (IR clouds) | High cloud amount | plot | plot | plot |
| CLDHGH (VIS/IR/NIR clouds) | High cloud amount | plot | plot | plot |
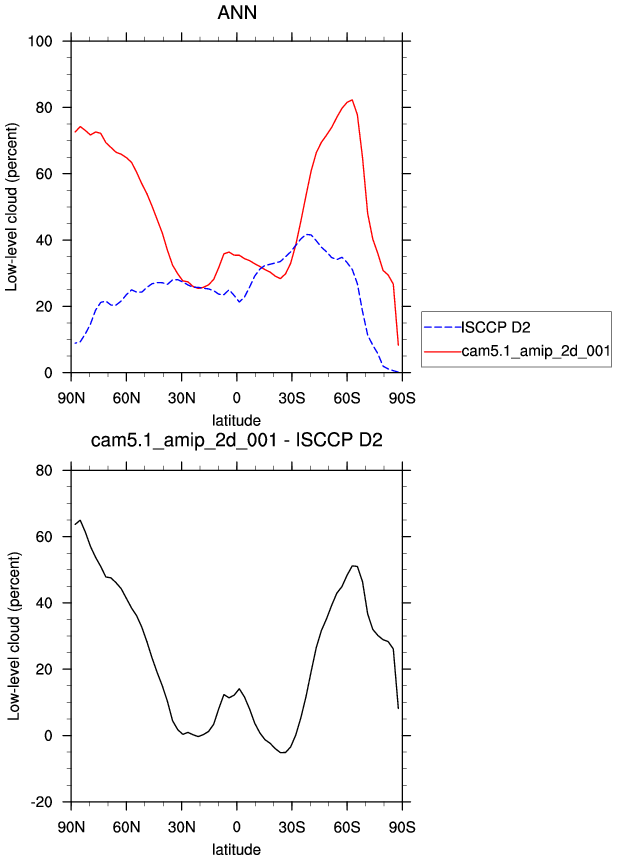
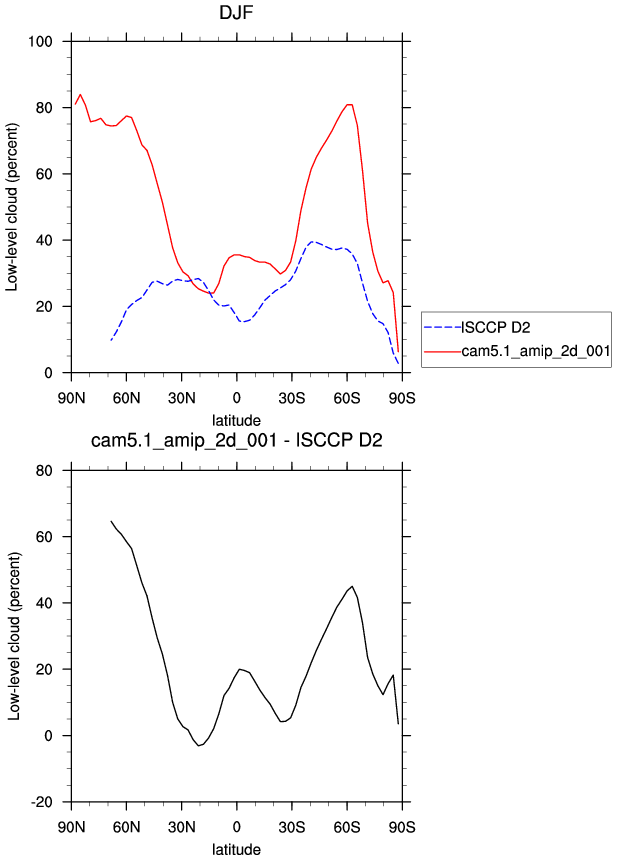
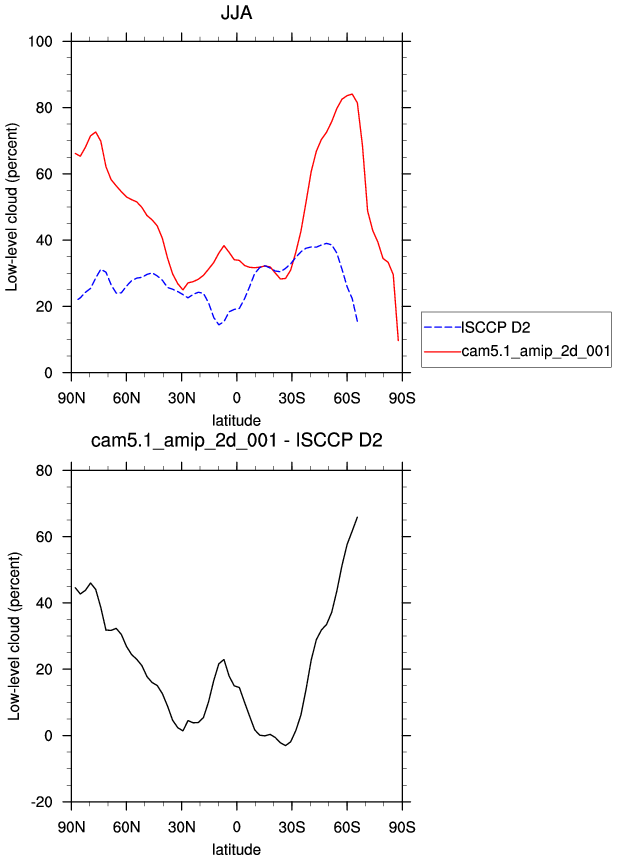
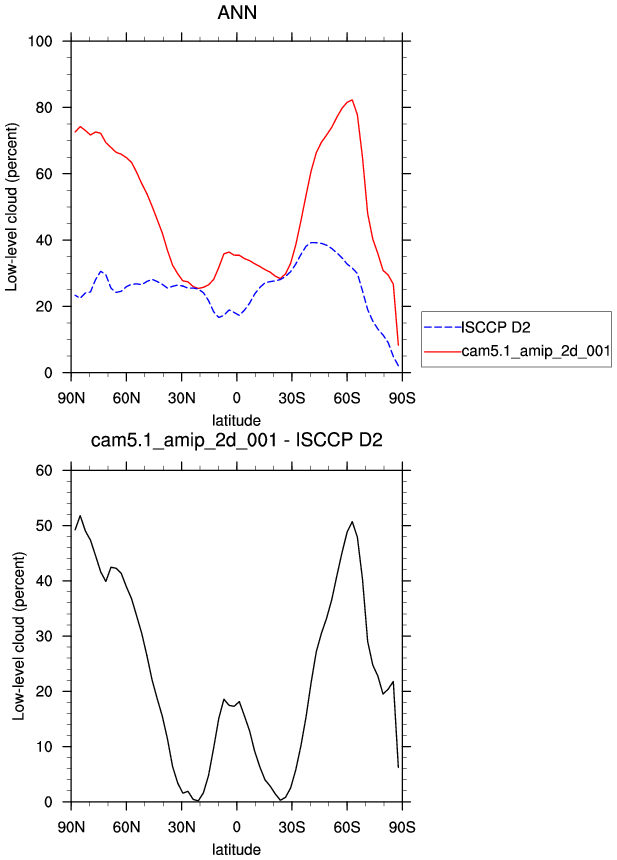
| CLDLOW (IR clouds) | Low cloud amount | plot | plot | plot |
| CLDLOW (VIS/IR/NIR clouds) | Low cloud amount | plot | plot | plot |
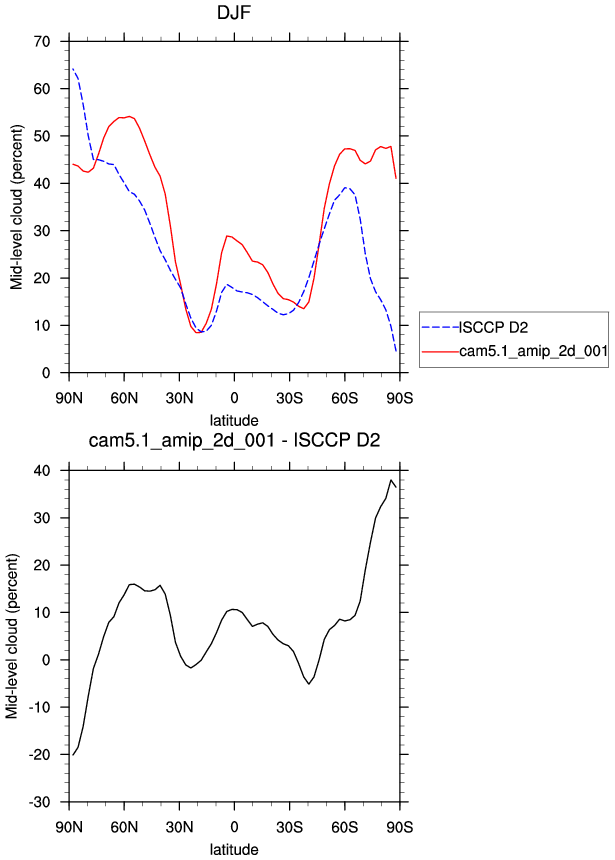
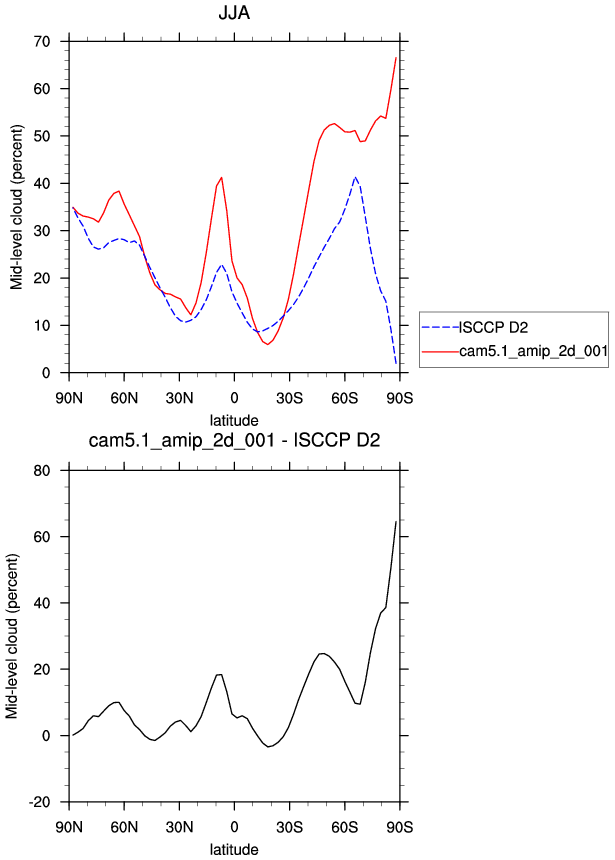
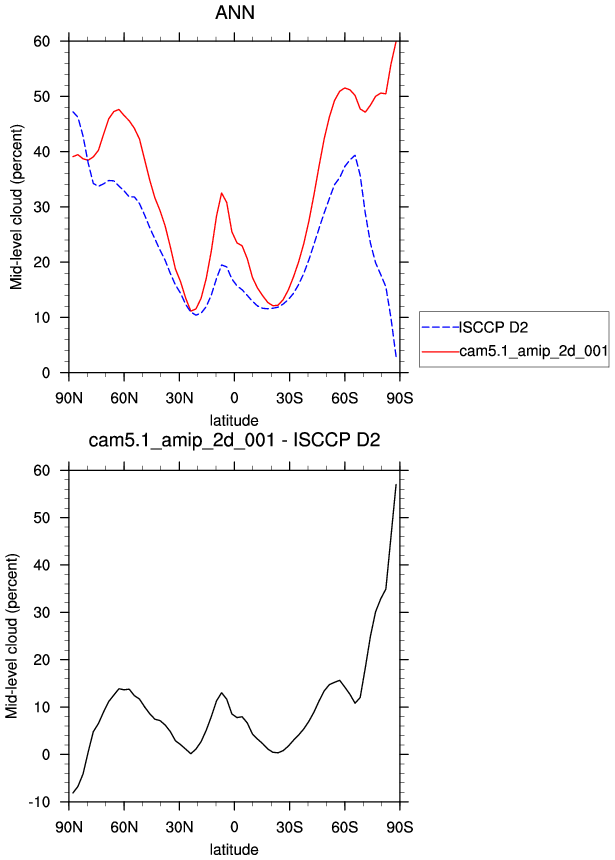
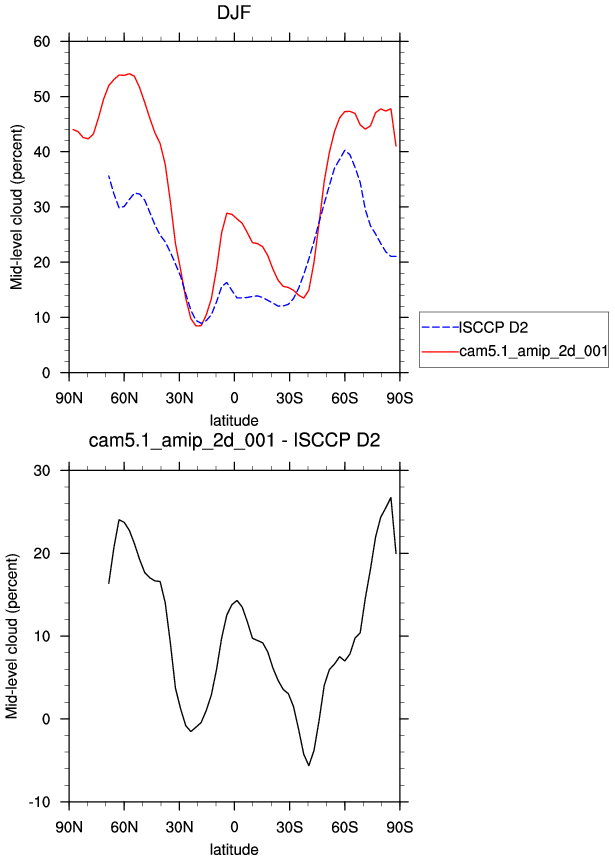
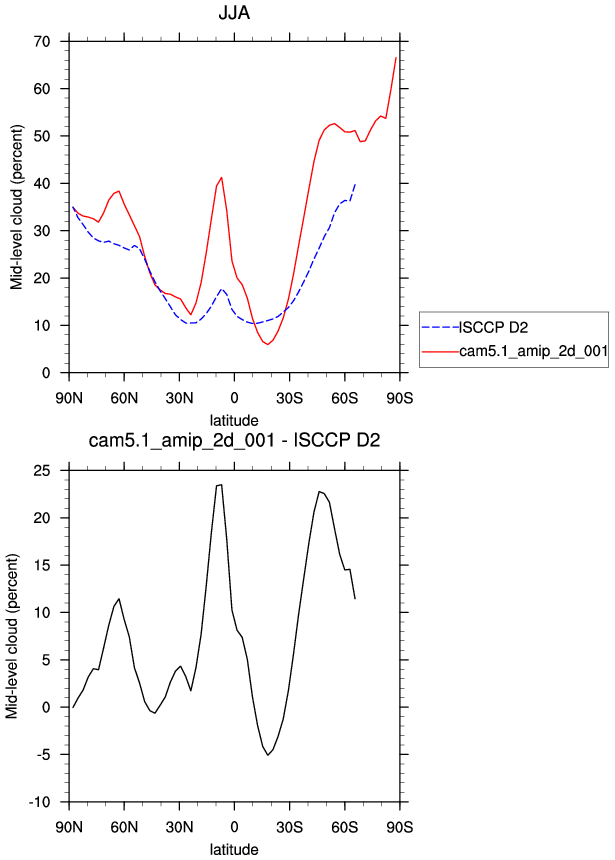
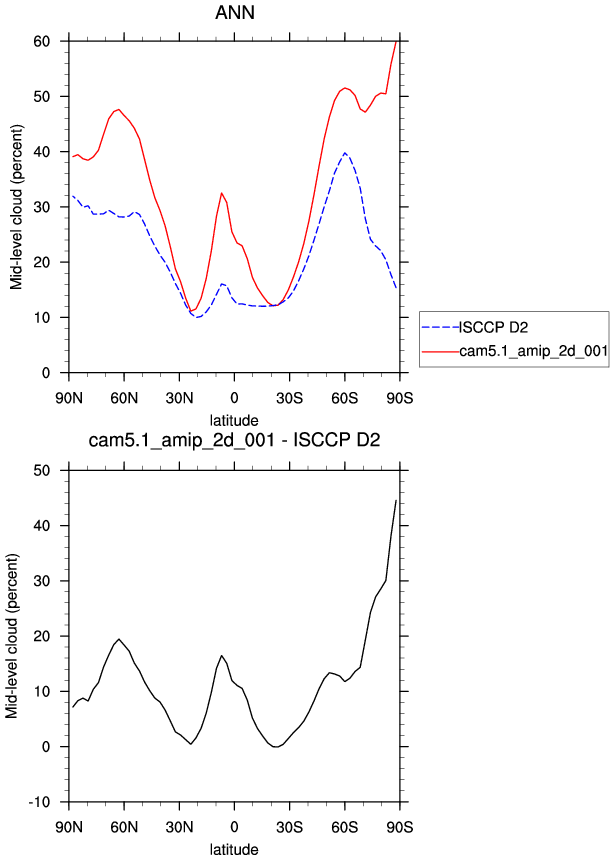
| CLDMED (IR clouds) | Mid cloud amount | plot | plot | plot |
| CLDMED (VIS/IR/NIR clouds) | Mid cloud amount | plot | plot | plot |
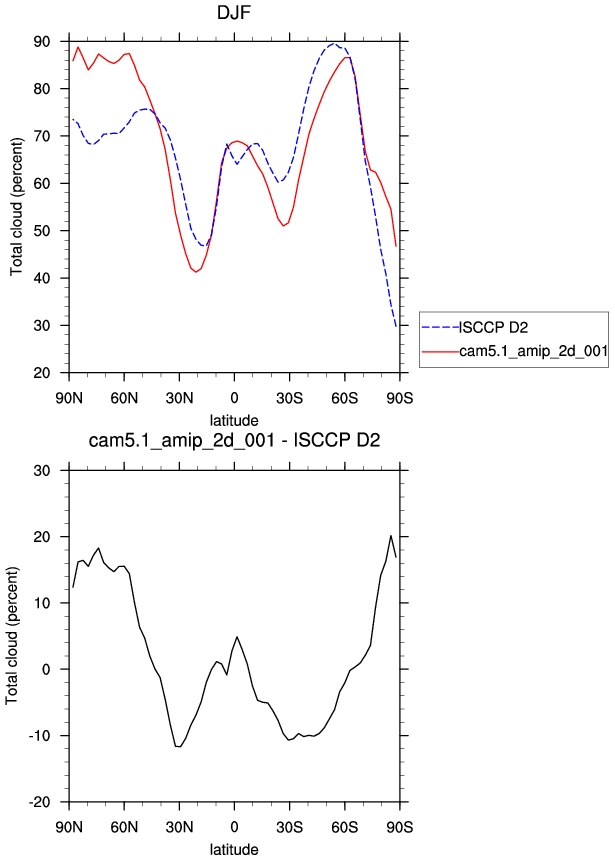
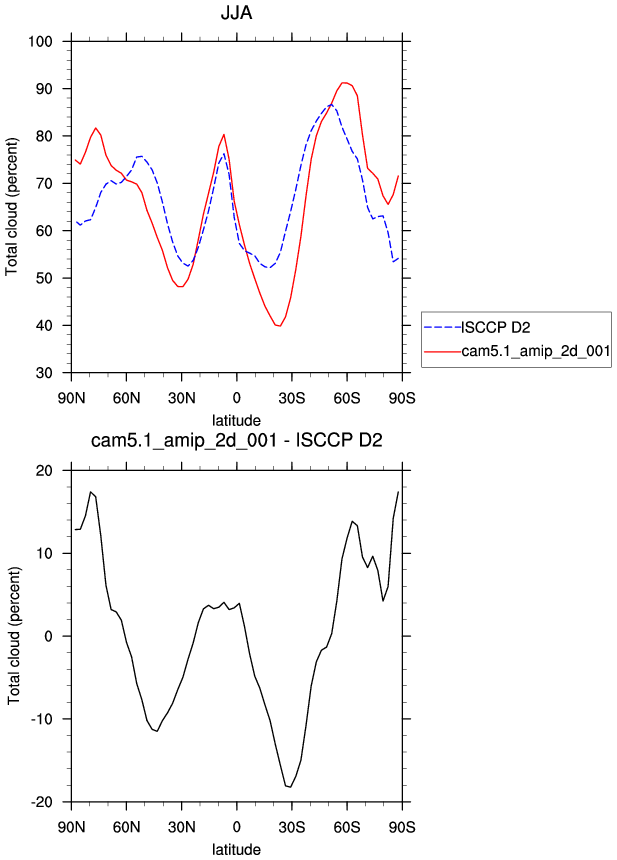
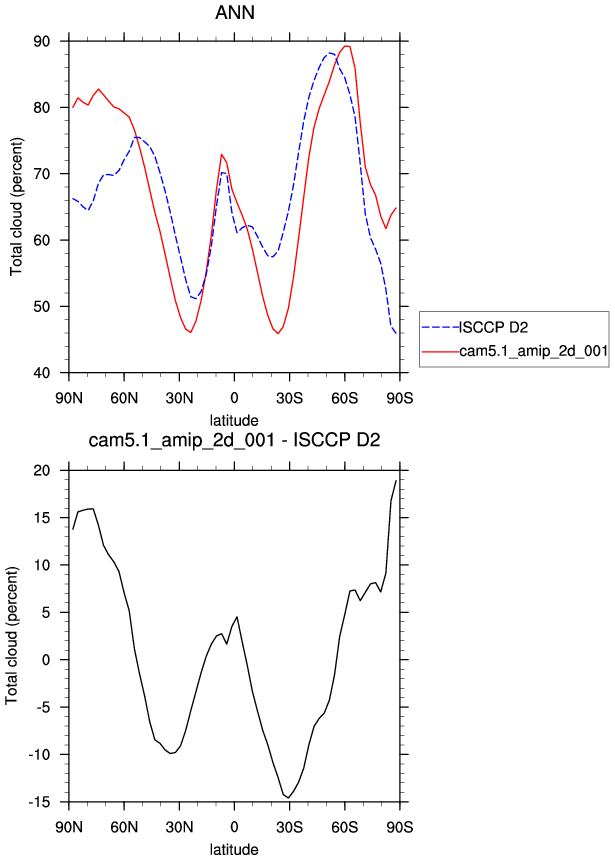
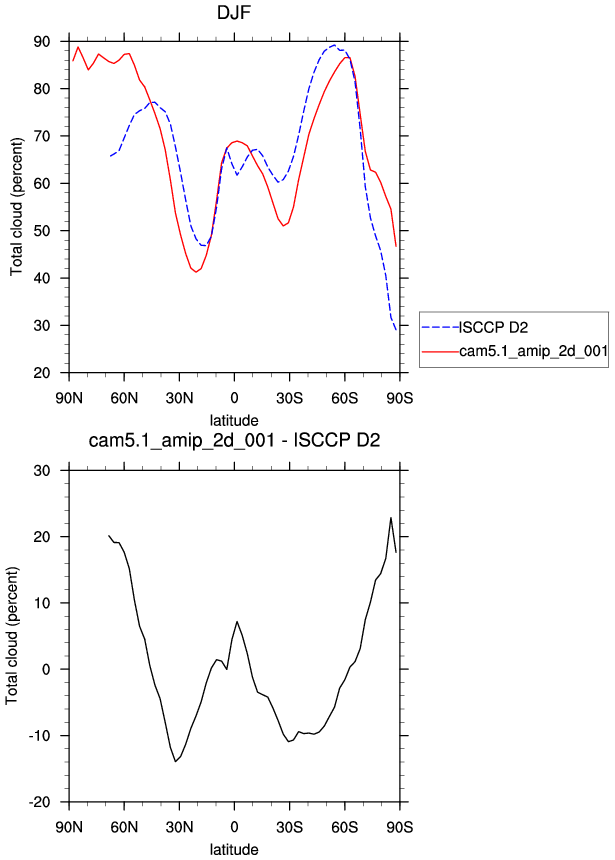
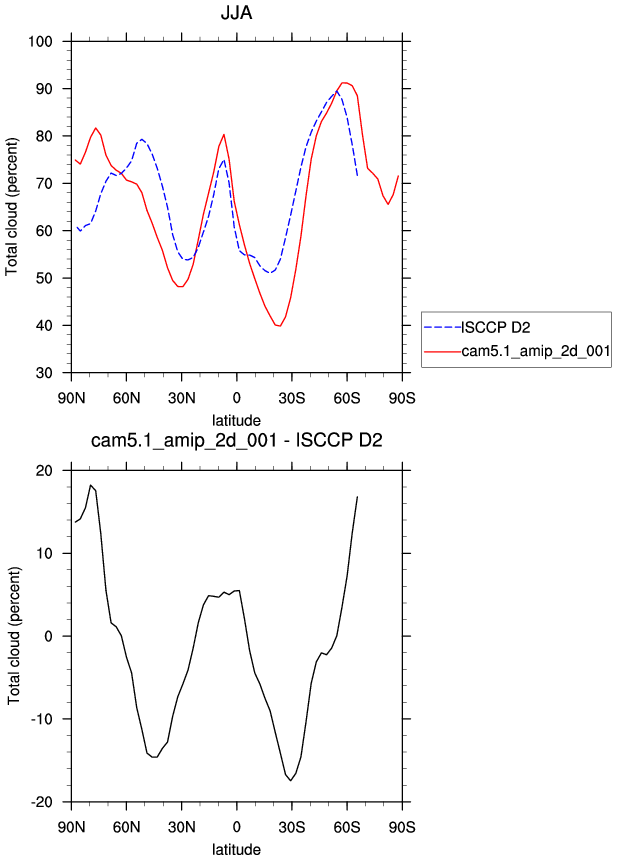
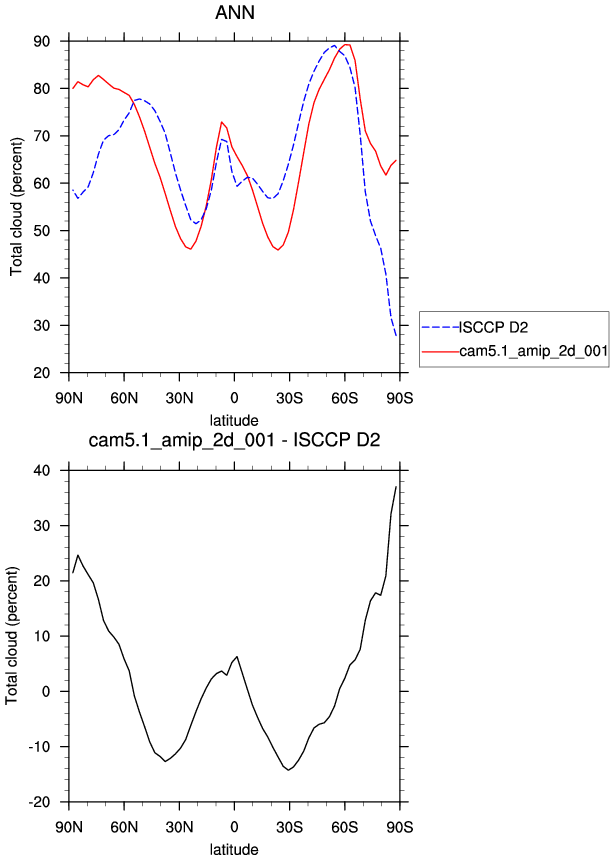
| CLDTOT (IR clouds) * | Total cloud amount | plot | plot | plot |
| CLDTOT (VIS/IR/NIR clouds) * | Total cloud amount | plot | plot | plot |
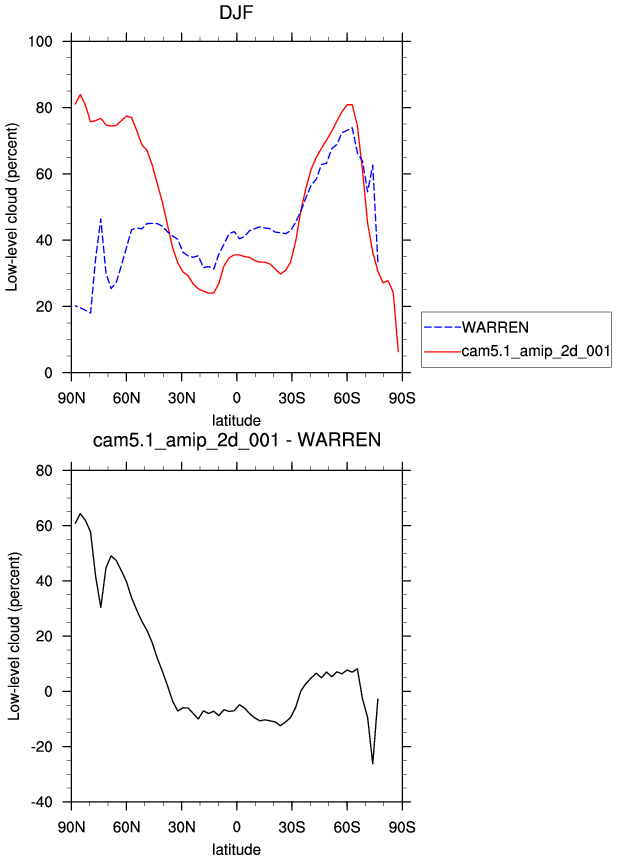
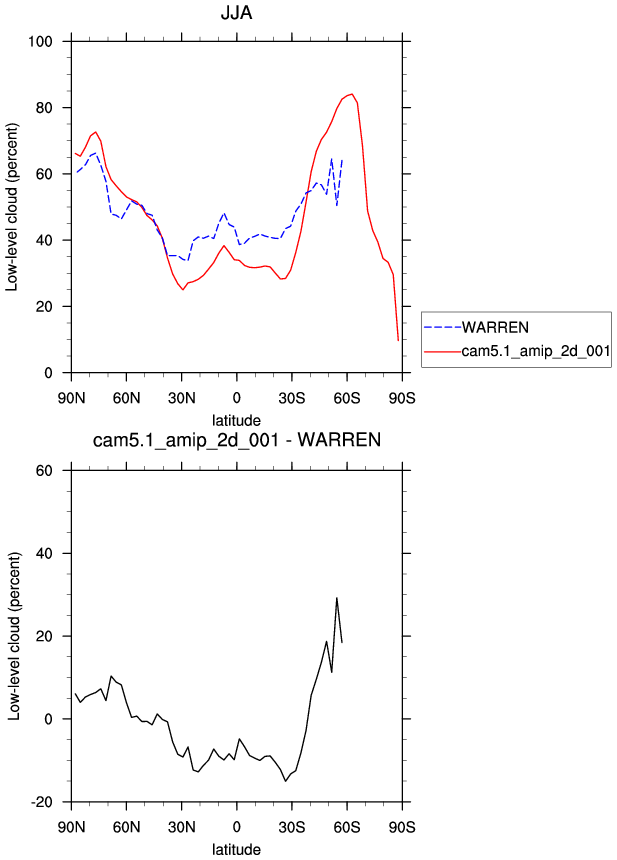
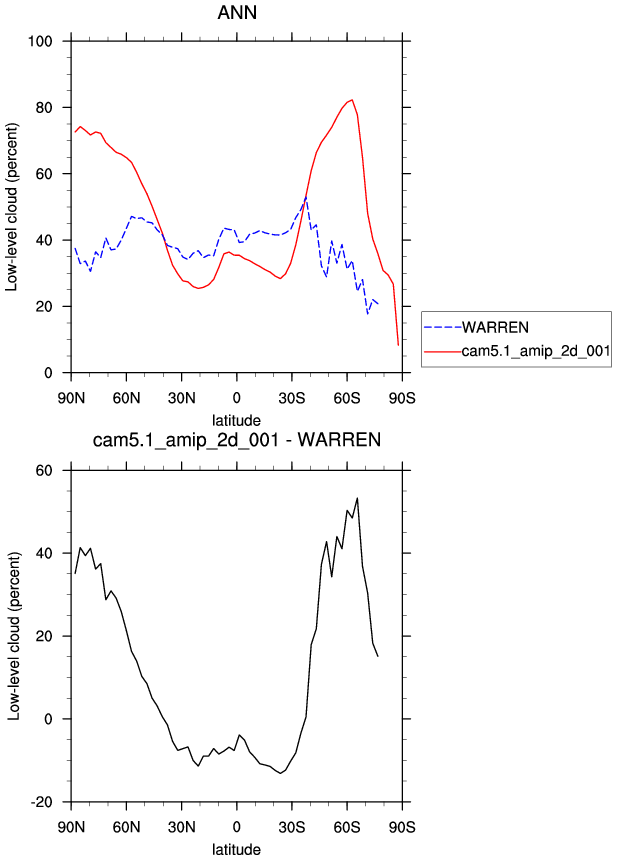
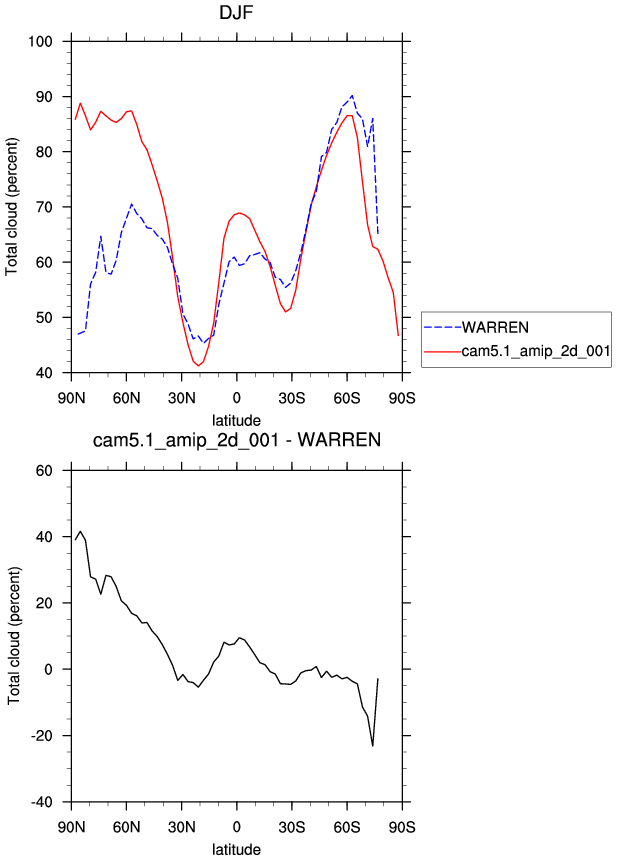
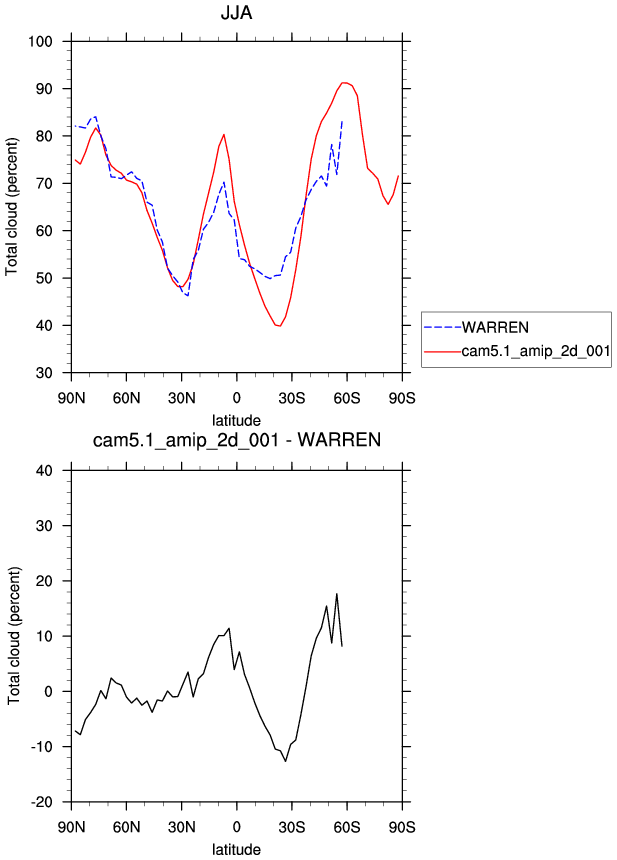
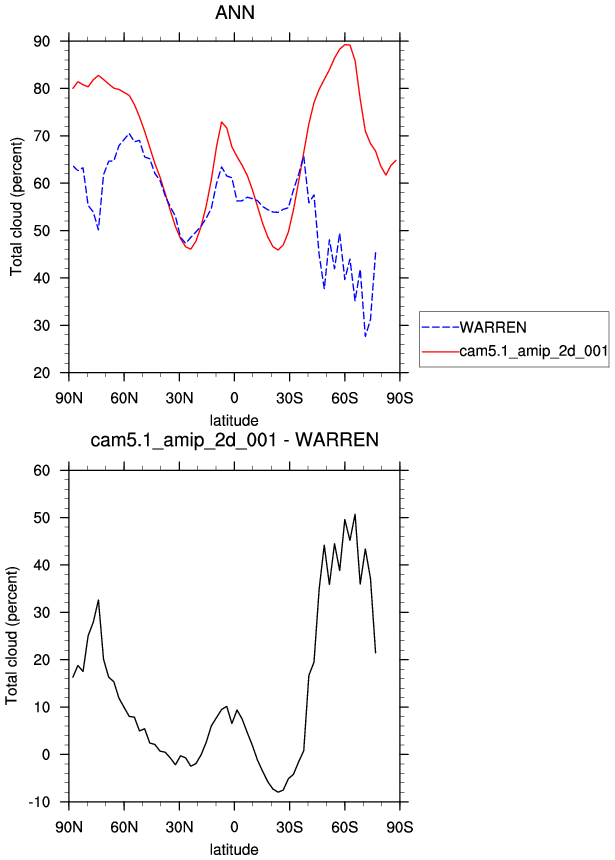
| Warren Cloud Surface OBS | DJF | JJA | ANN | |
| CLDLOW | Low cloud amount | plot | plot | plot |
| CLDTOT * | Total cloud amount | plot | plot | plot |
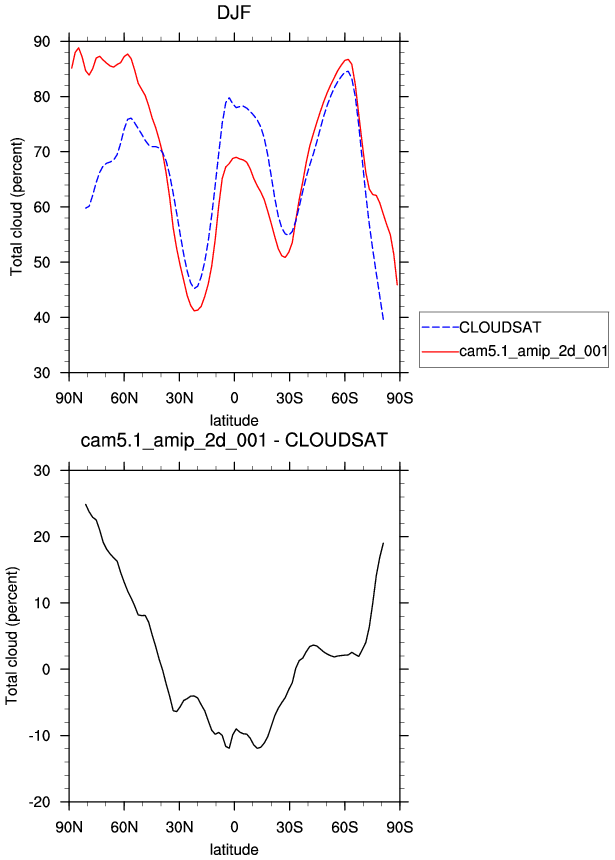
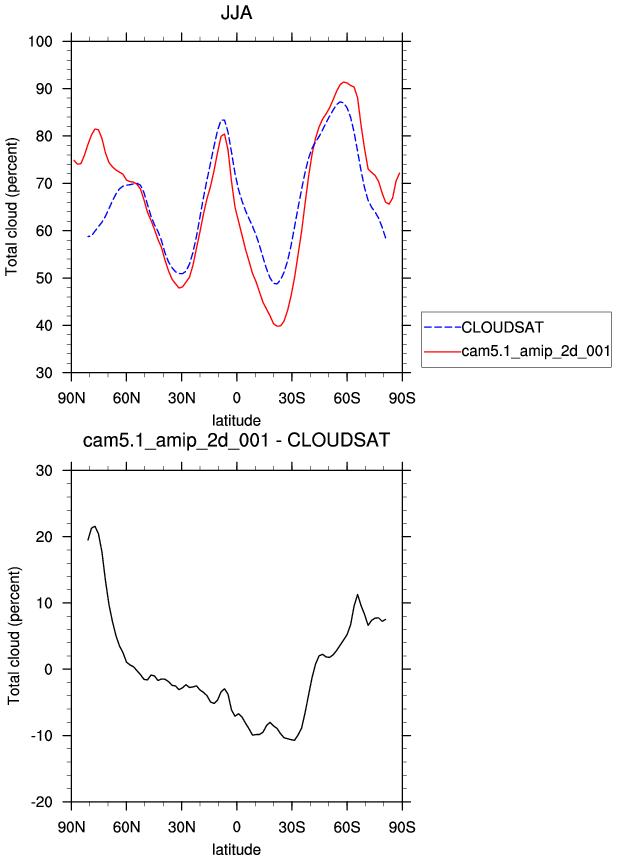
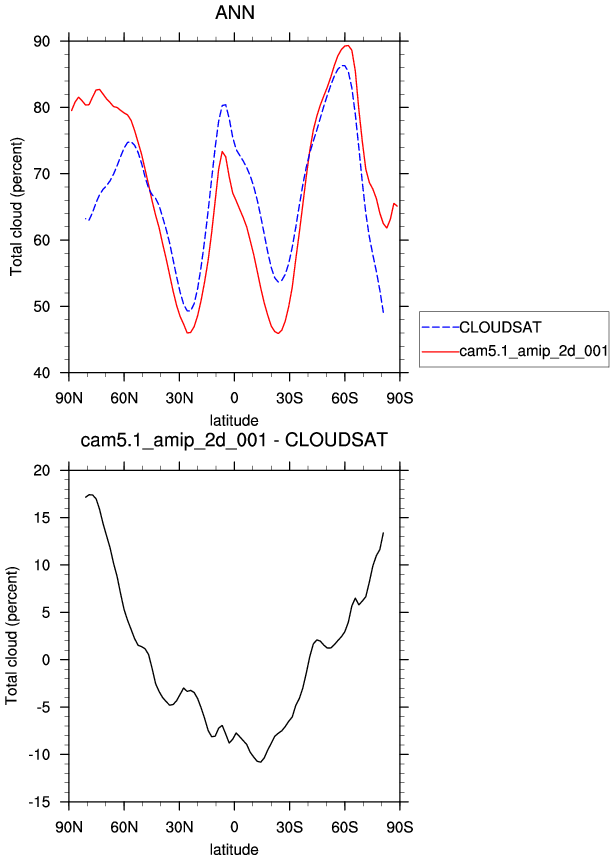
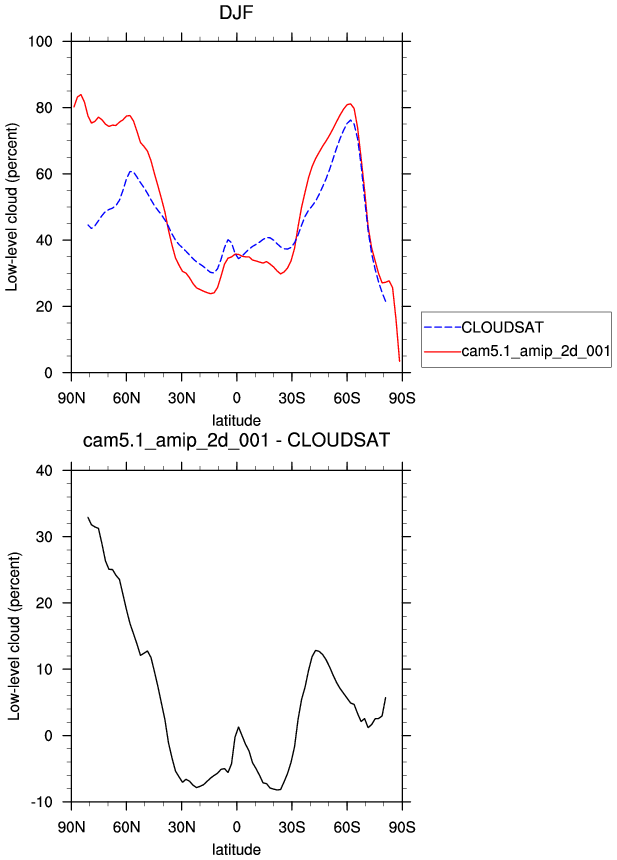
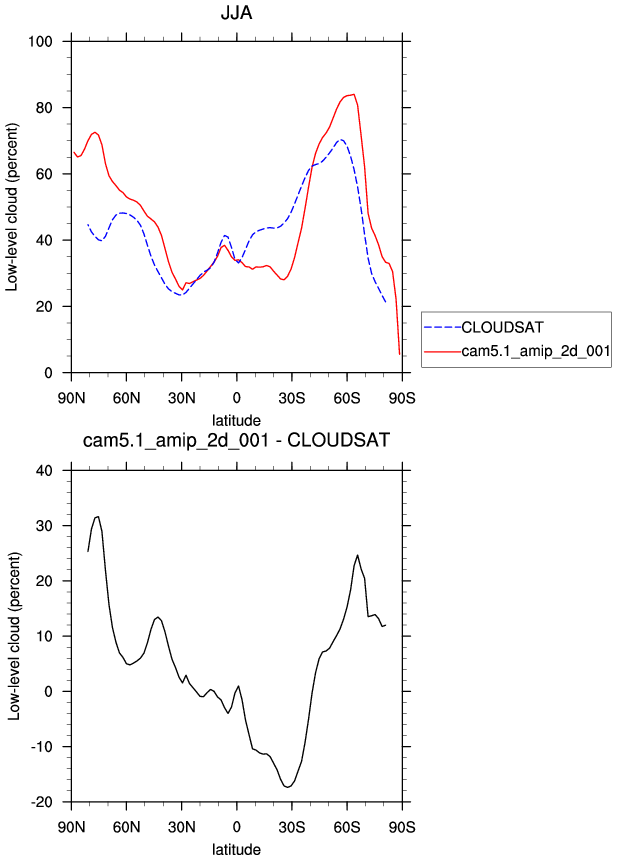
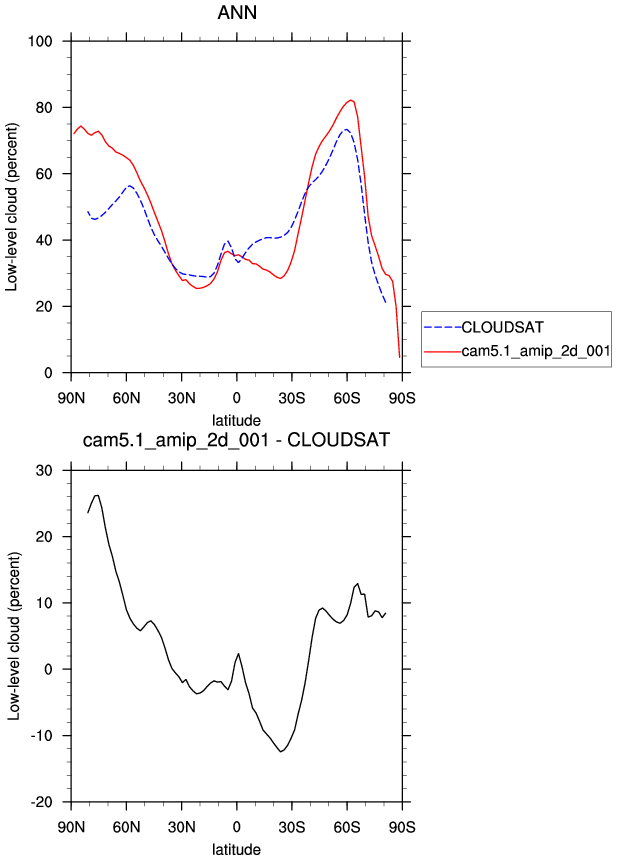
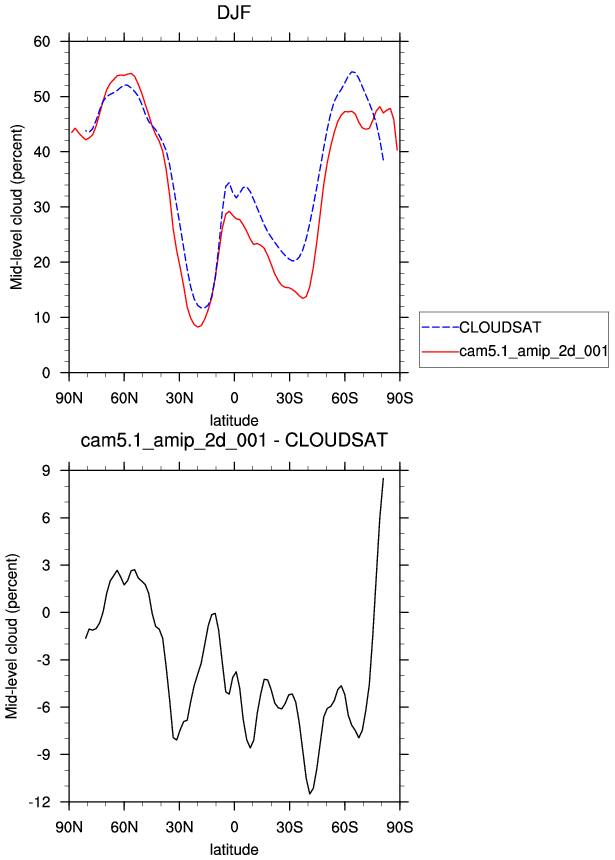
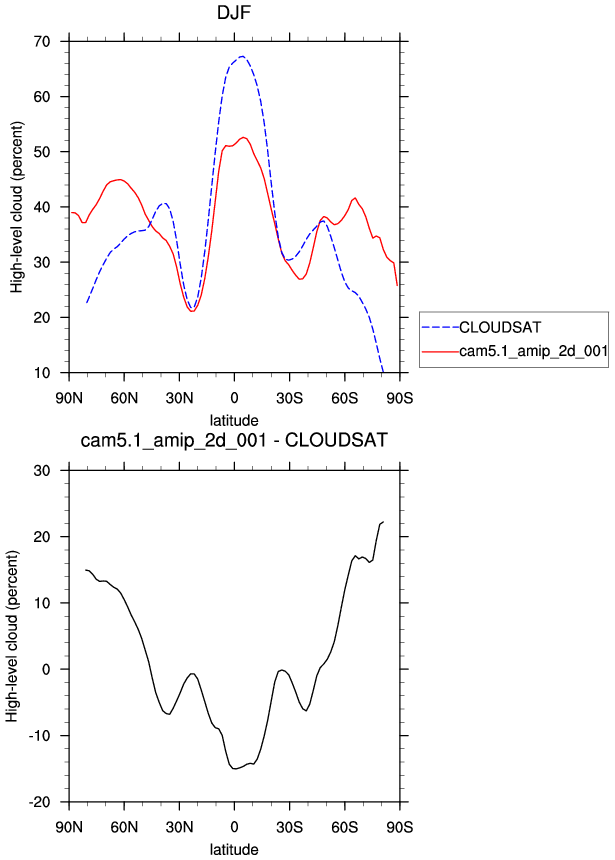
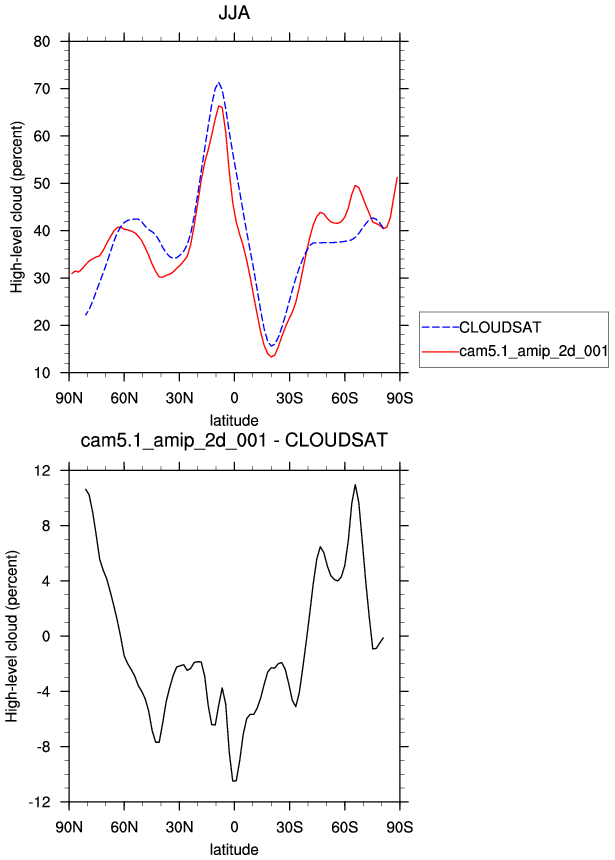
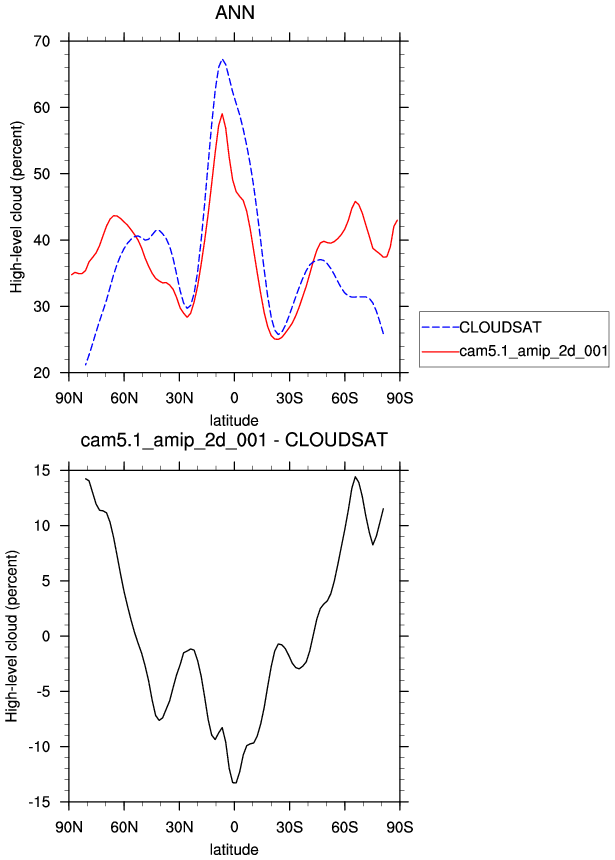
| CLOUDSAT (Radar+Lidar) Sep2006-Dec2010 | DJF | JJA | ANN | |
| CLDTOT * | Total cloud amount | plot | plot | plot |
| CLDLOW | Low cloud amount | plot | plot | plot |
| CLDMED | Medium cloud amount | plot | plot | plot |
| CLDHGH | High cloud amount | plot | plot | plot |