
AMWG Variability Diagnostics for Daily Data
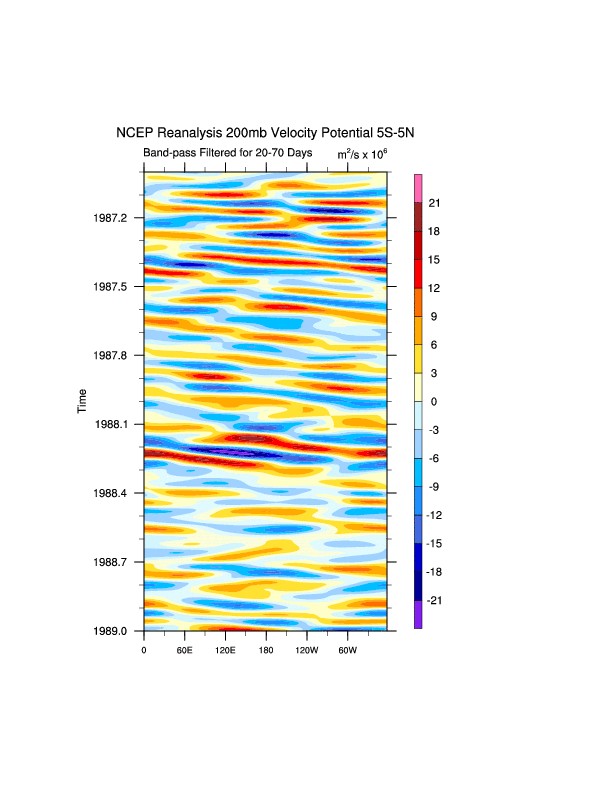
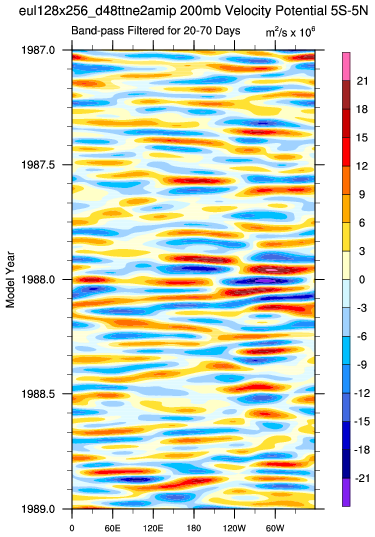
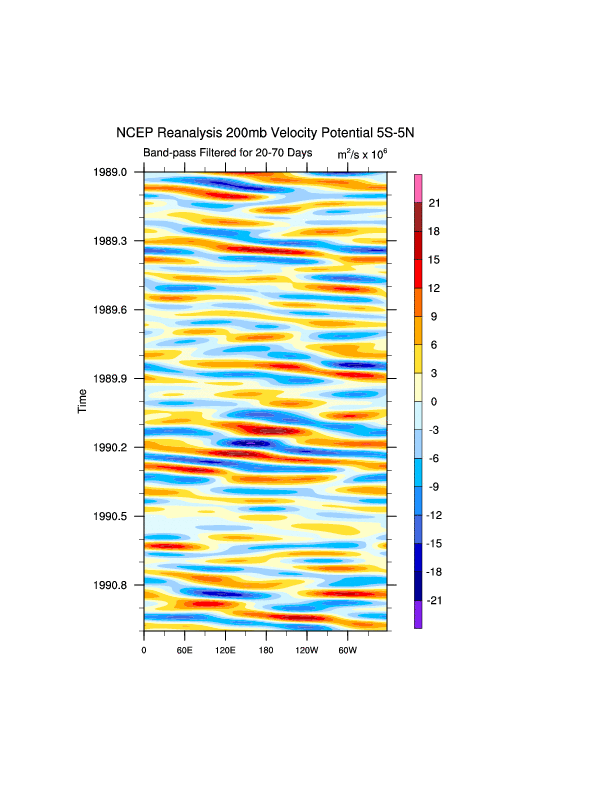
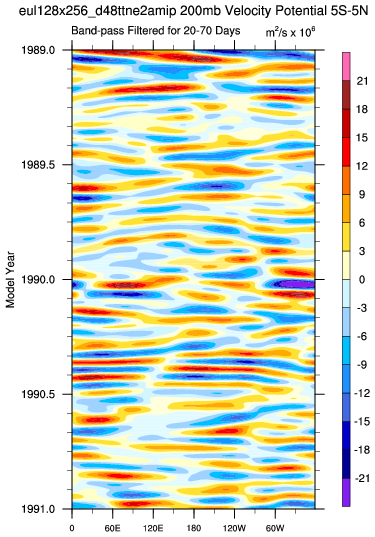
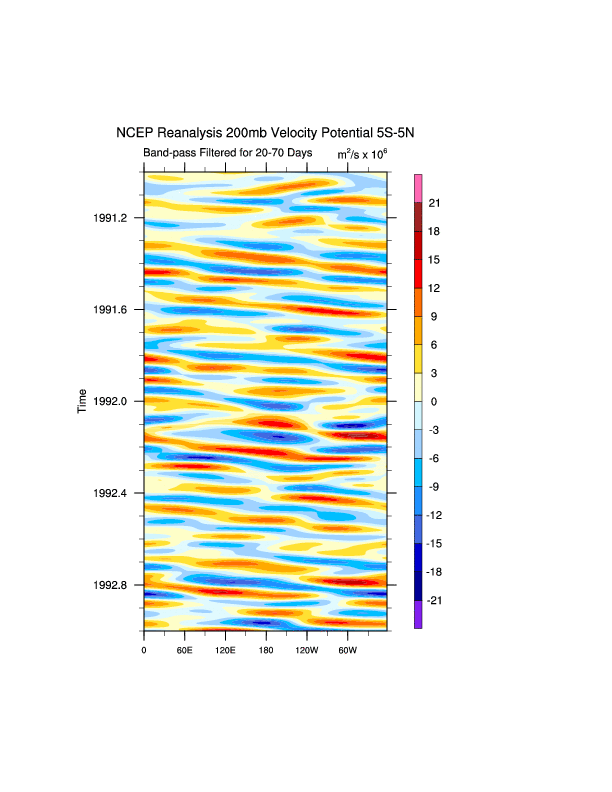
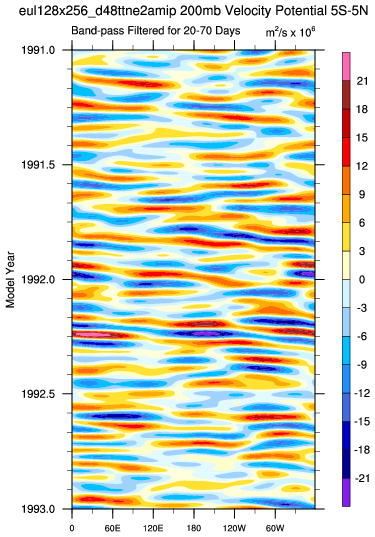
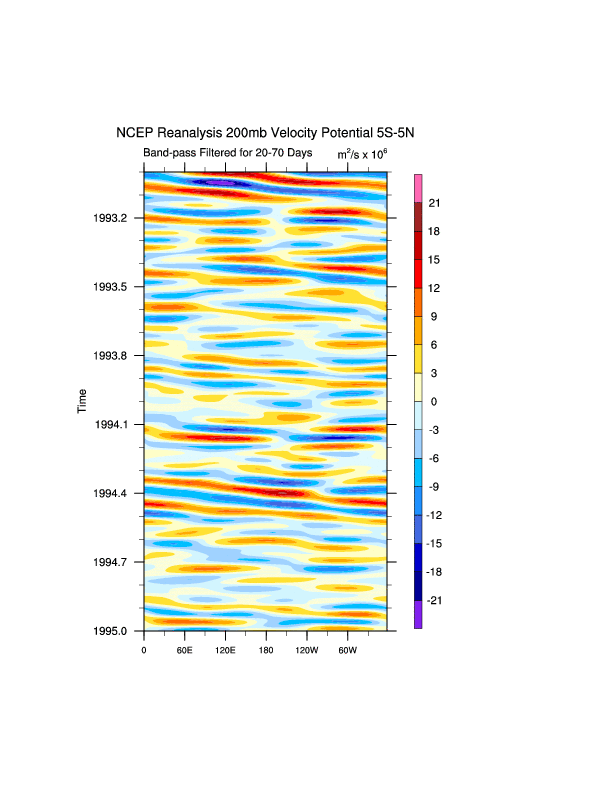
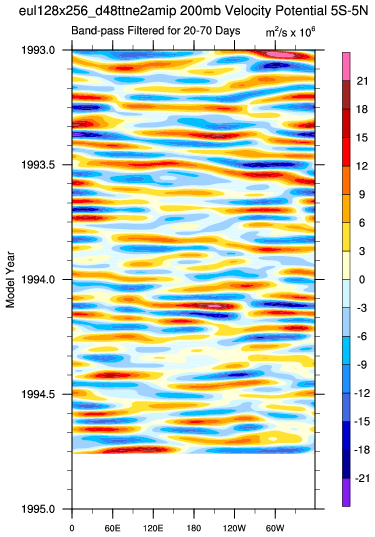
Intraseasonal Variability
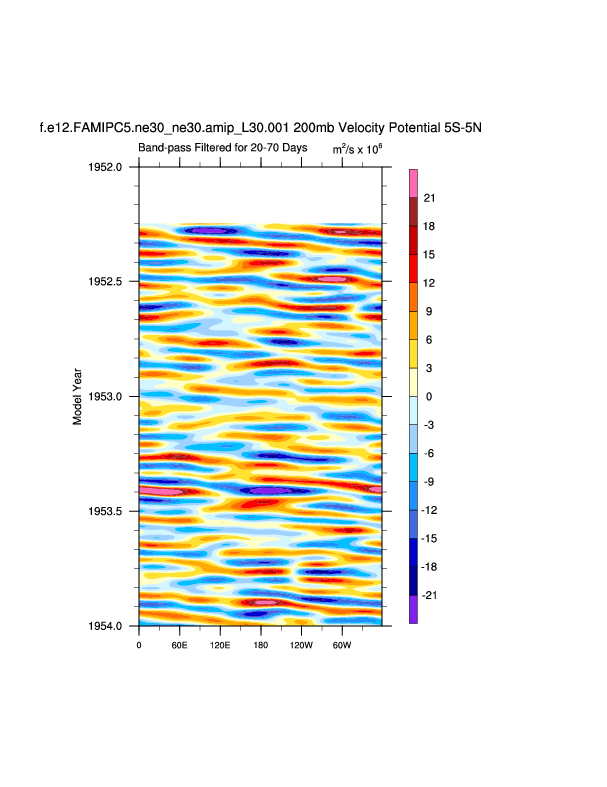
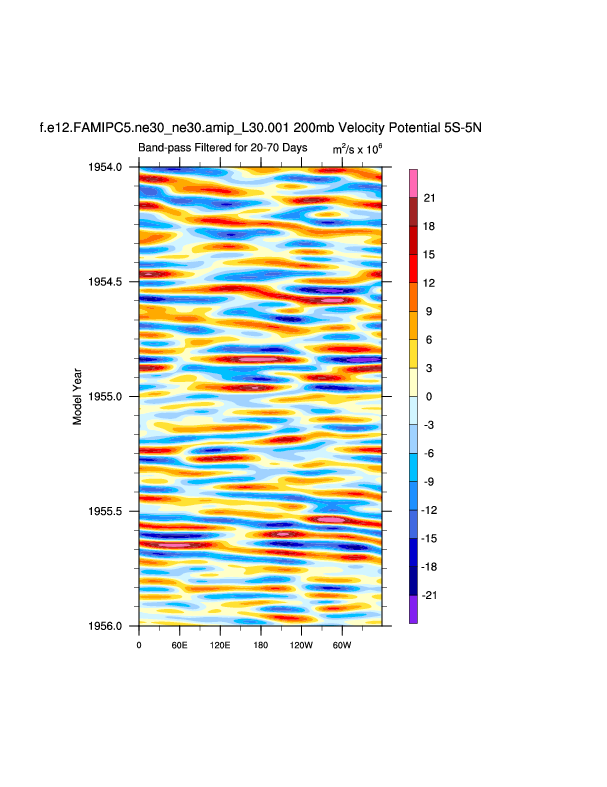
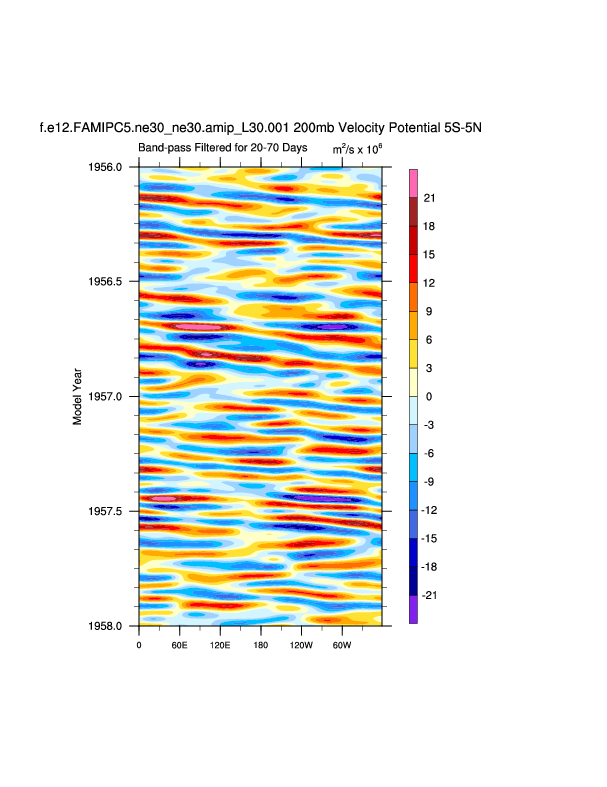
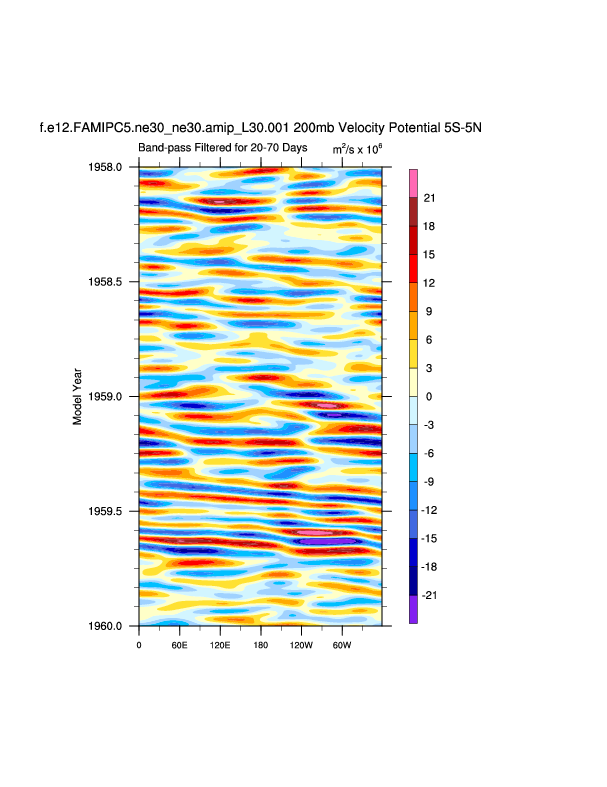
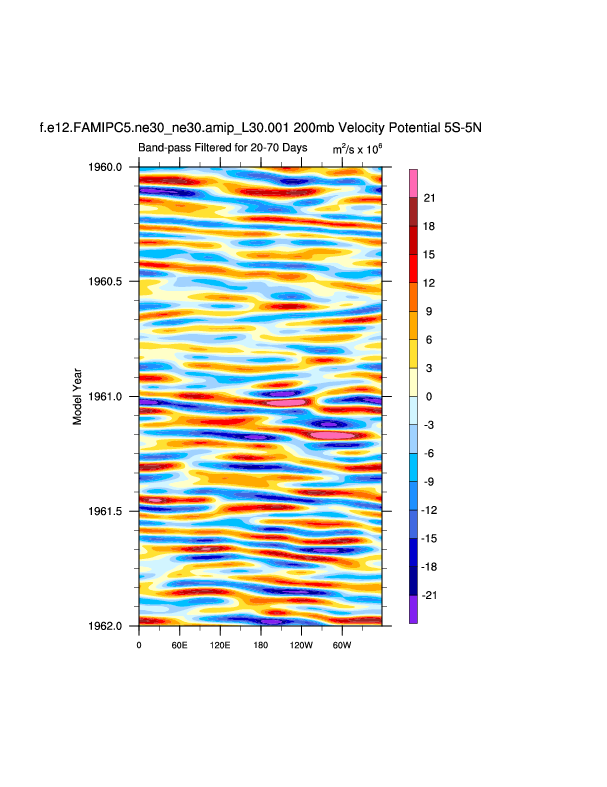
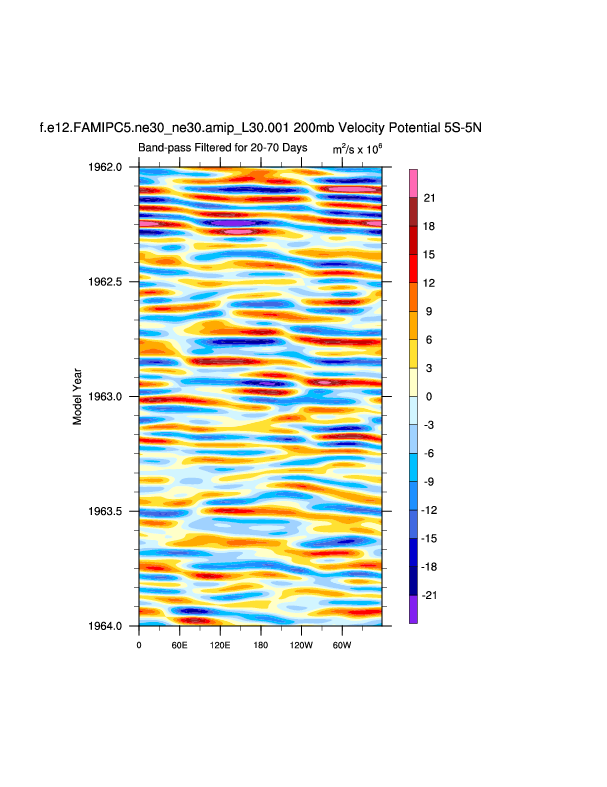
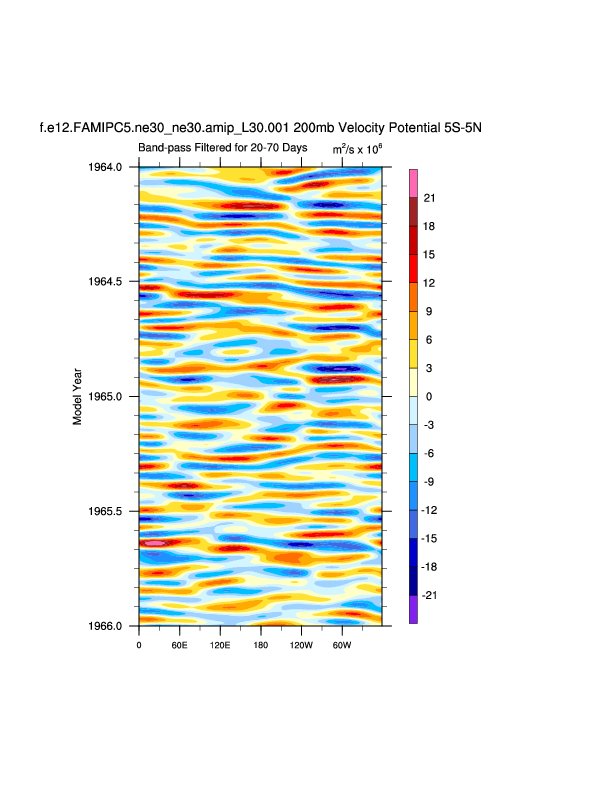
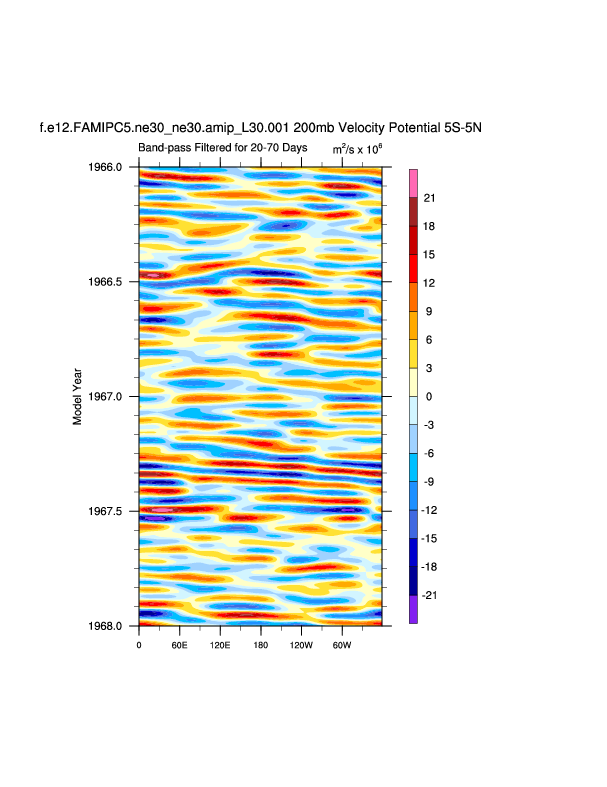
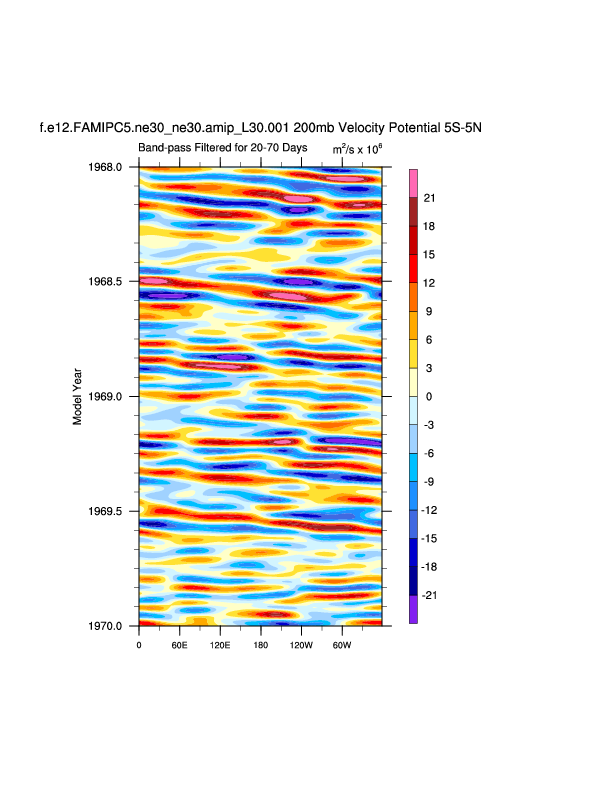
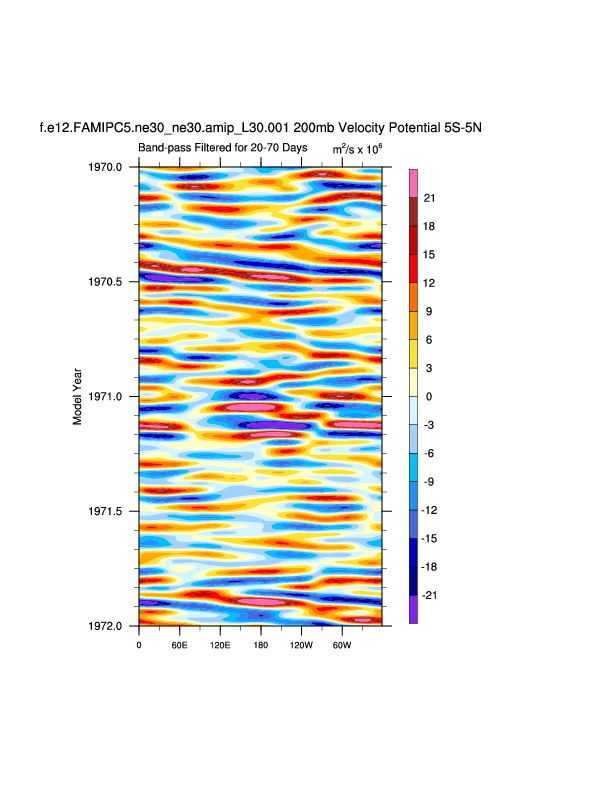
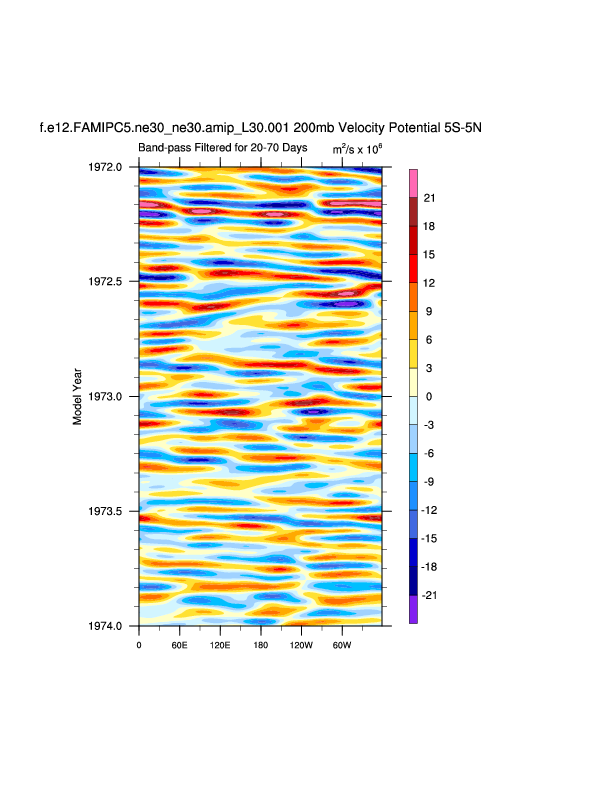
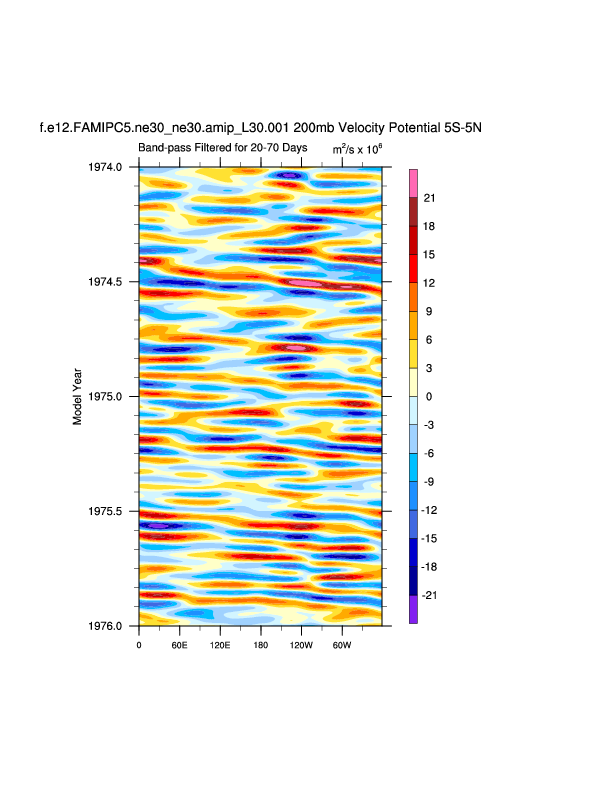
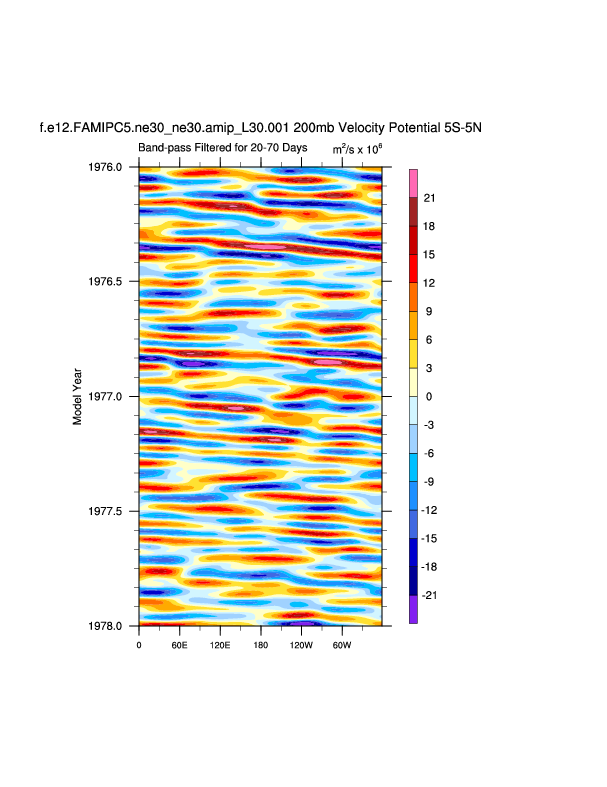
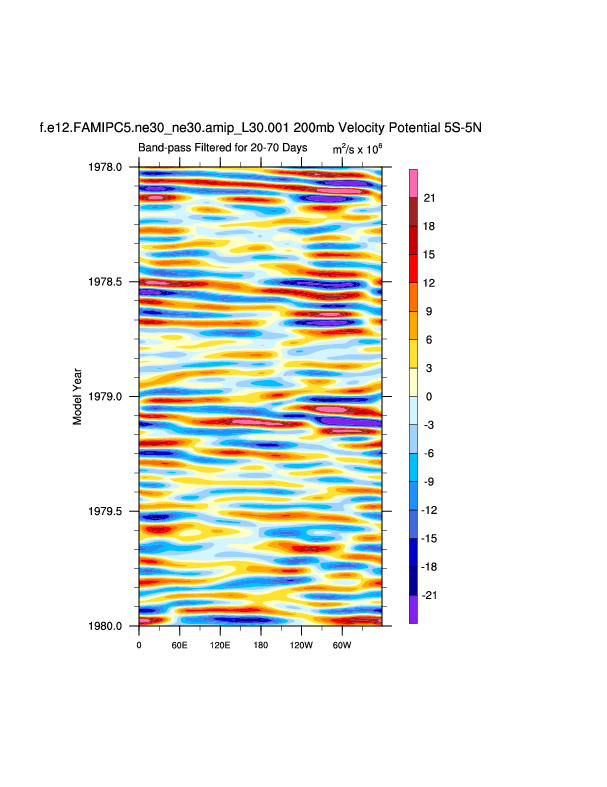
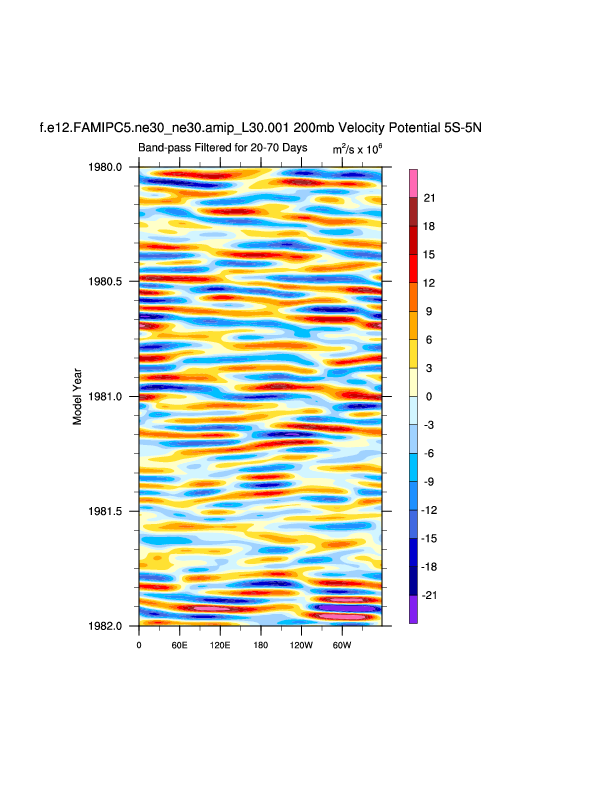
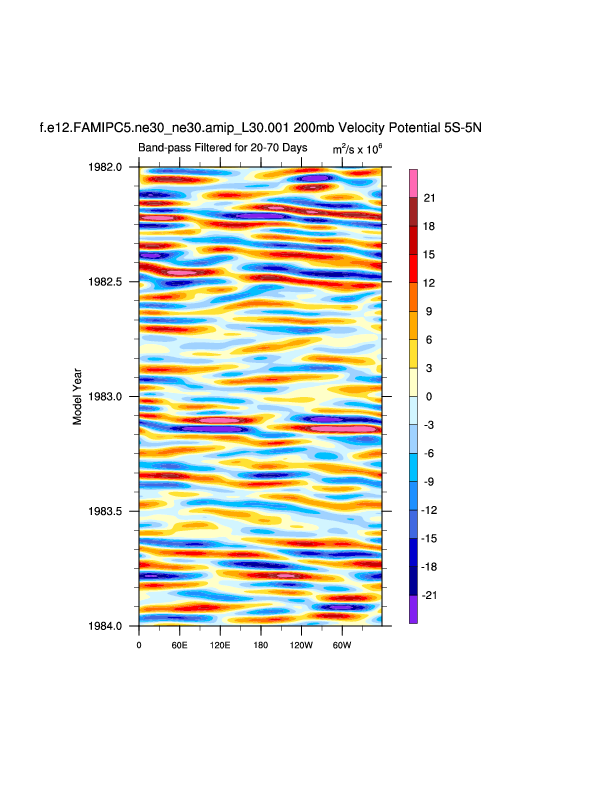
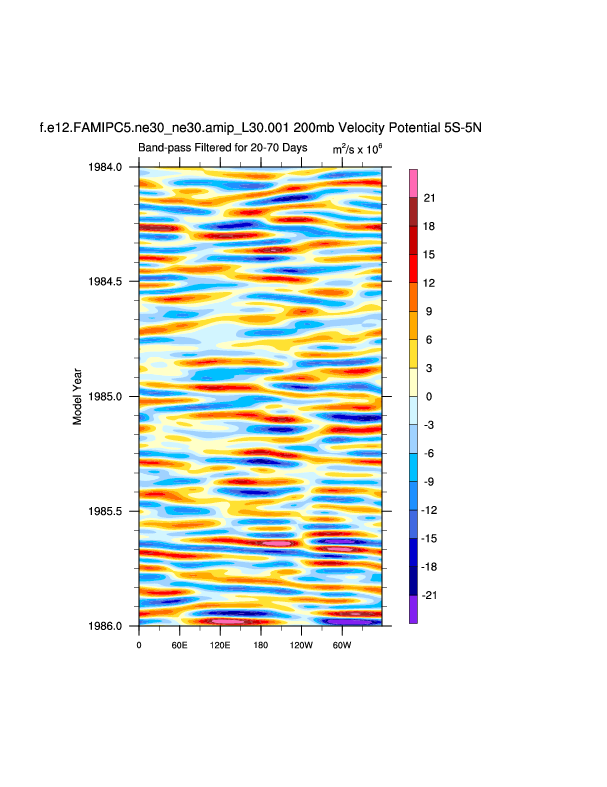
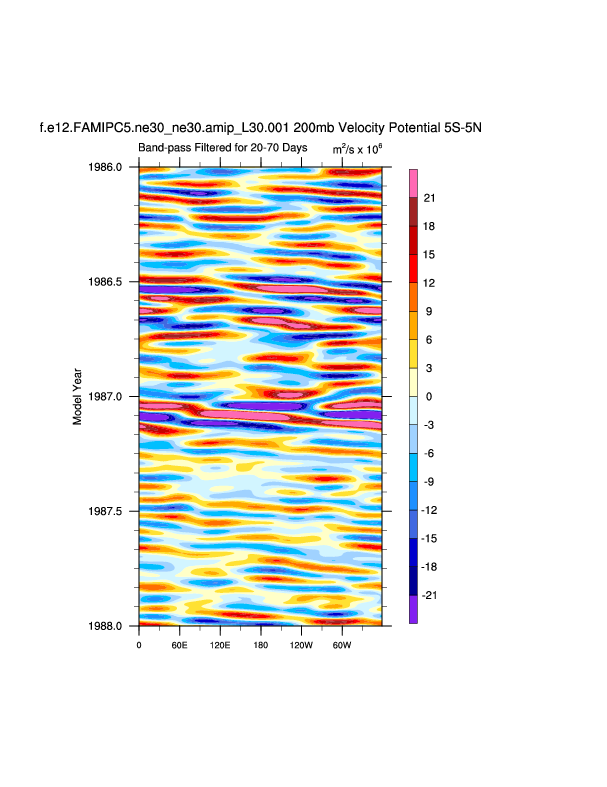
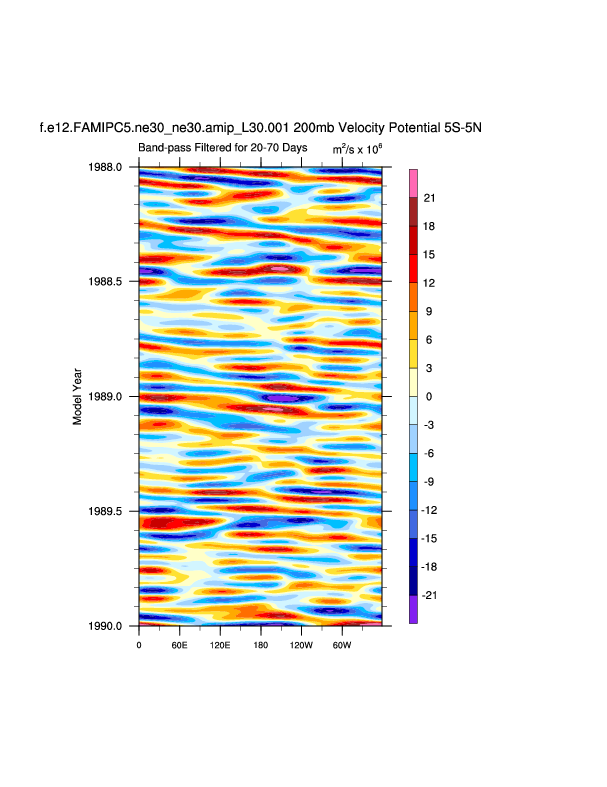
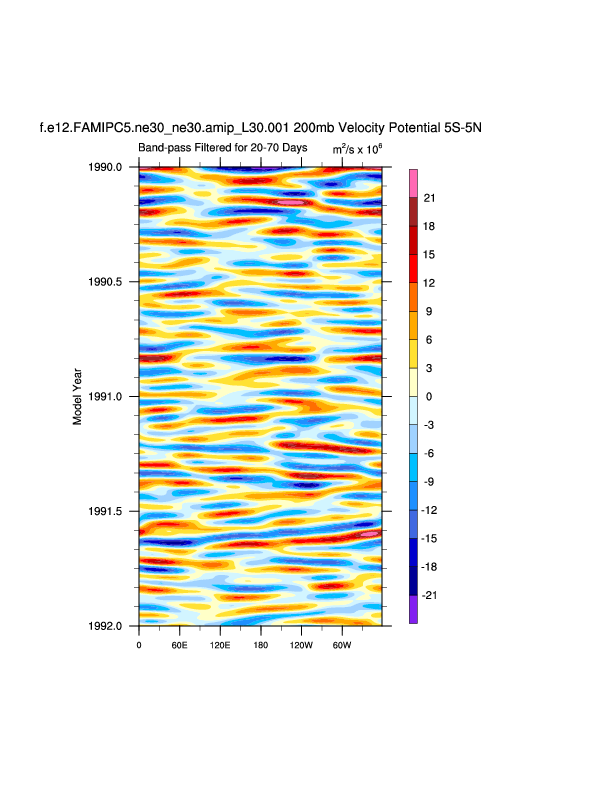
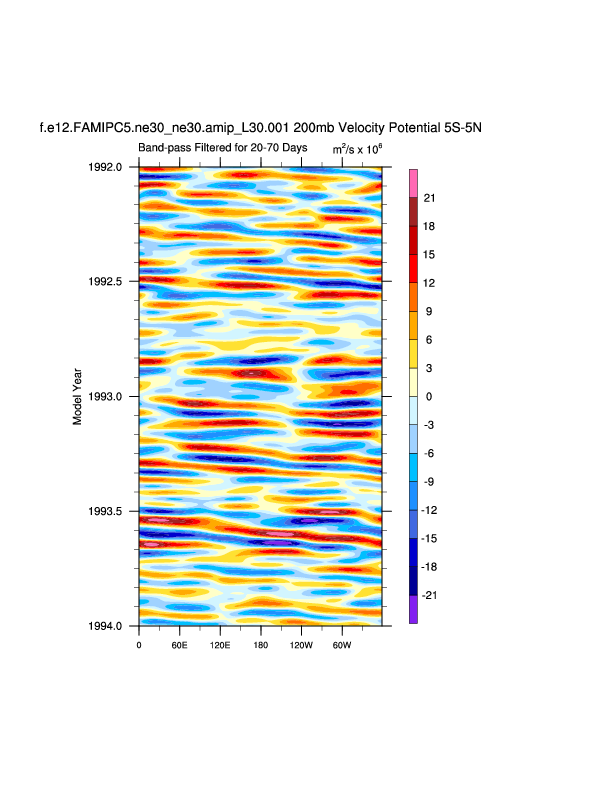
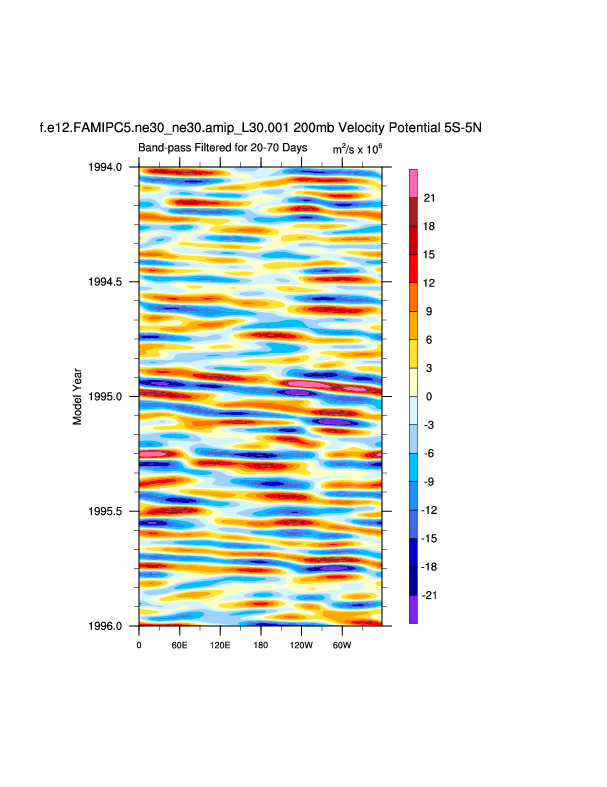
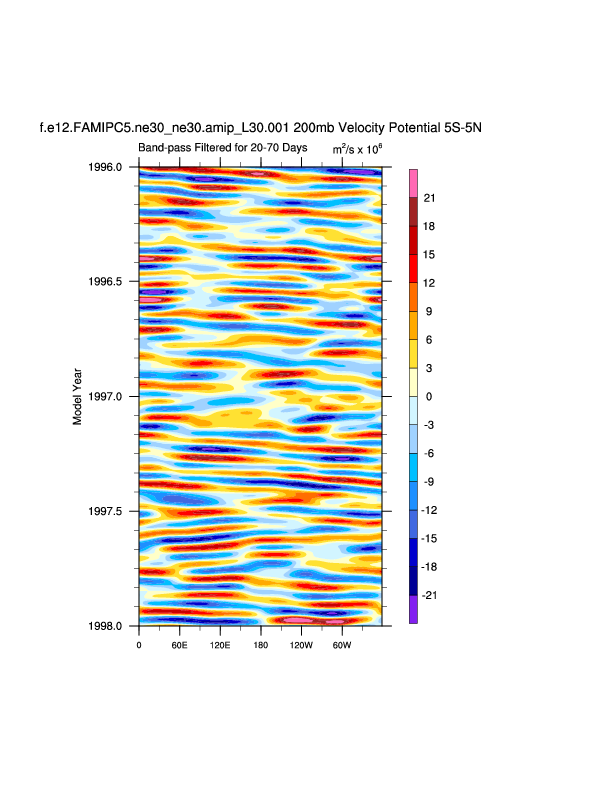
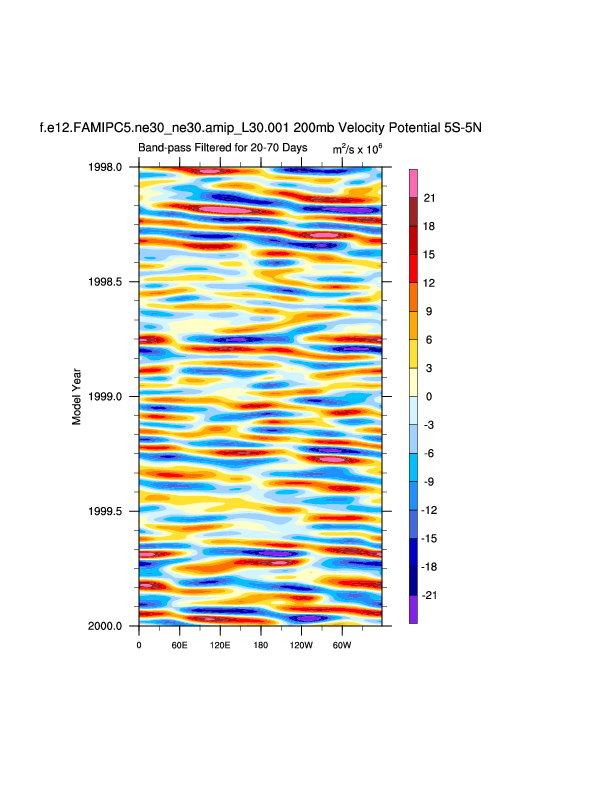
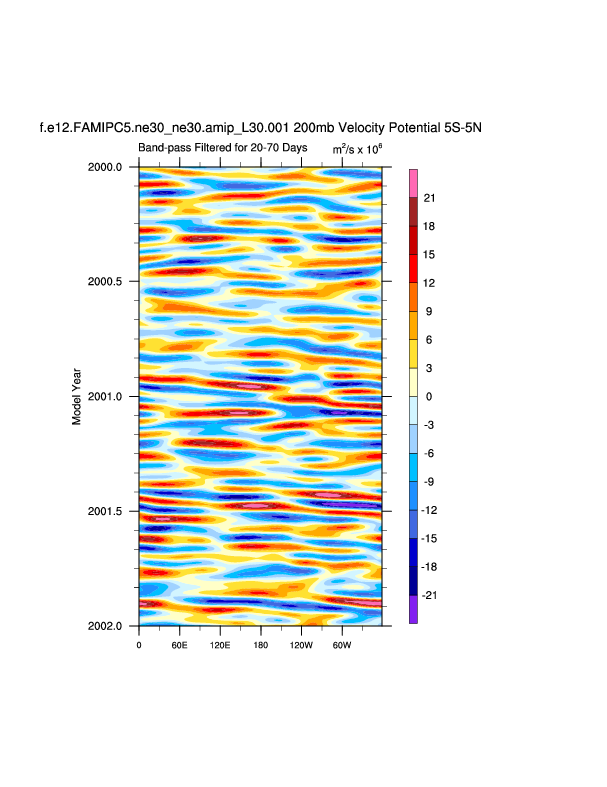
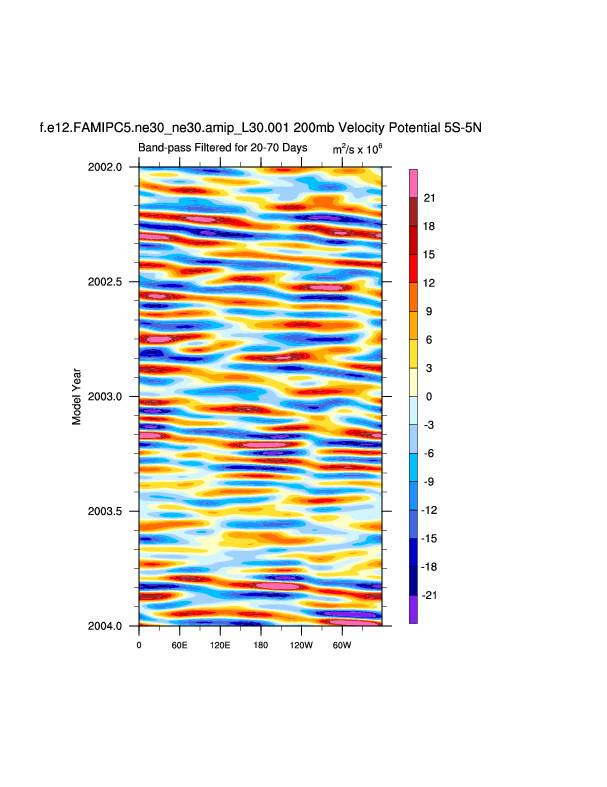
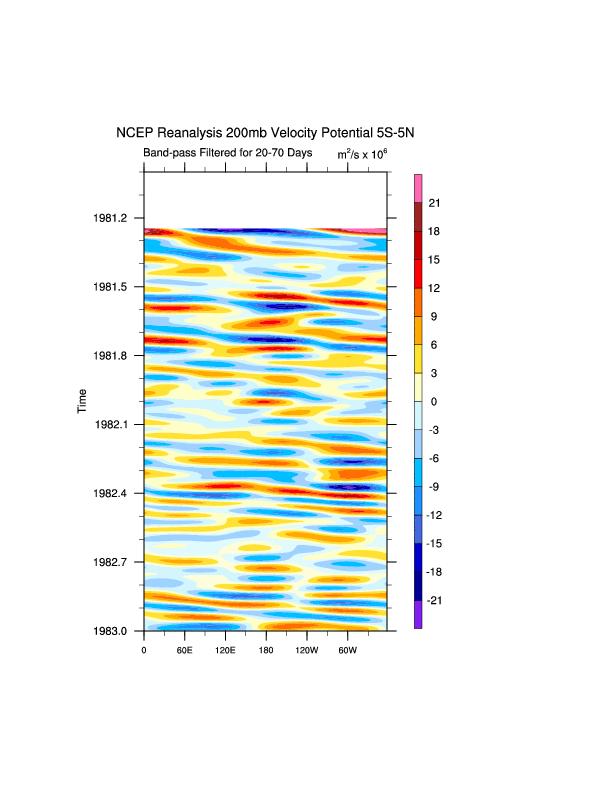
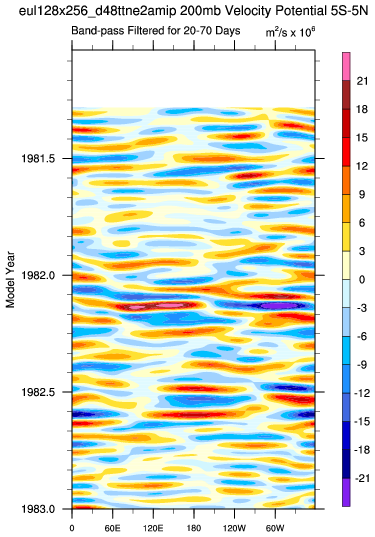
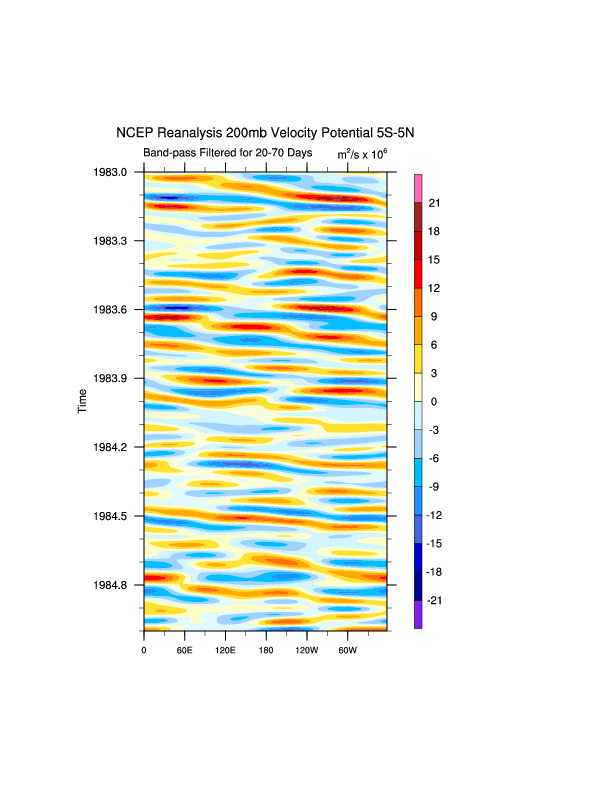
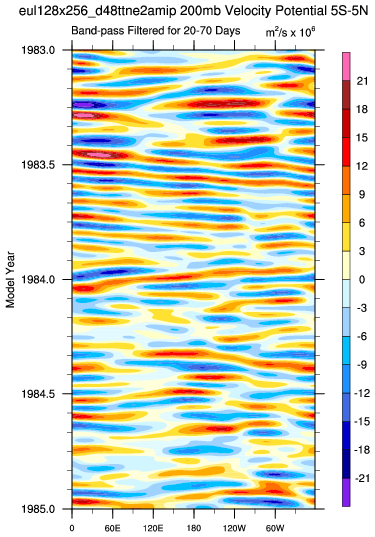
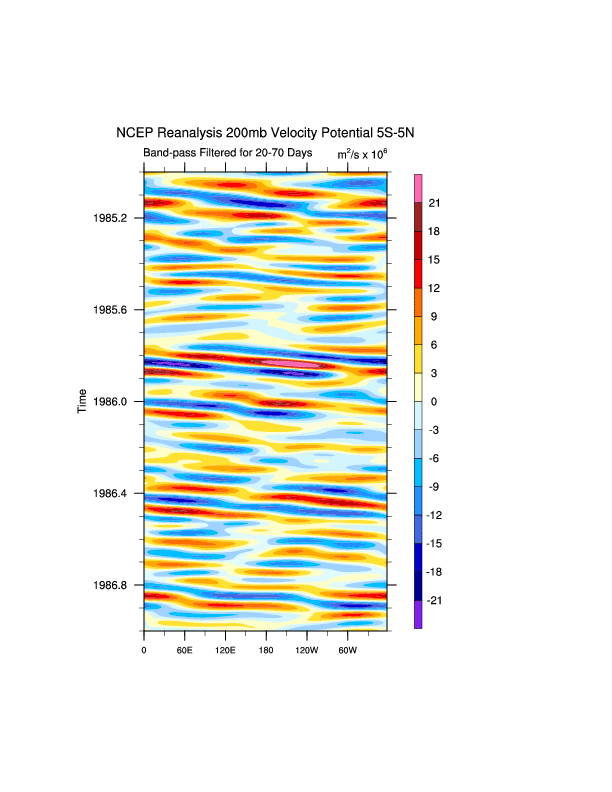
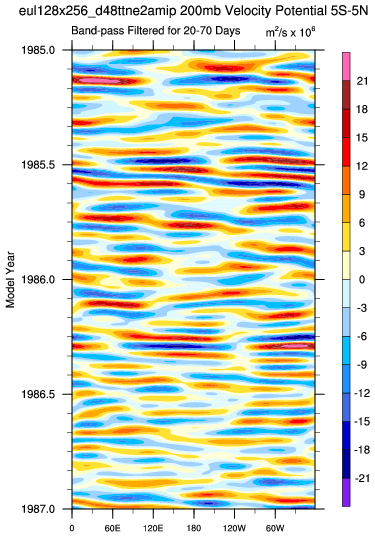
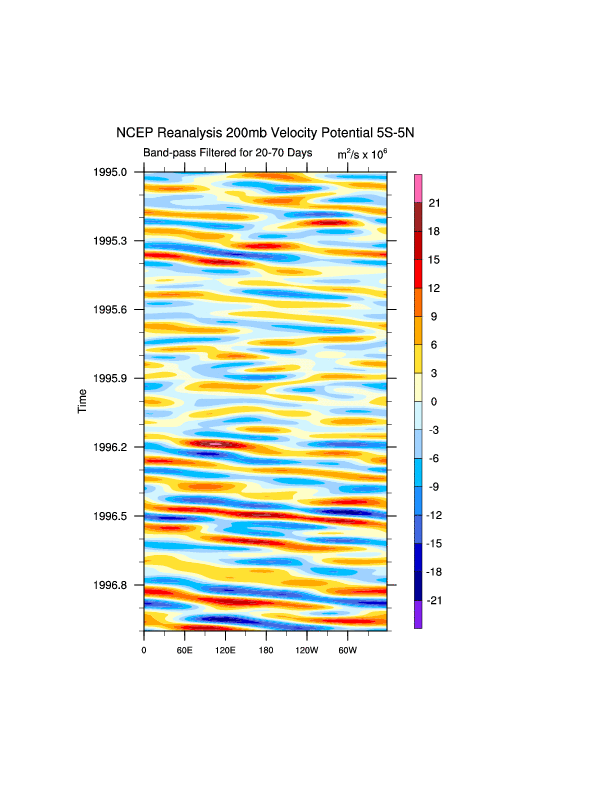
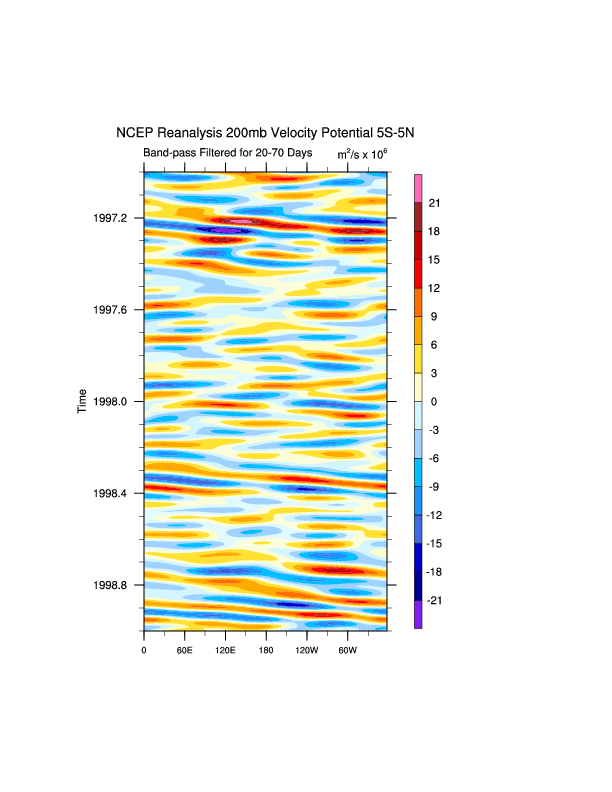
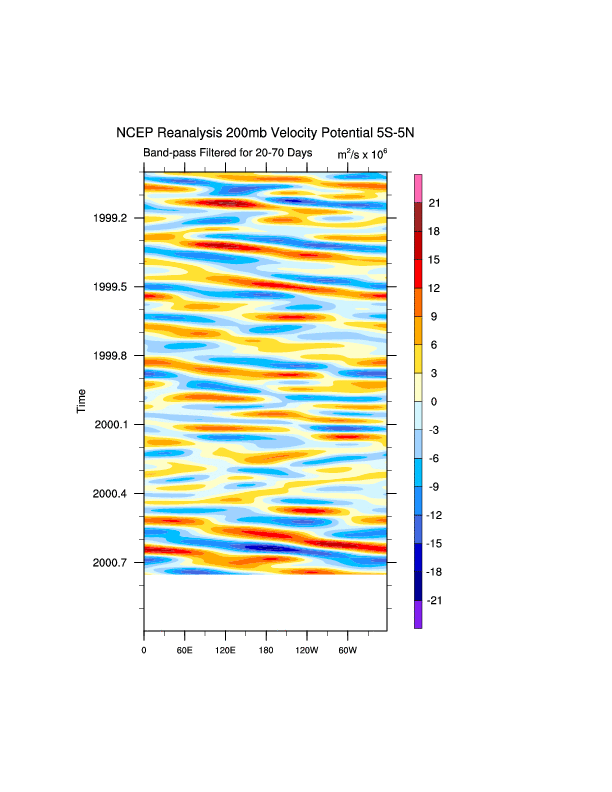
Daily 200 hPa velocity potential anomalies computed and then averaged
over 5S-5N, 20-70 day bandpass filter then applied. Hovmöller plots.
Bandpass filter response plot
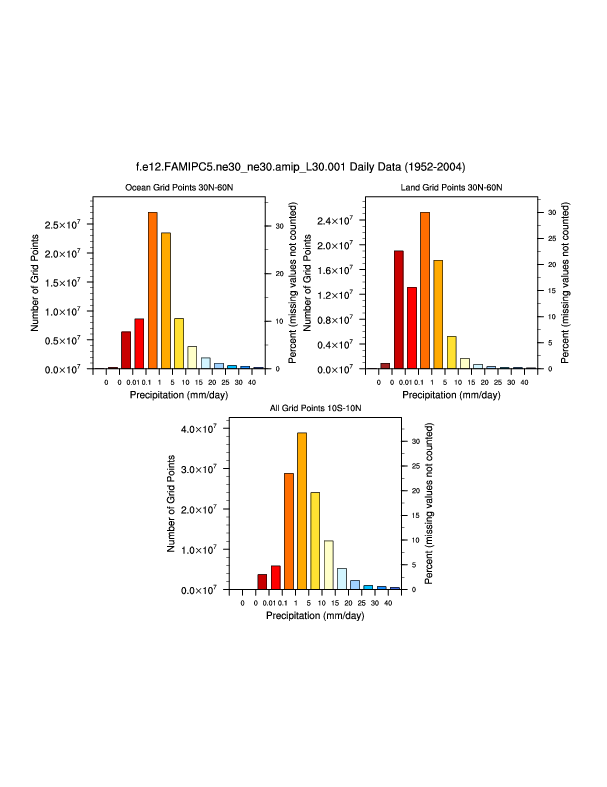
f.e12.FAMIPC5.ne30_ne30.amip_L30.001. Anomalies are relative to the 1952-2004 mean.
Anomalies computed relative to the time period mean.
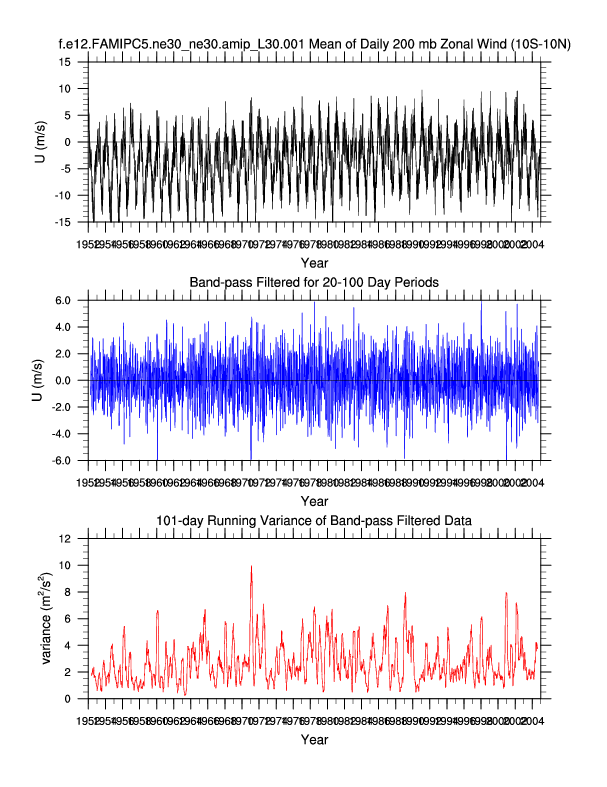
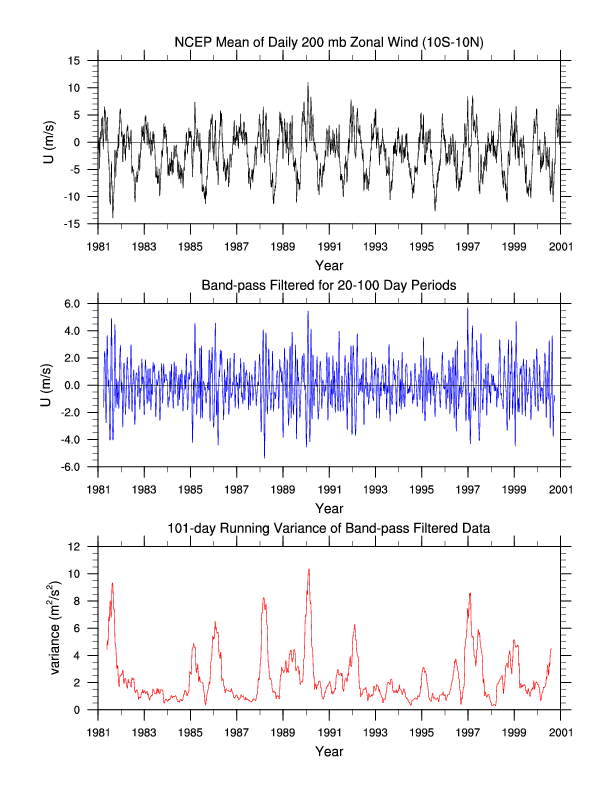
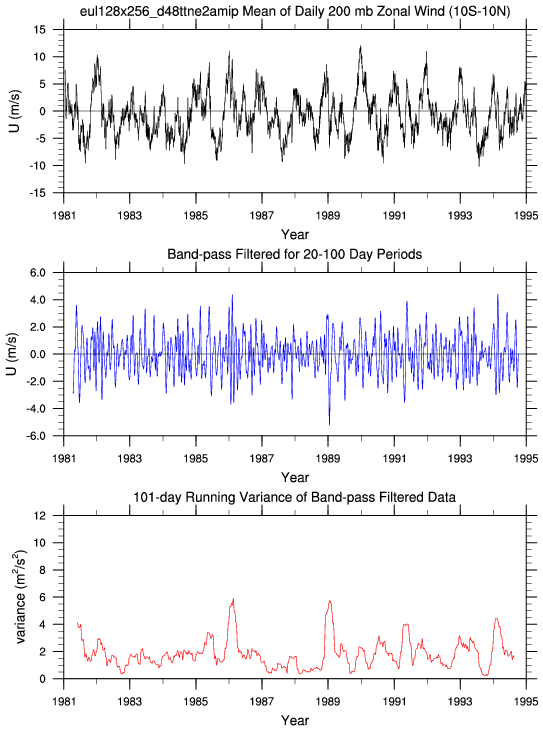
Madden-Julian Oscillation
Time series of daily 200 hPa zonal wind averaged over 10N-10S.
200 hPa zonal wind bandpass filtered for 20-100 day period.
MJO Index defined as the running variance of the bandpass filtered data.
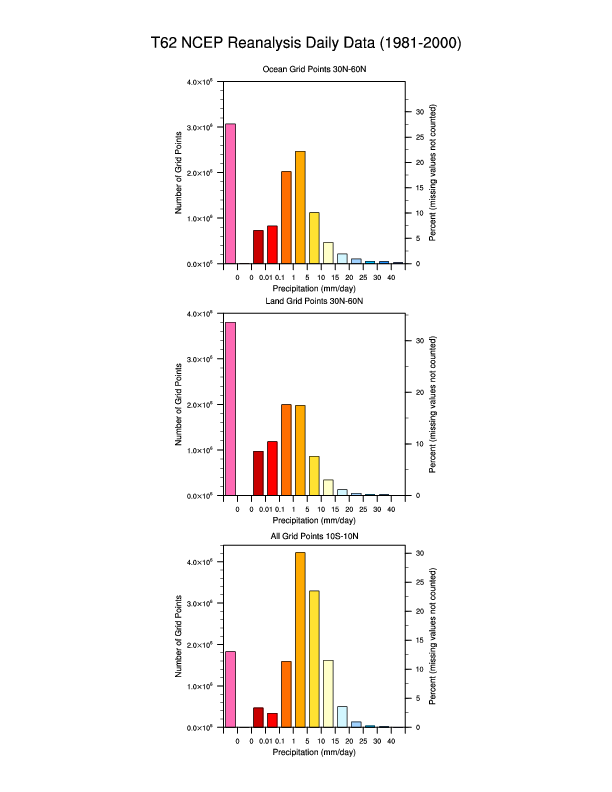
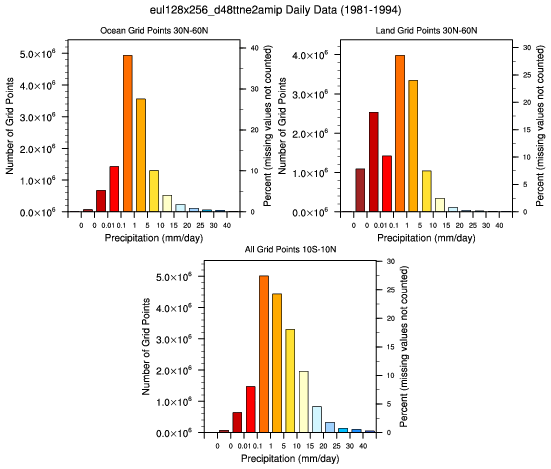
Histograms
Histograms of daily precipitation rate for the Tropics and NH Extratropics.