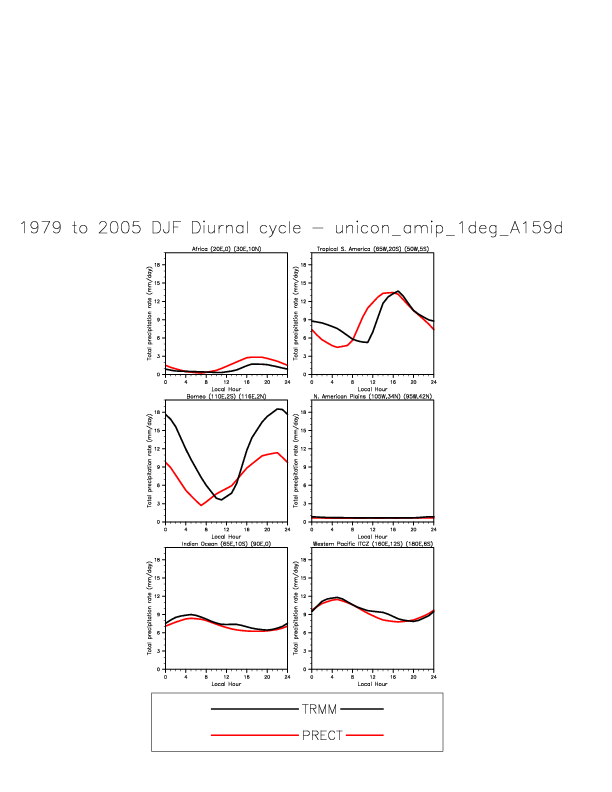
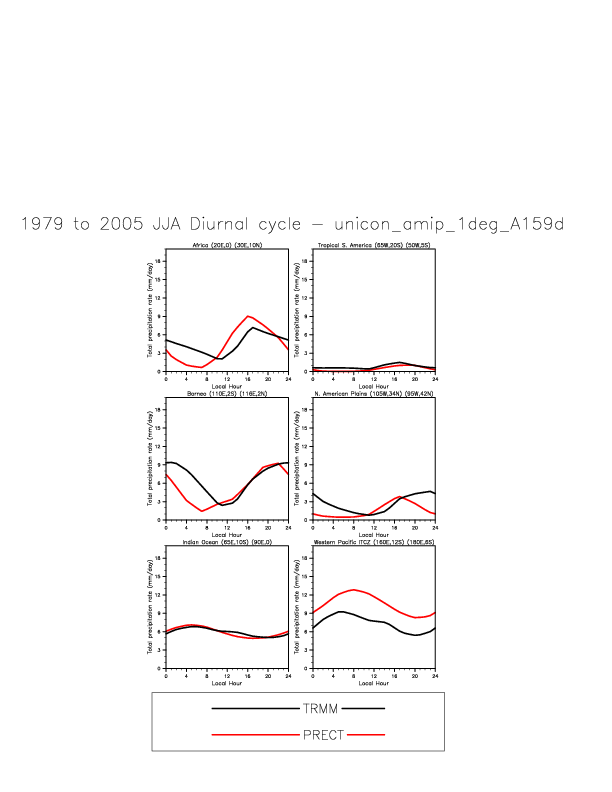
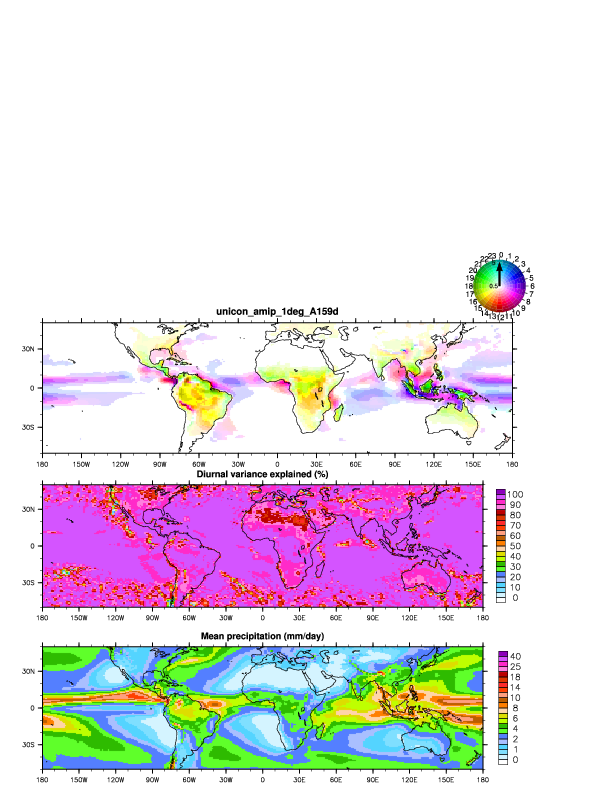
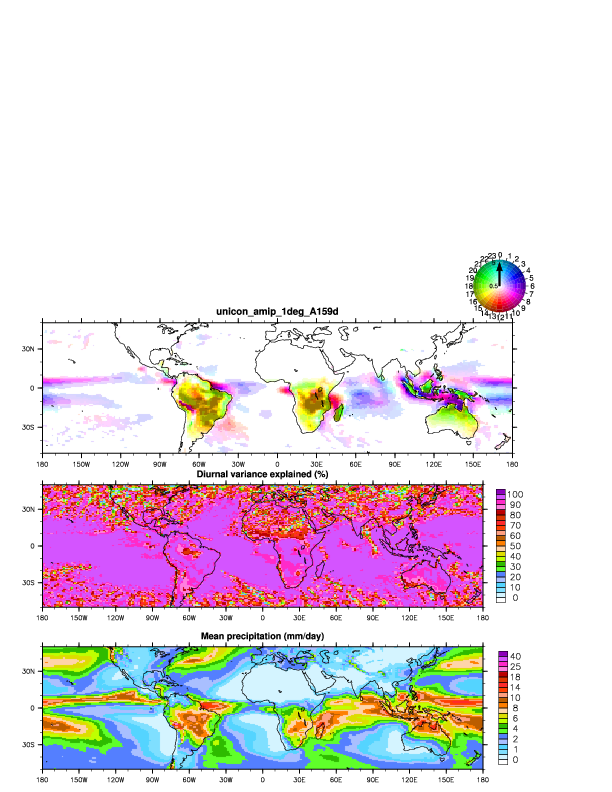
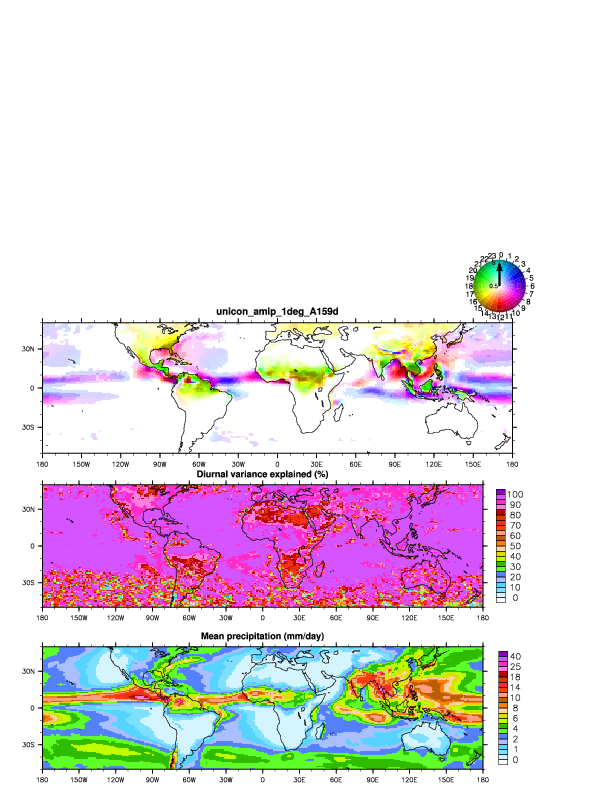
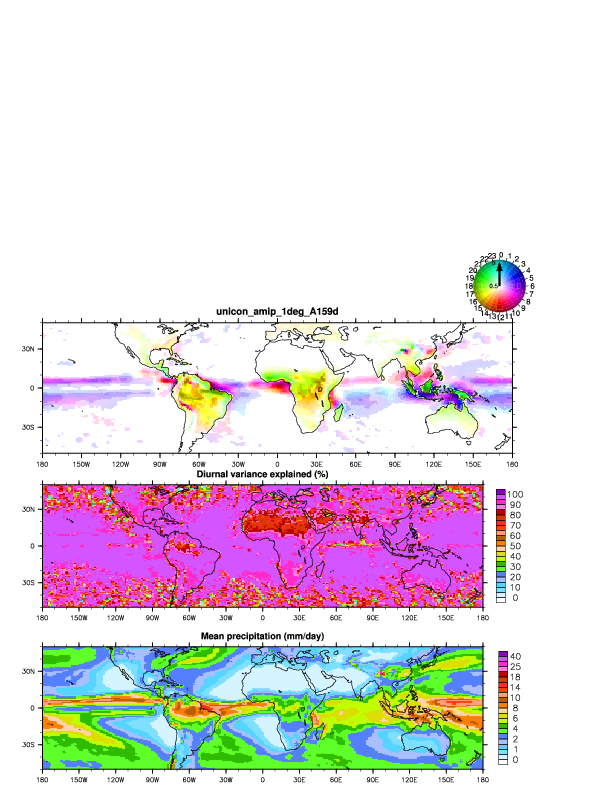
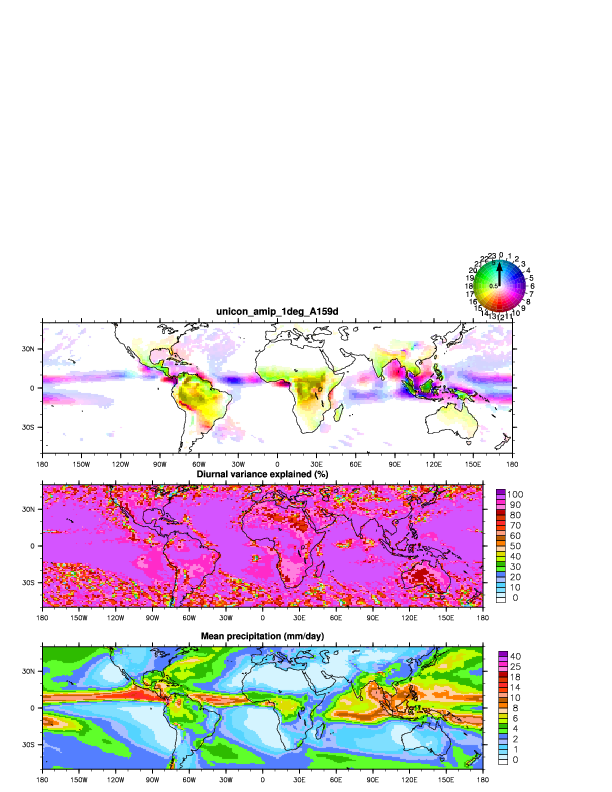
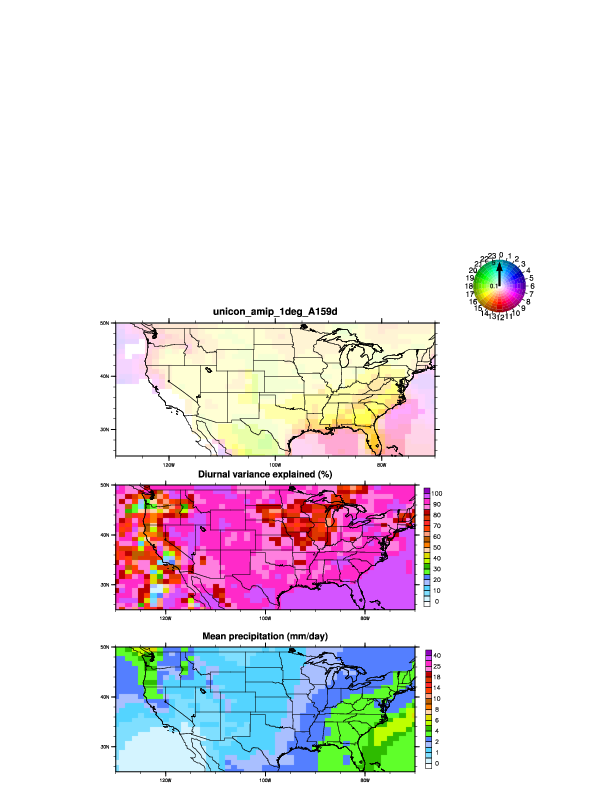
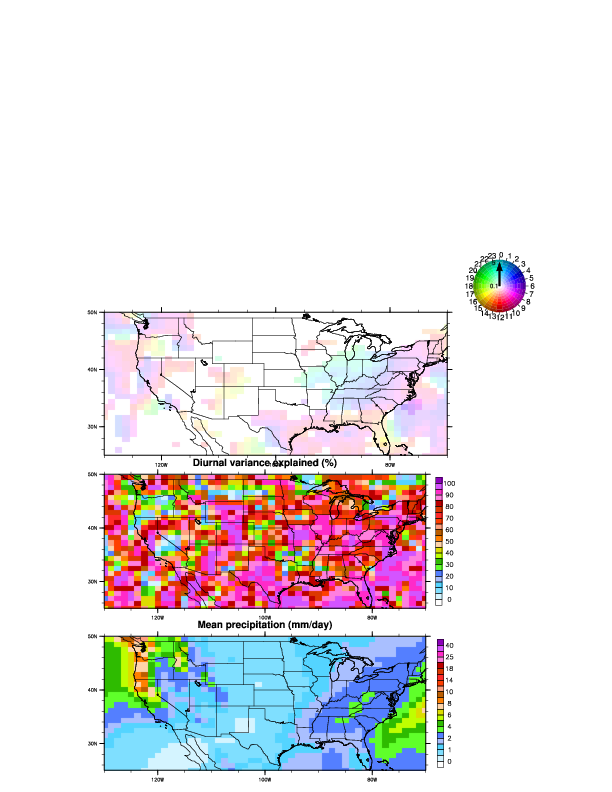
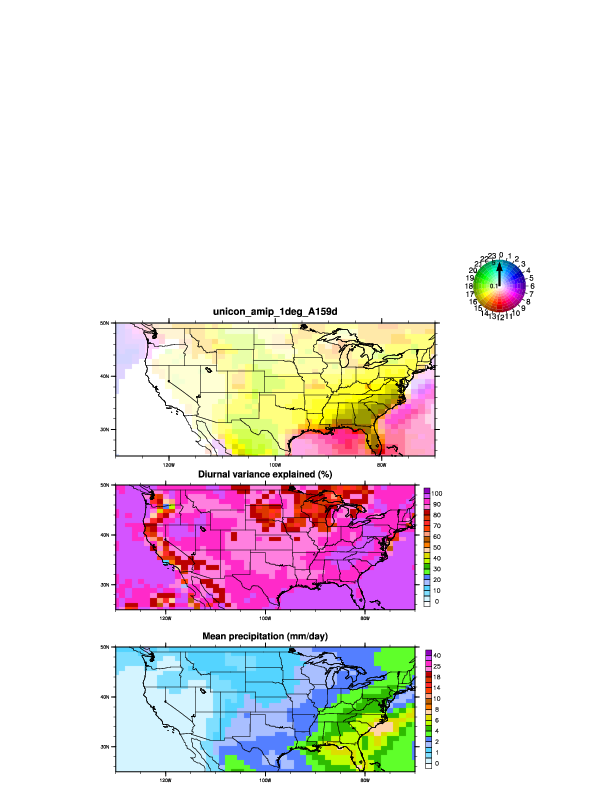
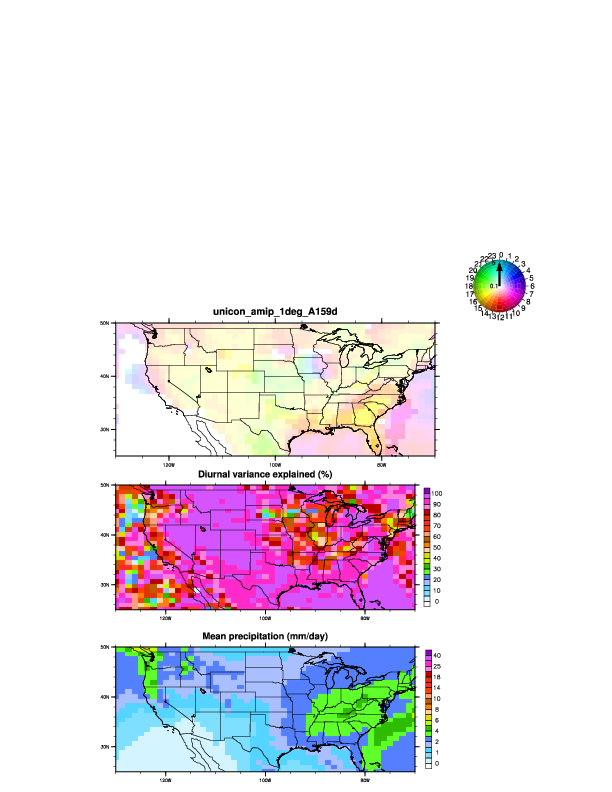
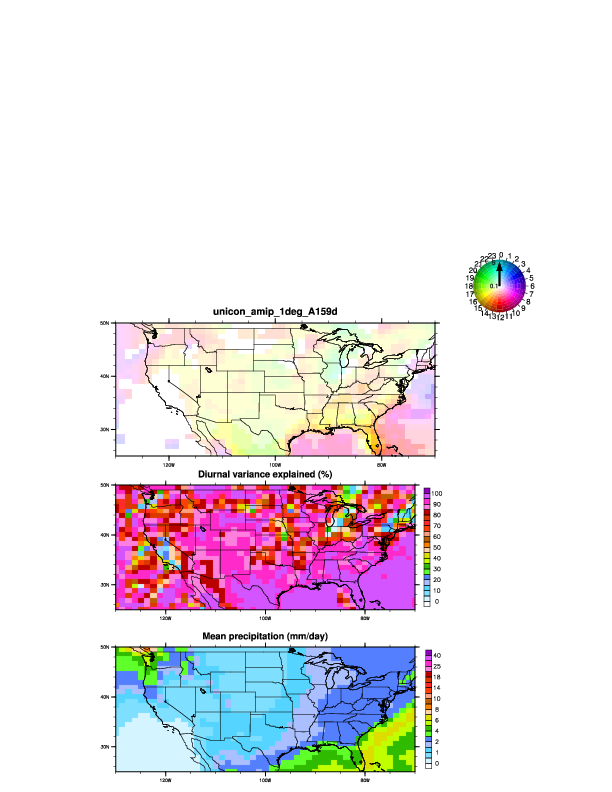
Diurnal cycle of precipitation by the model simulation is compared with TRIMM Observations
| DIURNAL CYCLE OF PRECT (precipitation rate) | unicon_amip_1deg_A159d | TRIMM |
|---|---|---|
| regional DJF (DEC-JAN-FEB) | plot | |
| regional JJA (JUN-JUL-AUG) | plot | |
| Global ANN (annual average) | plot | plot |
| Global DJF (DEC-JAN-FEB) | plot | plot |
| Global JJA (JUN-JUL-AUG) | plot | plot |
| Global MAM (MAR-APR-MAY) | plot | plot |
| Global SON (SEP-OCT-NOV) | plot | plot |
| USA ANN (annual average) | plot | plot |
| USA DJF (DEC-JAN-FEB) | plot | plot |
| USA JJA (JUN-JUL-AUG) | plot | plot |
| USA MAM (MAR-APR-MAY) | plot | plot |
| USA SON (SEP-OCT-NOV) | plot | plot |
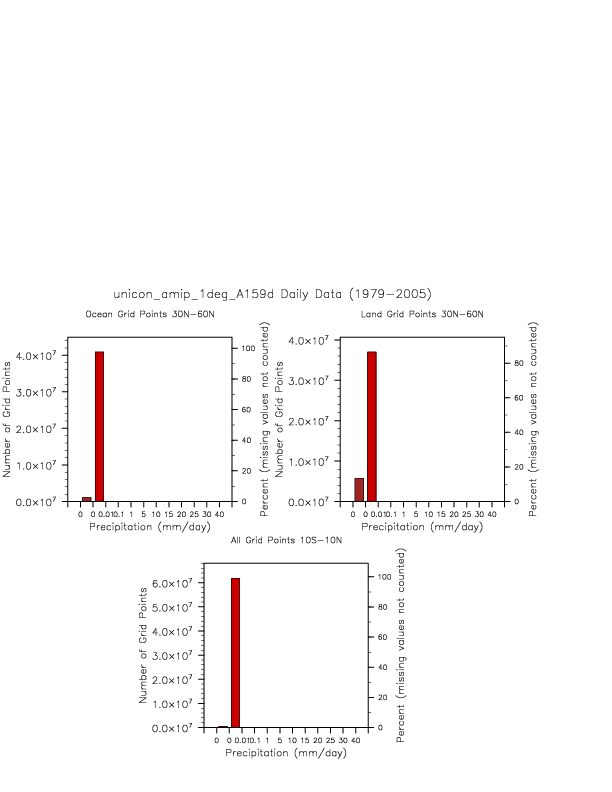
| Histogram OF 3-hourly precipitation rate | unicon_amip_1deg_A159d | TRIMM |
|---|---|---|
| the Tropics and NH Extratropics | unicon_amip_1deg_A159d | TRIMM |