f.e13.FC5.f09_f09.mjmc5367.004.modeopt
and
f.e13.FC5.f09_f09.mjmc5367.001.default
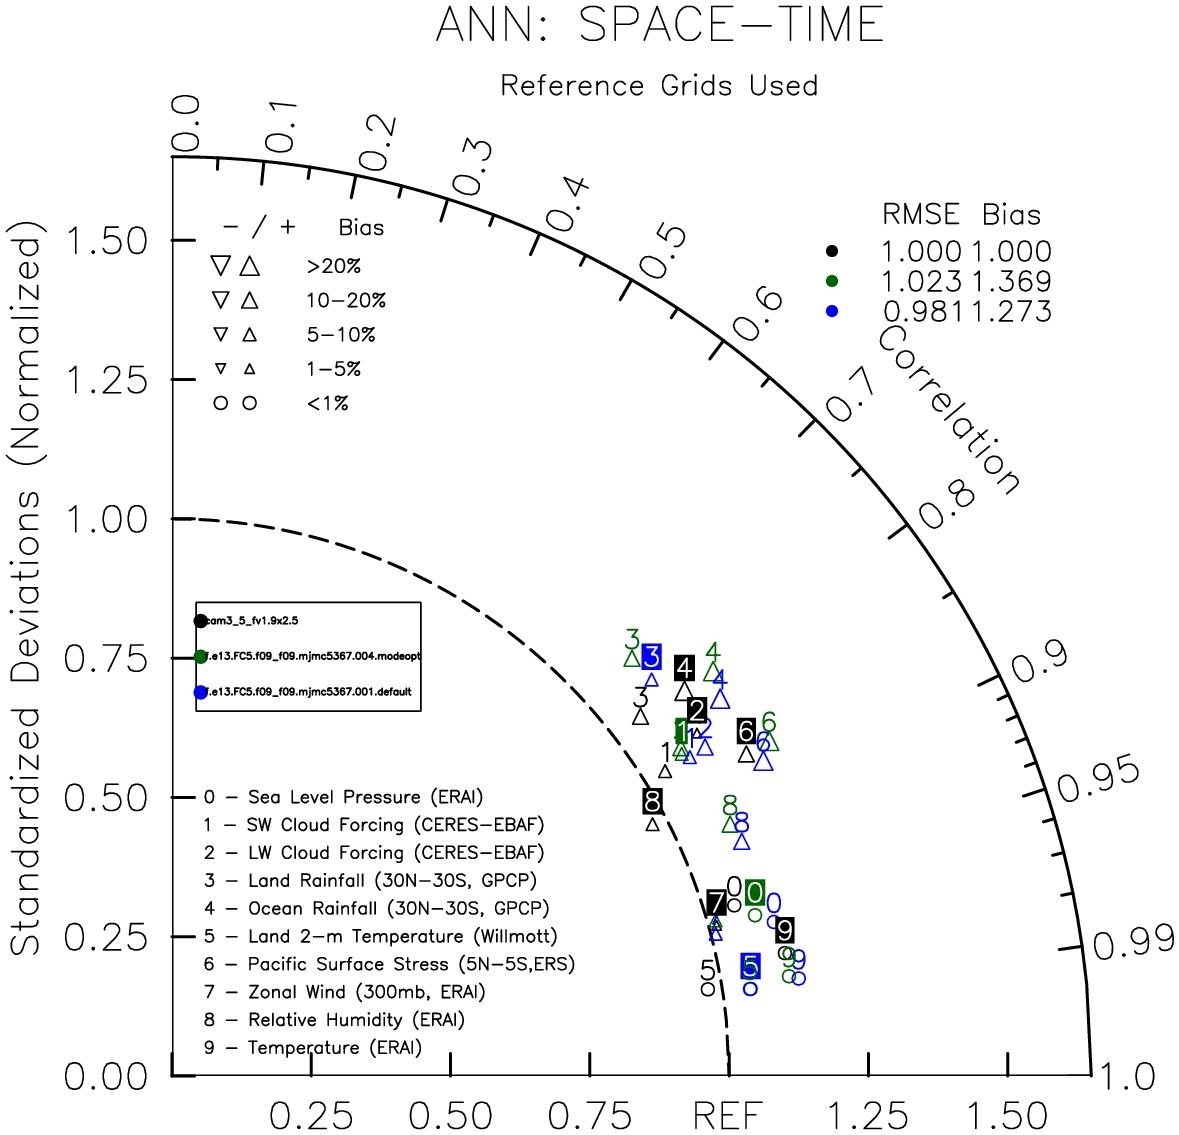
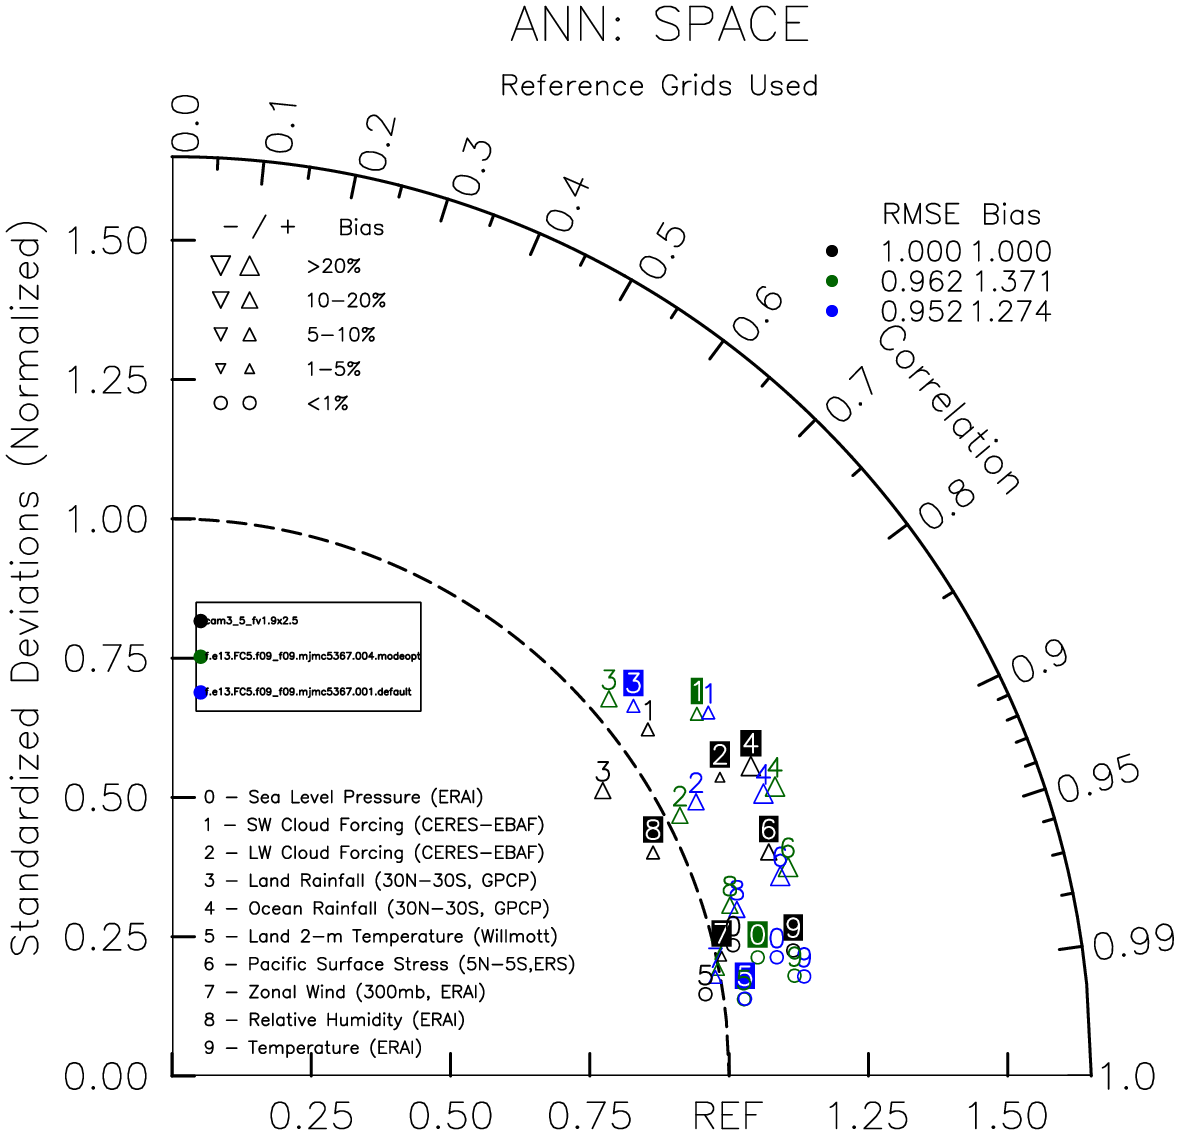
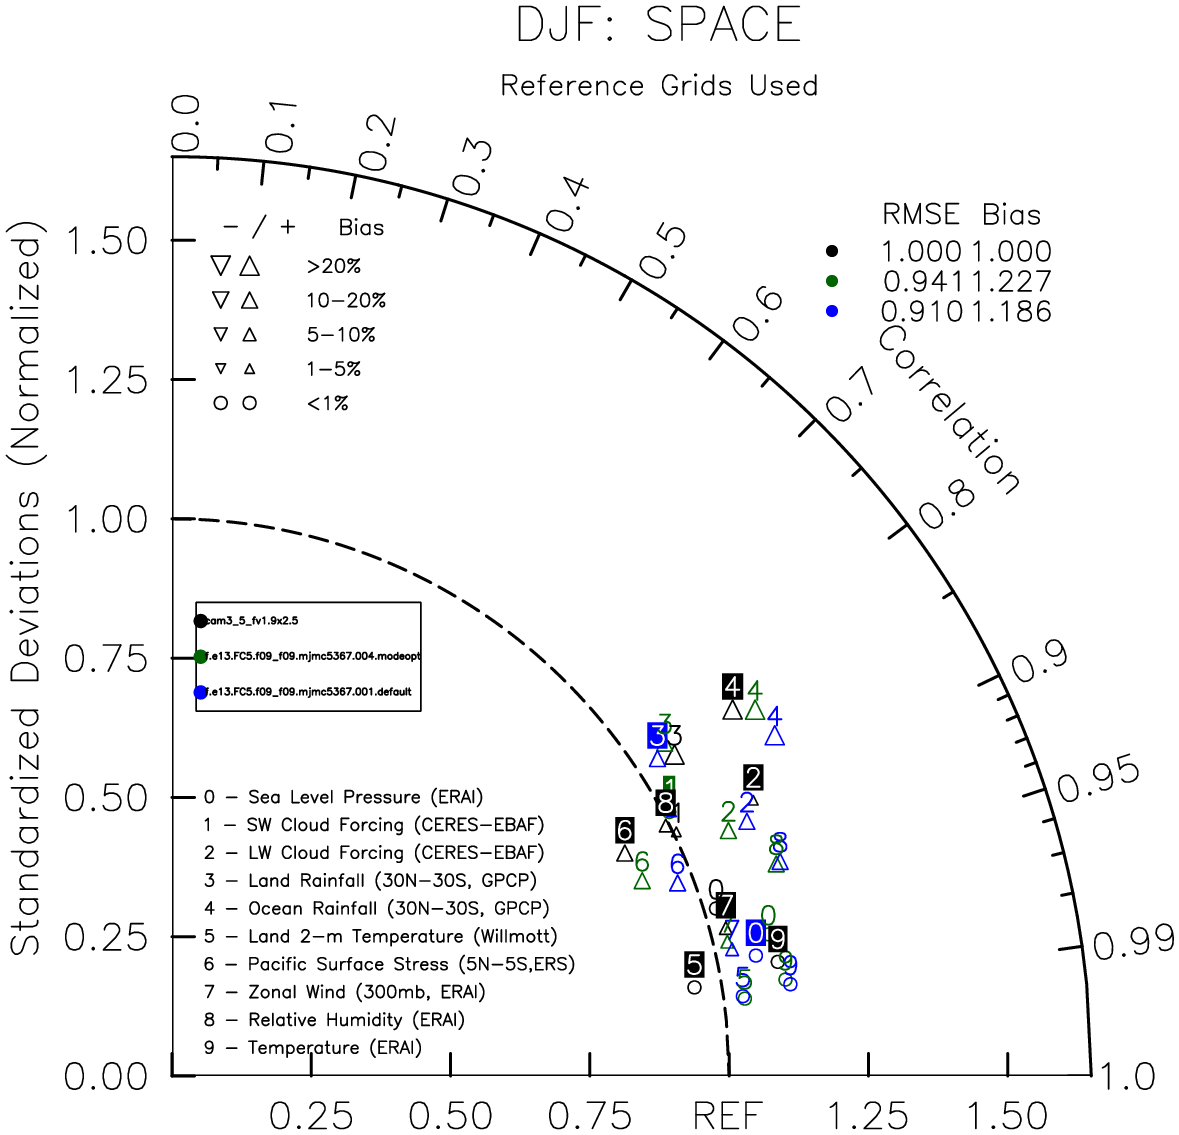
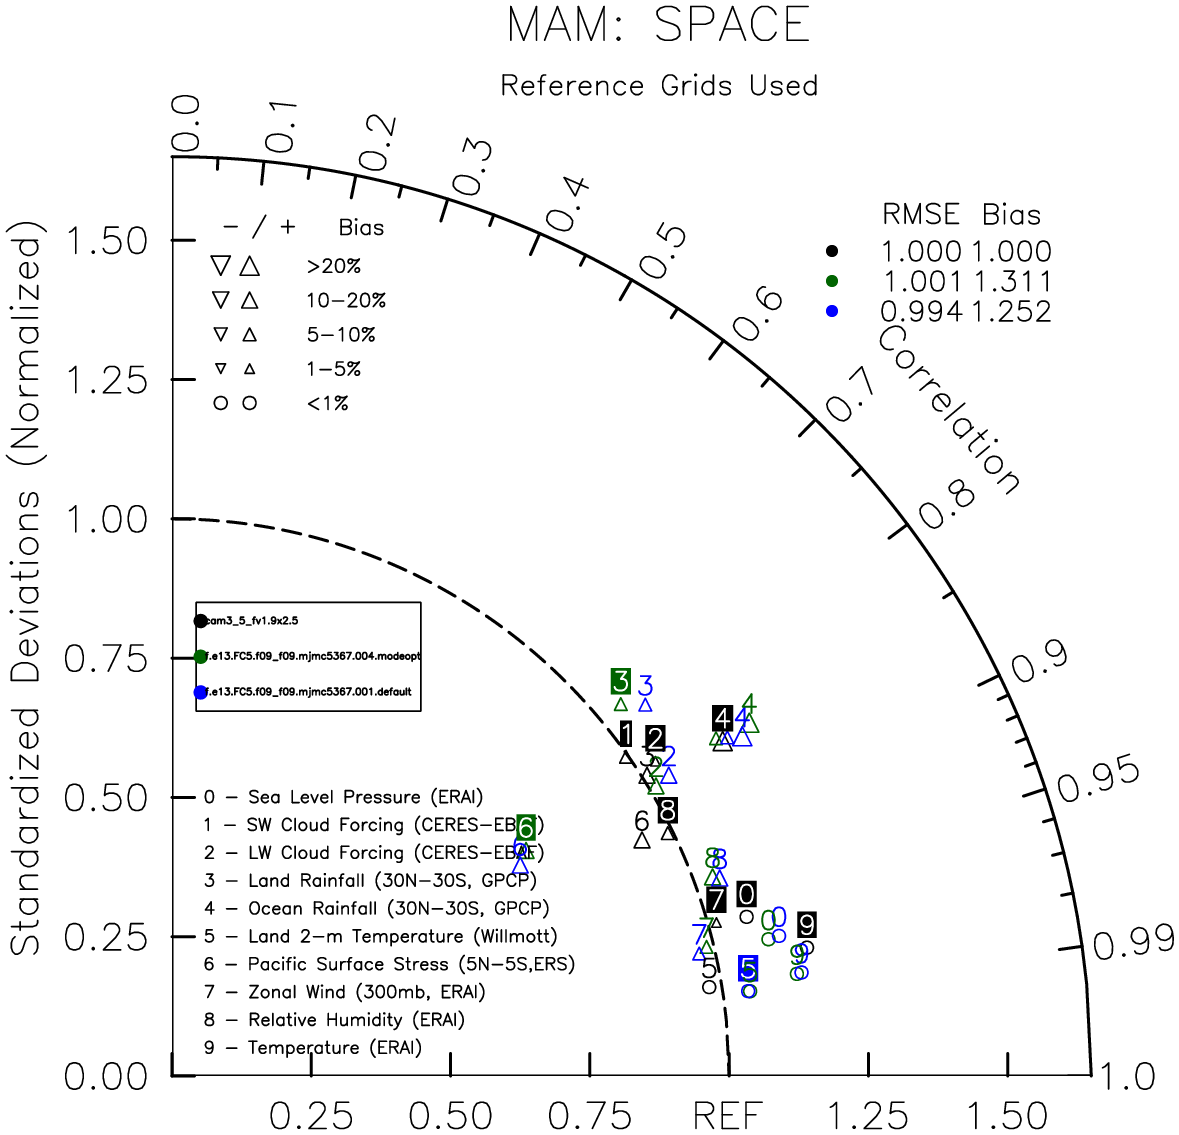
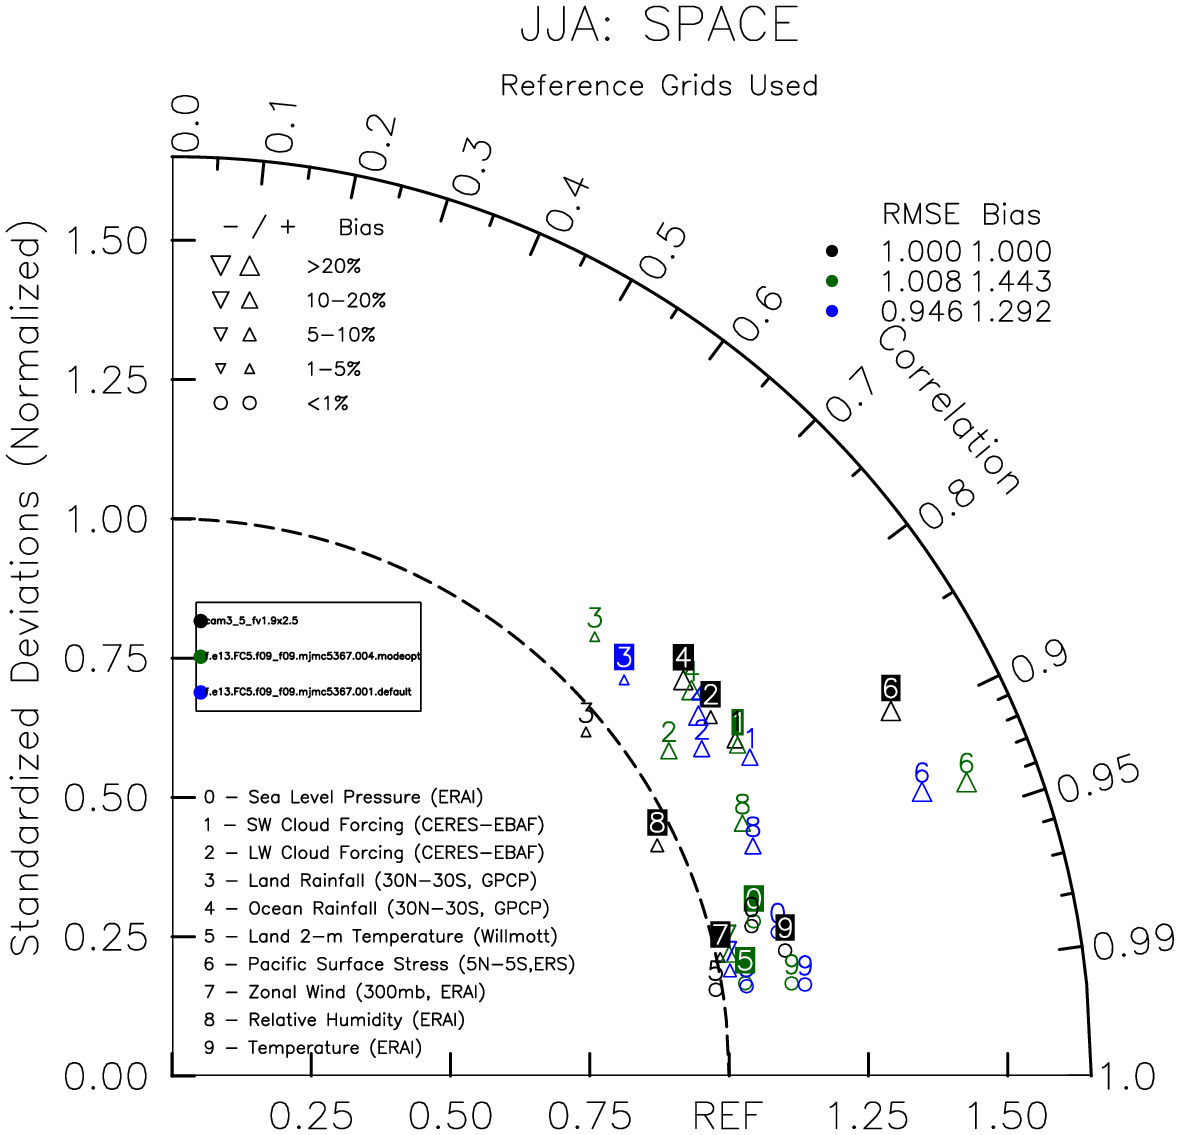
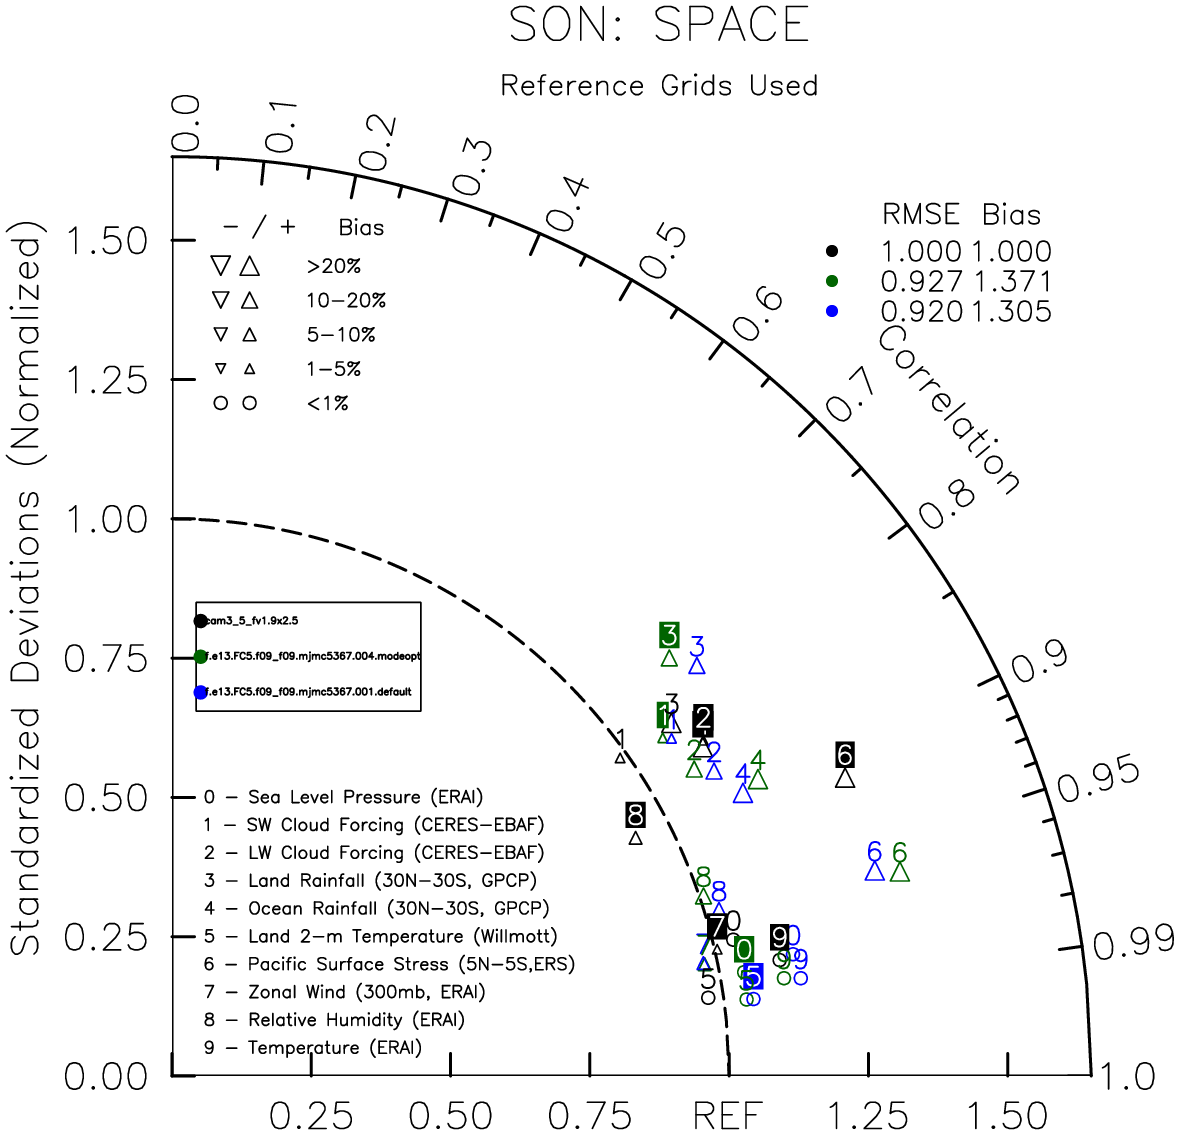
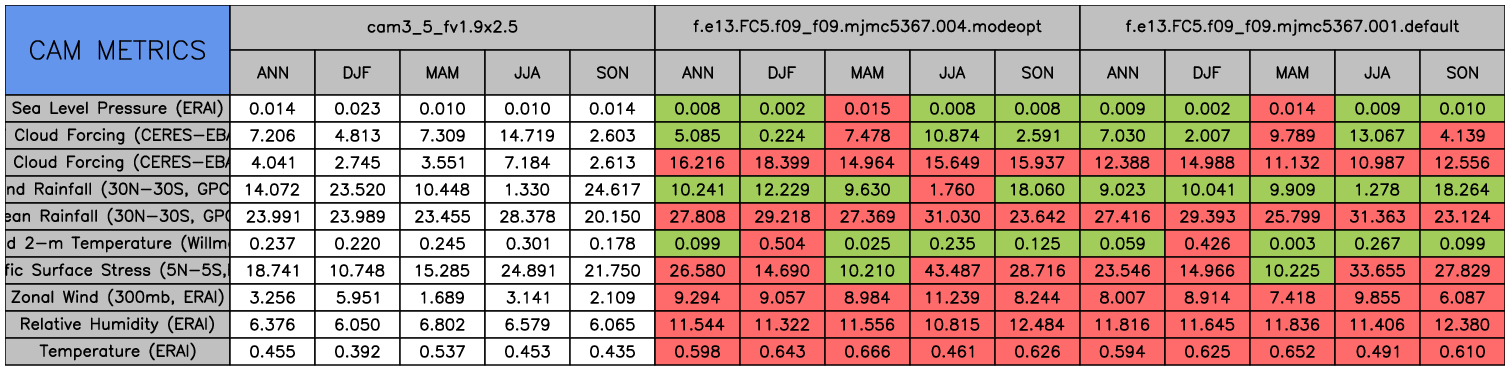
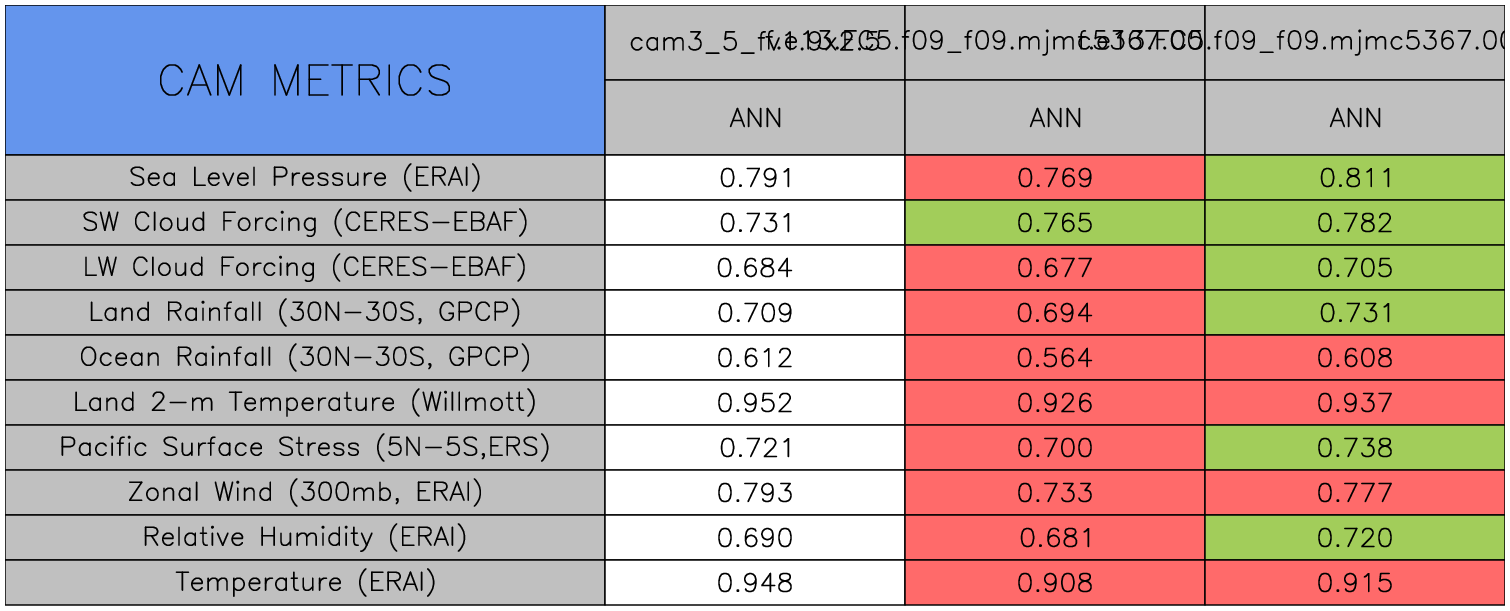
DIAG Set 14 - Taylor Diagrams
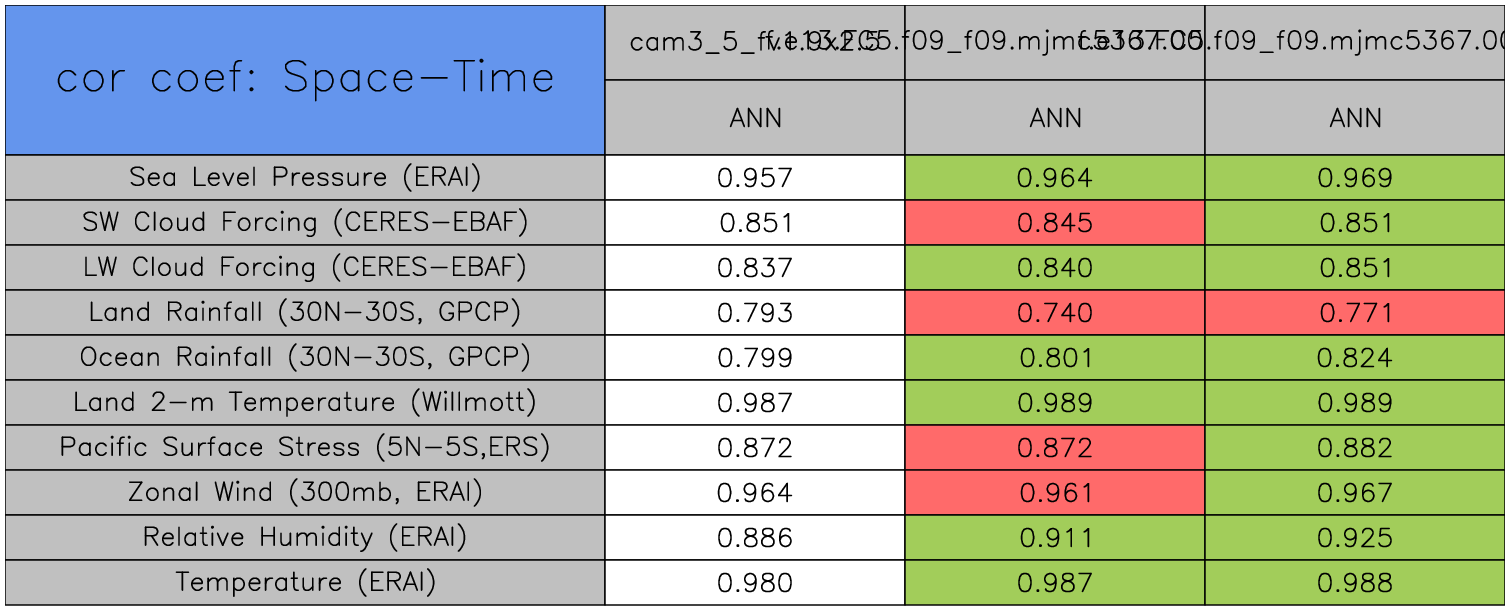
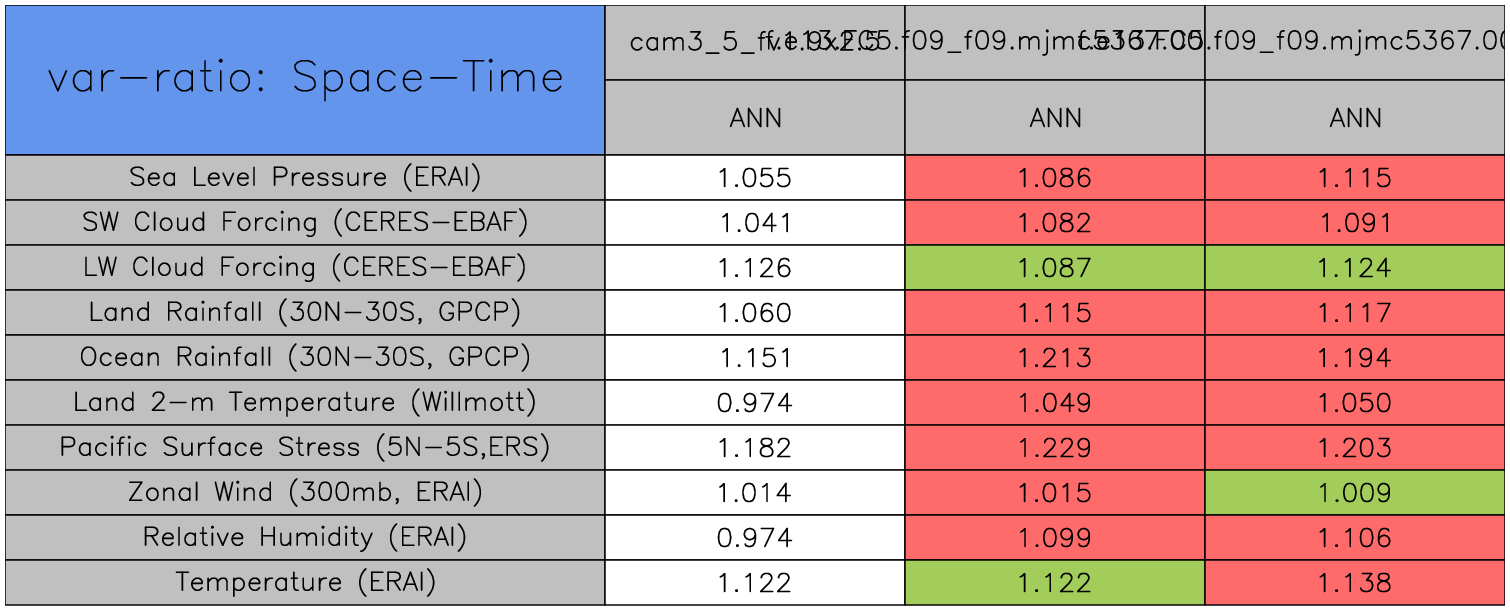
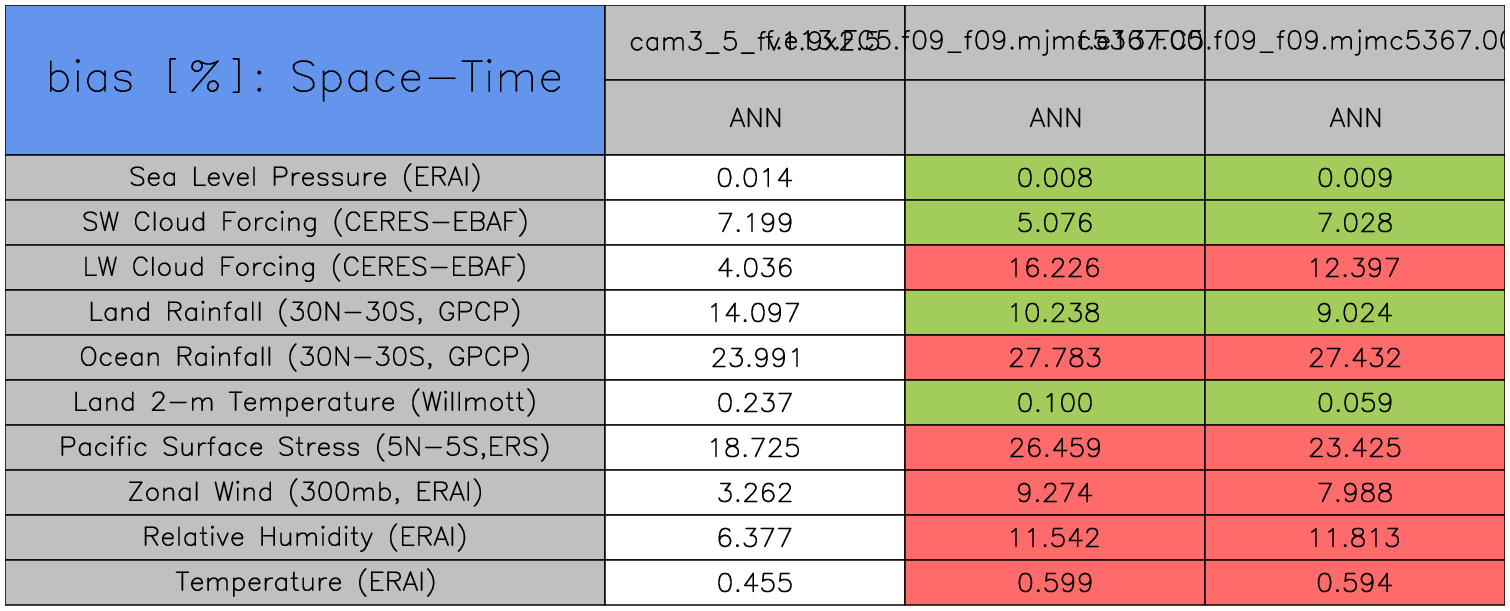
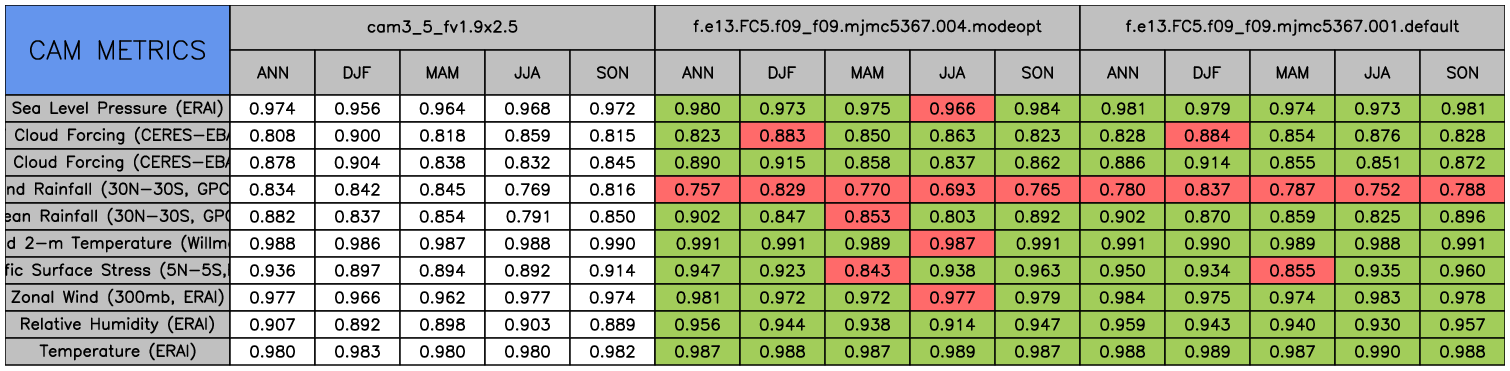
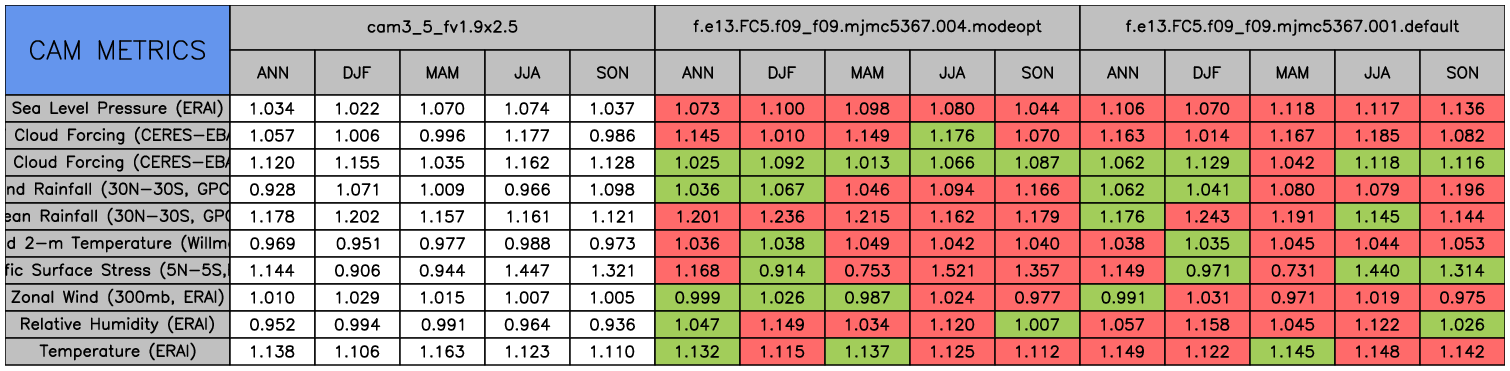
Taylor Diagrams were developed by Karl Taylor at PCMDI (paper|tech note) and aim to condense information about variance and RMSE characteristics of a particular model run when compared with observations in a single diagram. The tables summarize the individual metrics for each variable considered including:
| Space and time | ANN | ||||
|---|---|---|---|---|---|
| Space only | ANN | DJF | MAM | JJA | SON |
| Space and time | correlation | variance | bias |
|---|---|---|---|
| Space only | correlation | variancebias | |
| Time only | correlation |