
cam6ctsm51sp_cam6_3_119zerothtstep_1deg_hist
and
cam6ctsm51sp_cam6_3_119_1deg_hist
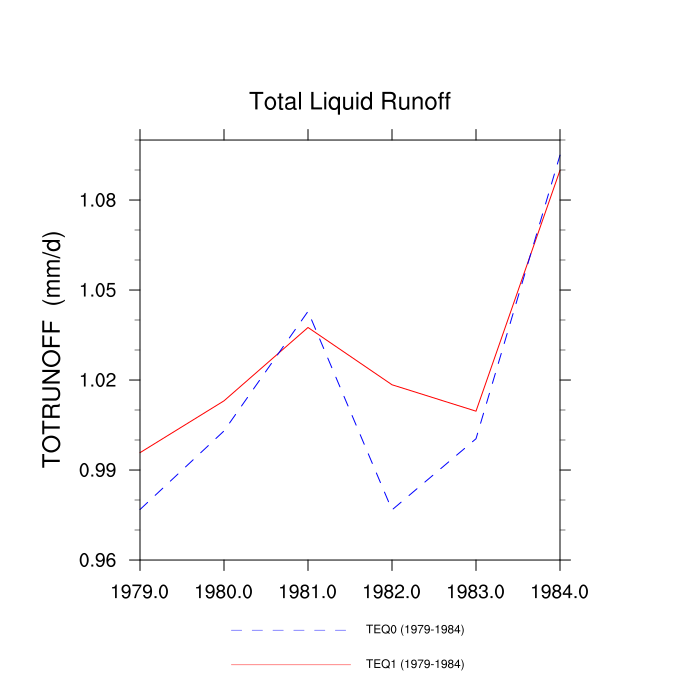
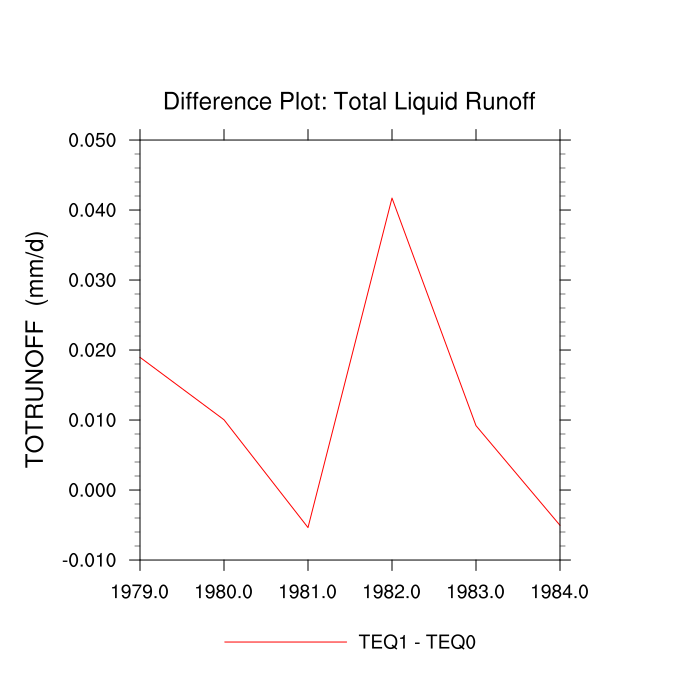
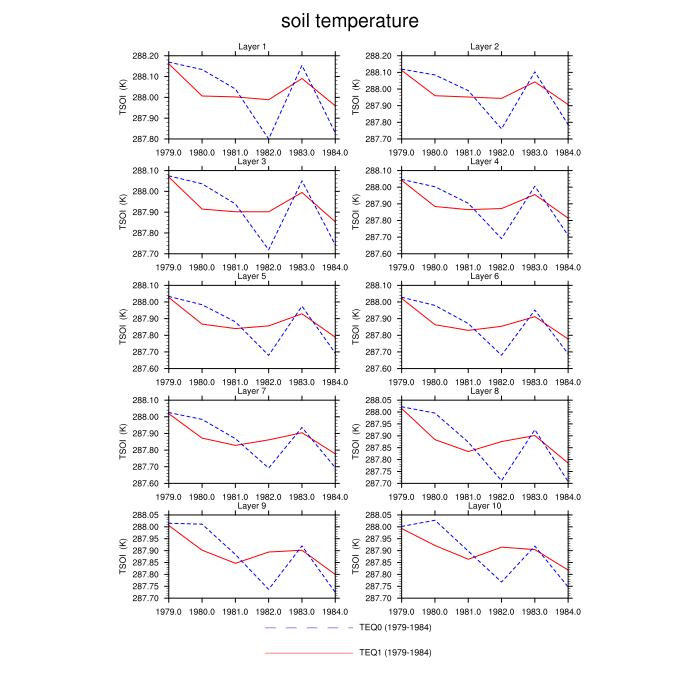
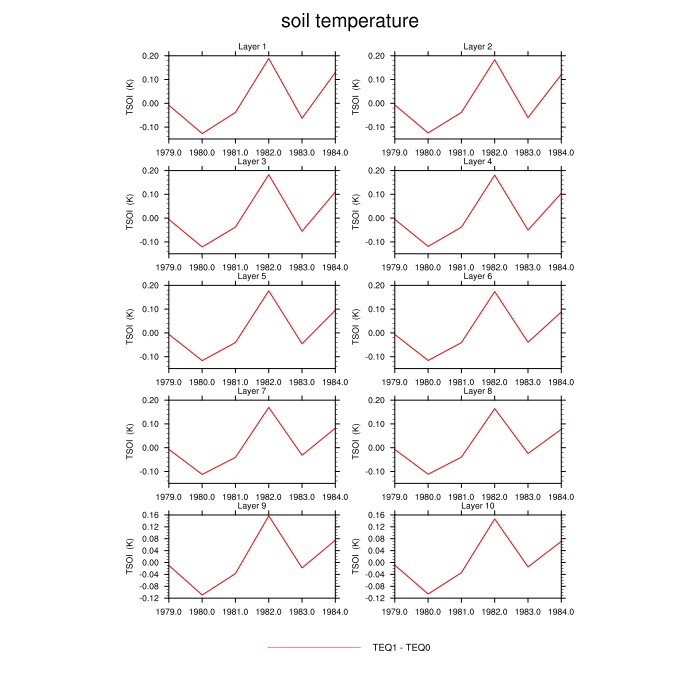
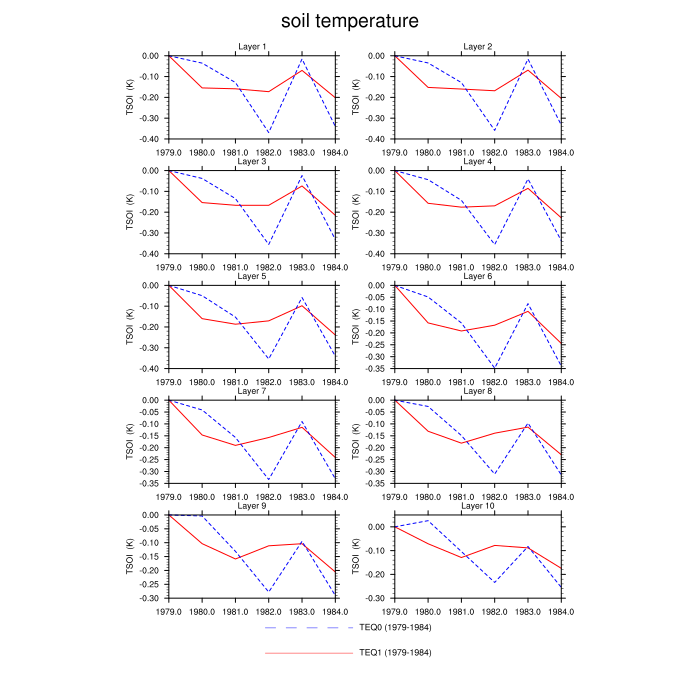
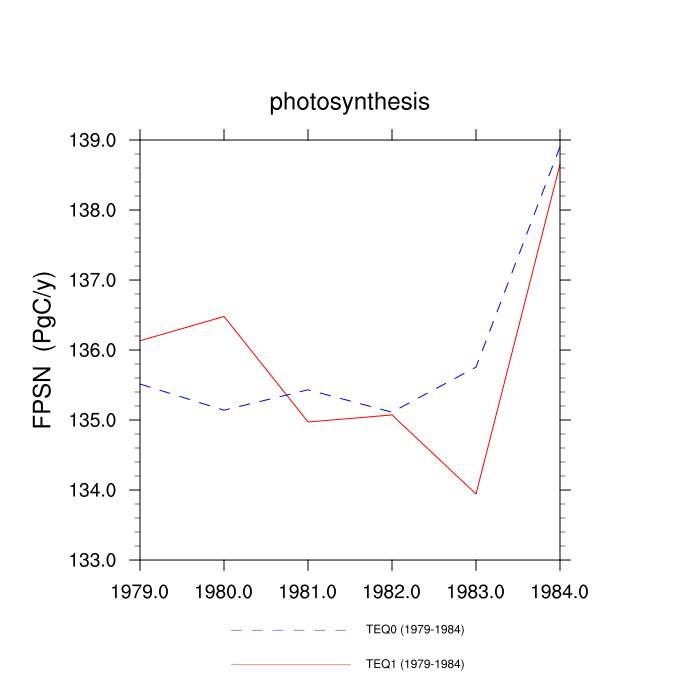
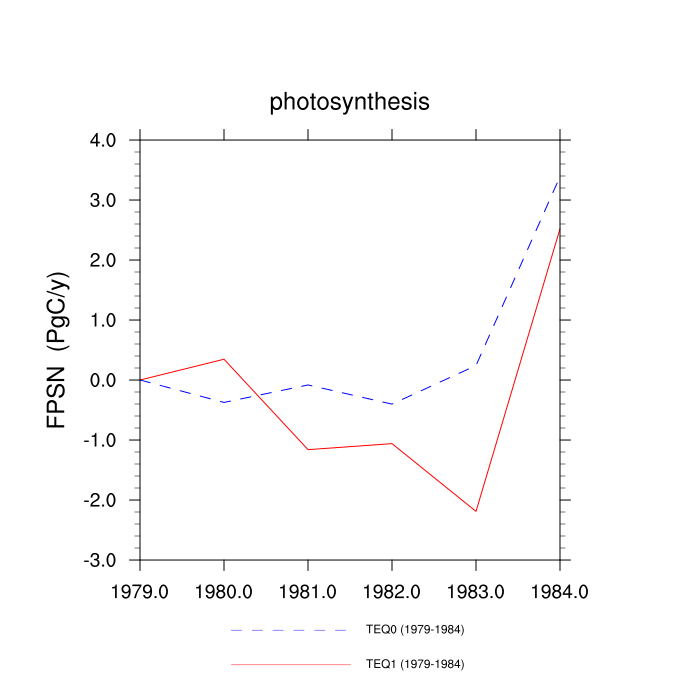
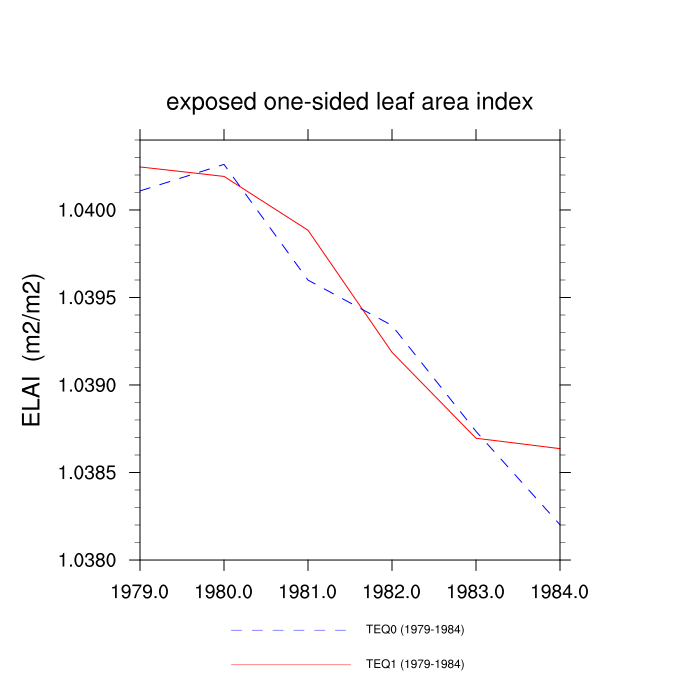
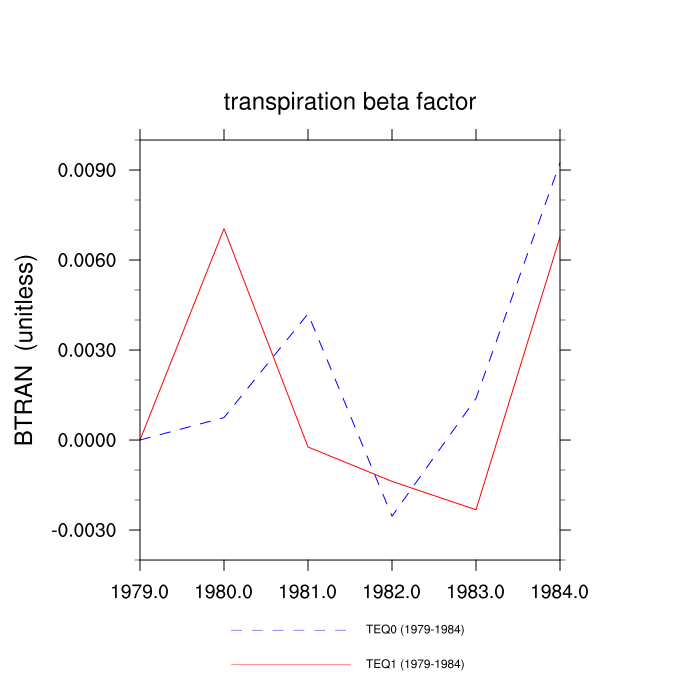
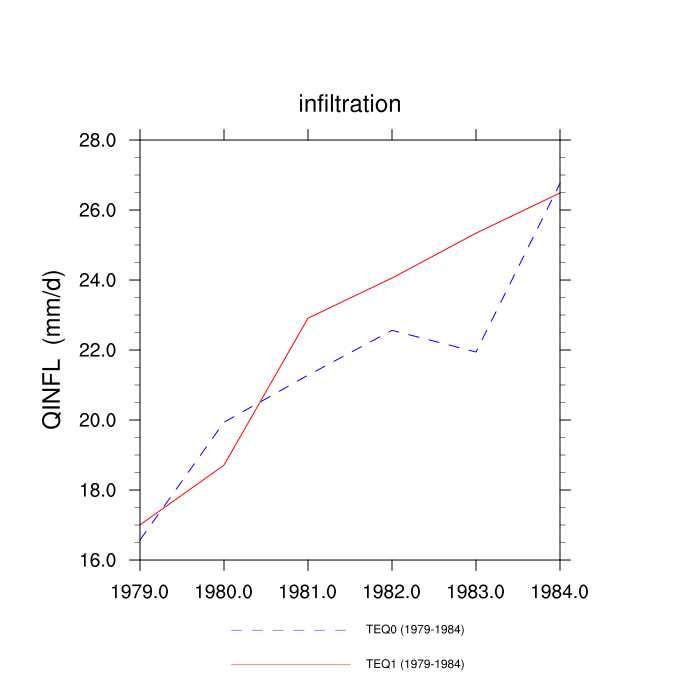
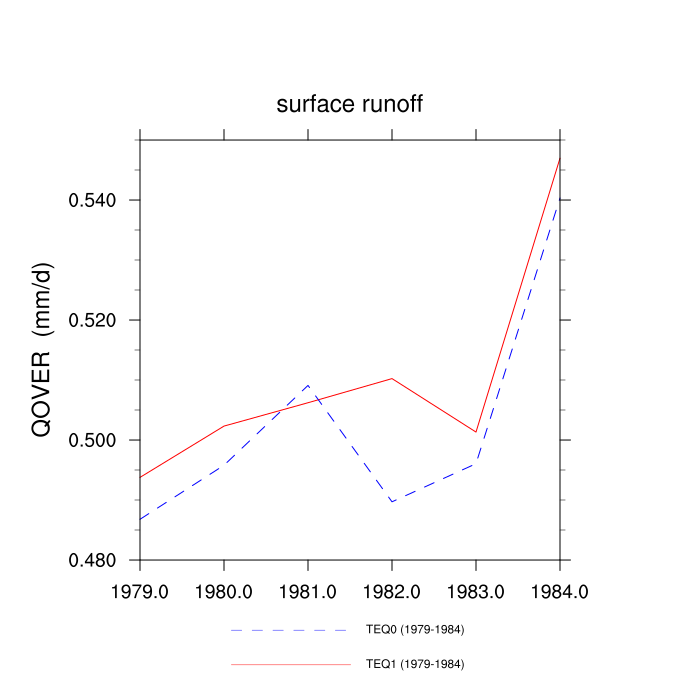
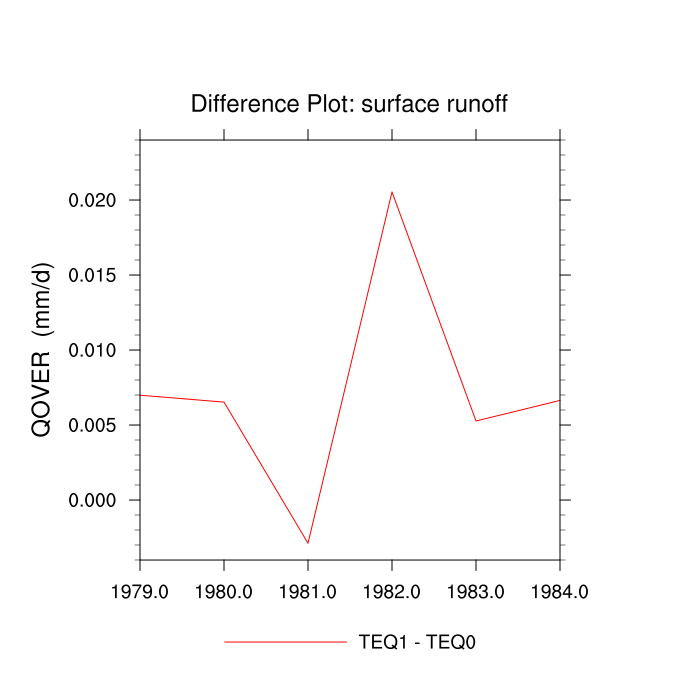
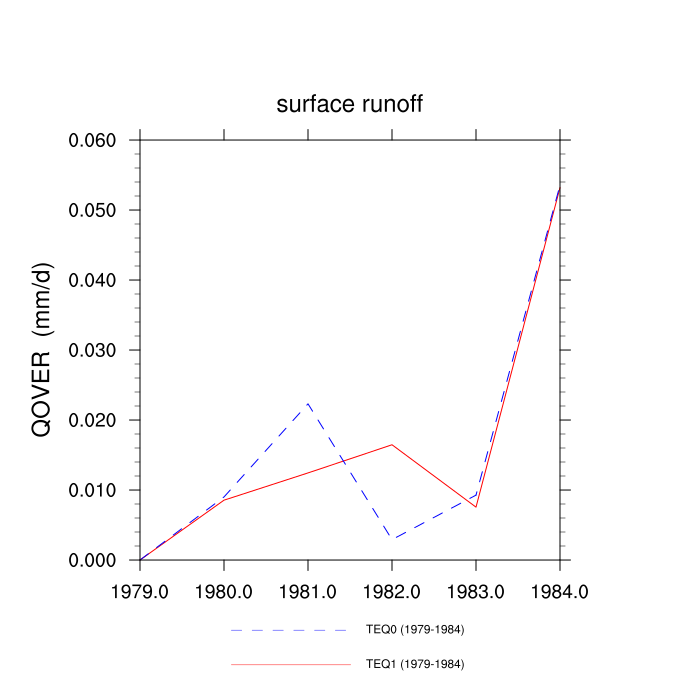
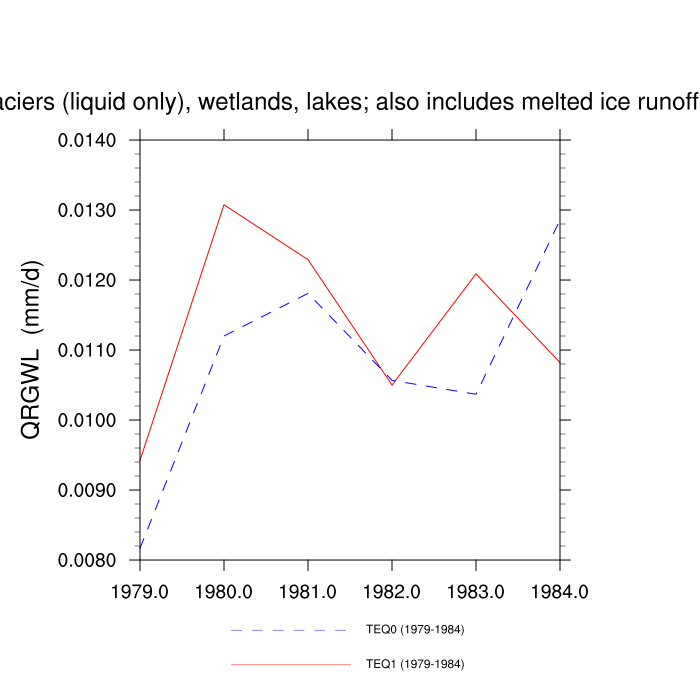
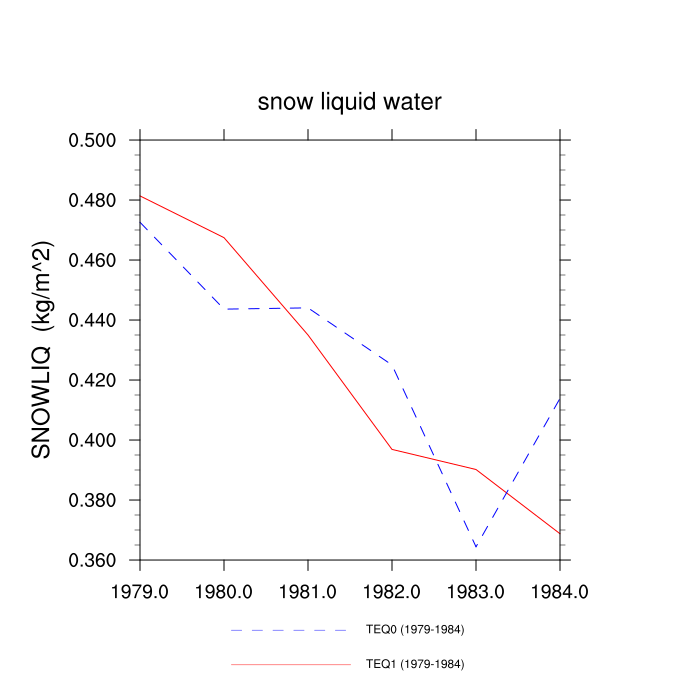
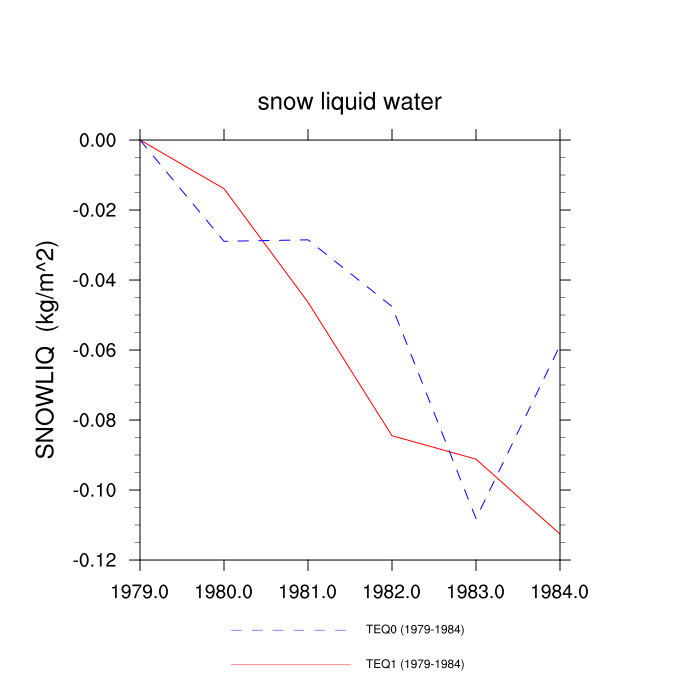
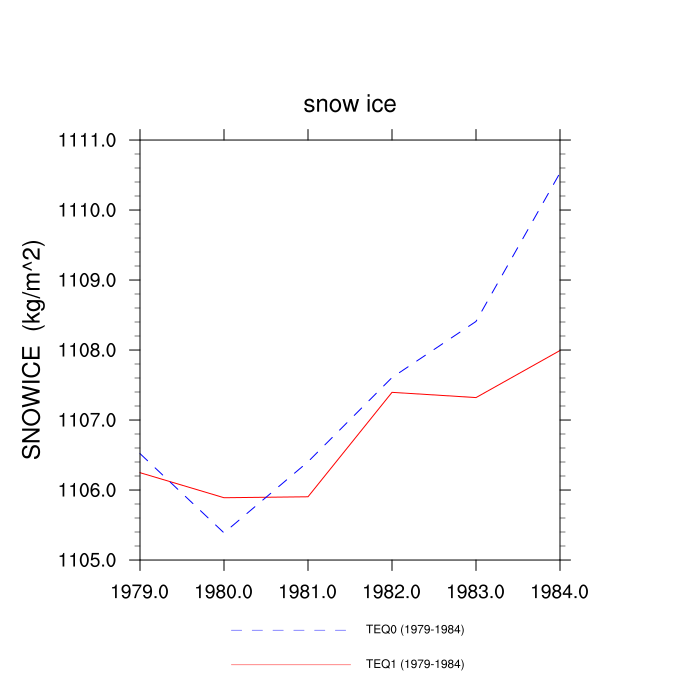
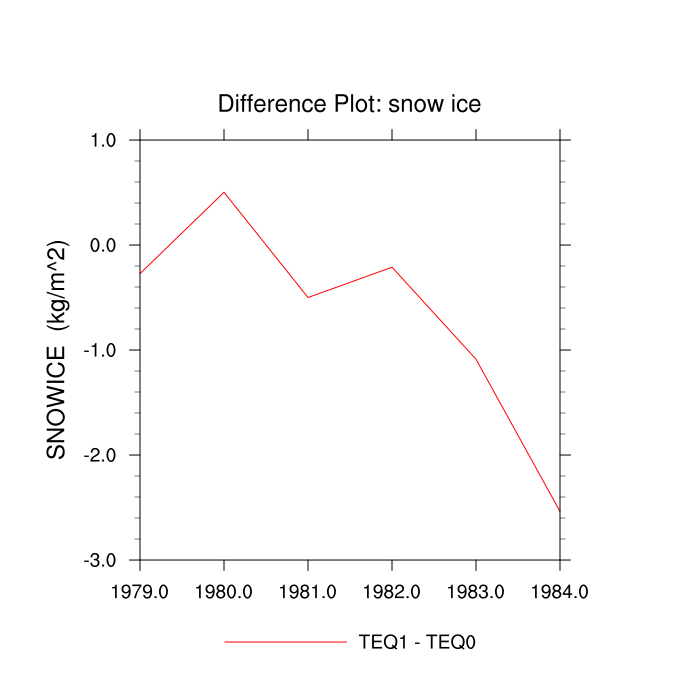
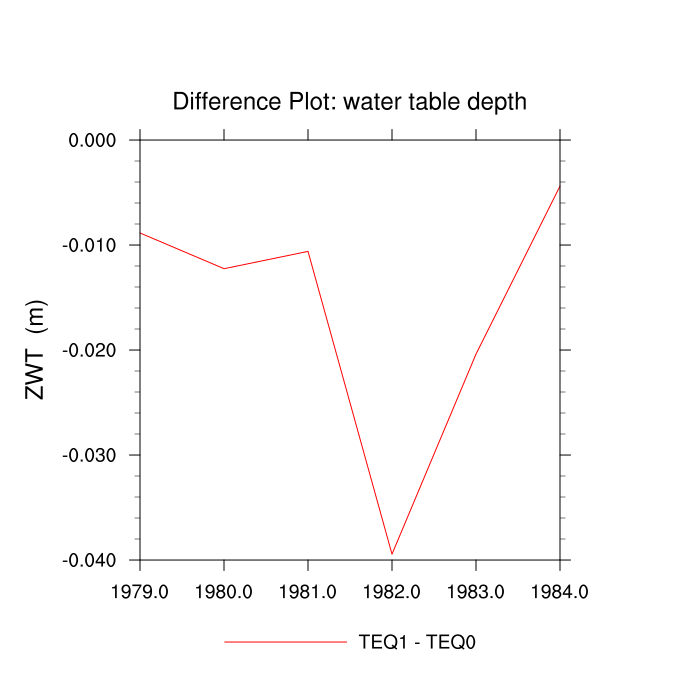
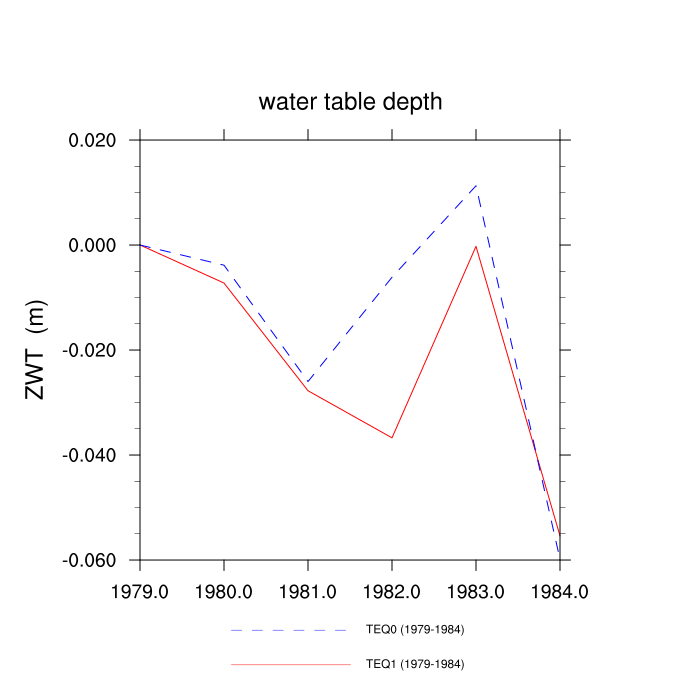
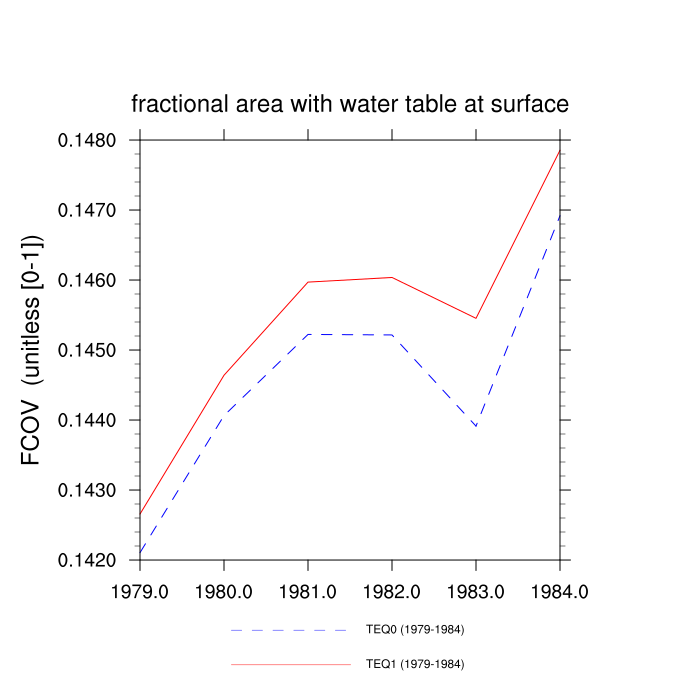
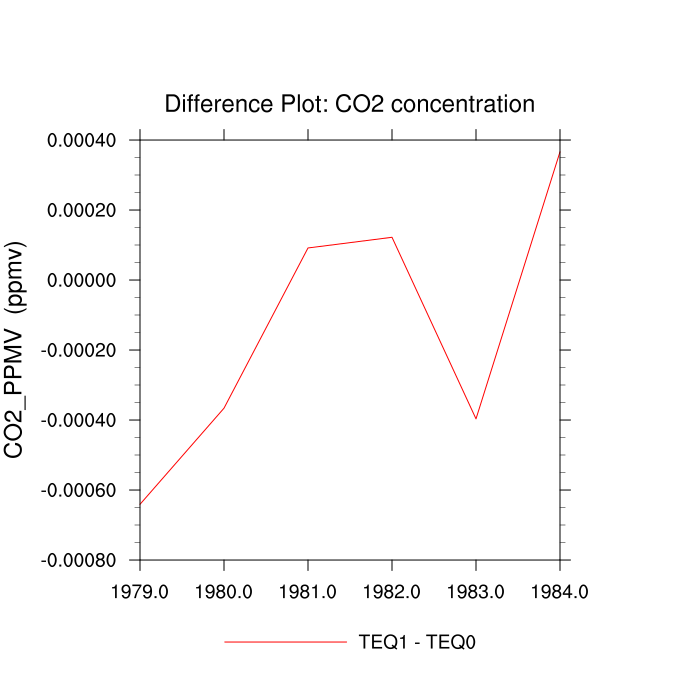
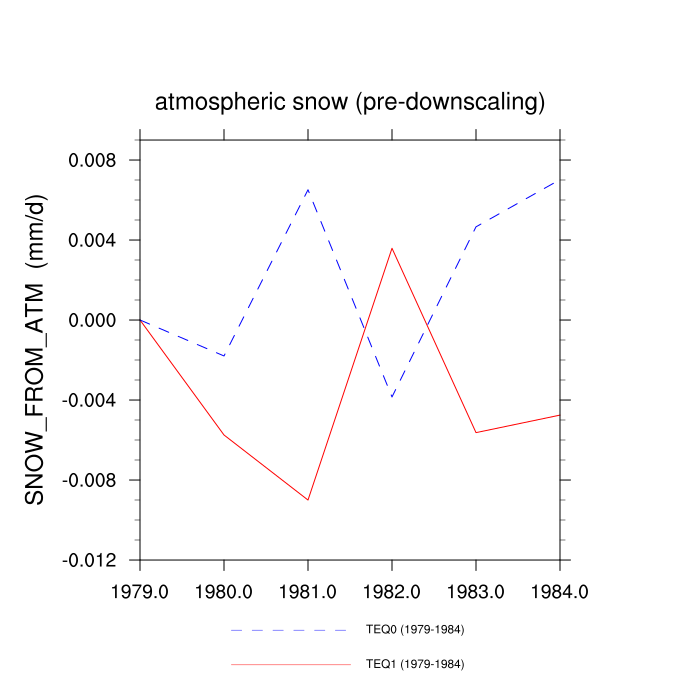
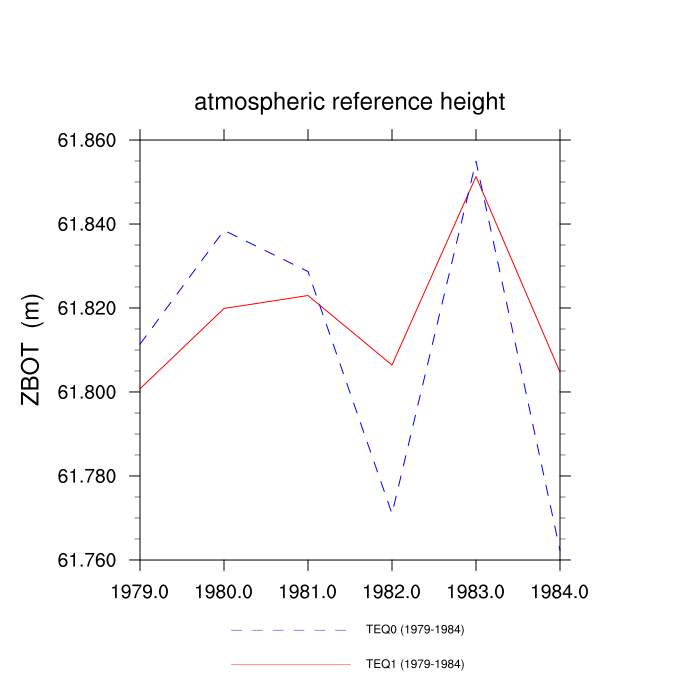
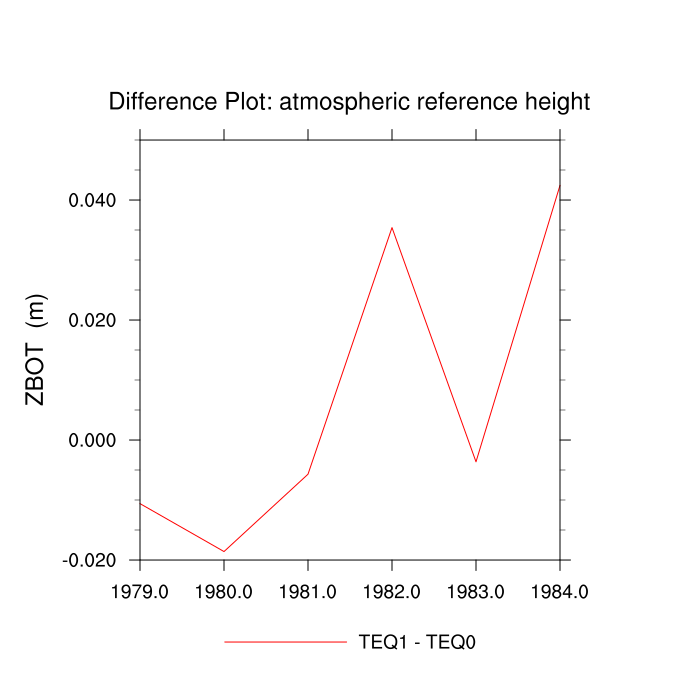
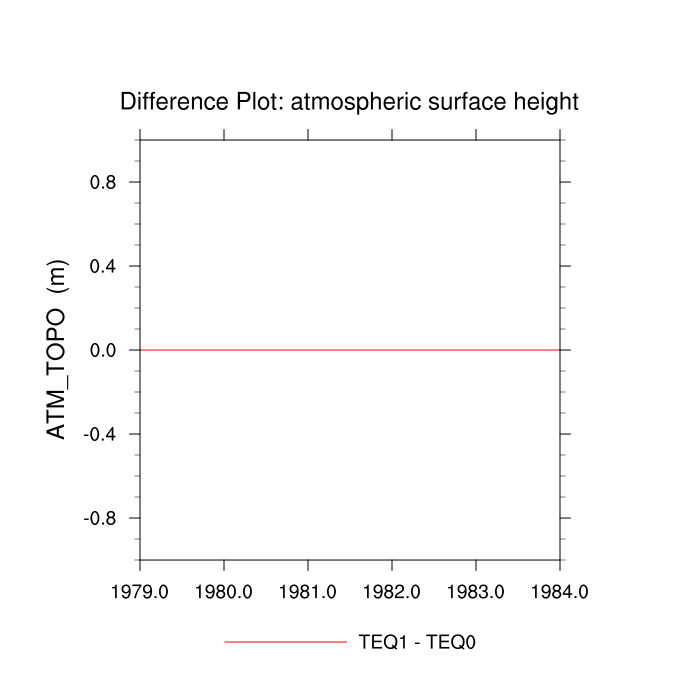
Set 1 Description: Line plots of annual trends in energy balance, soil water/ice and temperature, runoff, snow water/ice, photosynthesis
Lookup Table: Set 1 Variable Definition
| Trend | Difference | Anomaly | |||
|---|---|---|---|---|---|
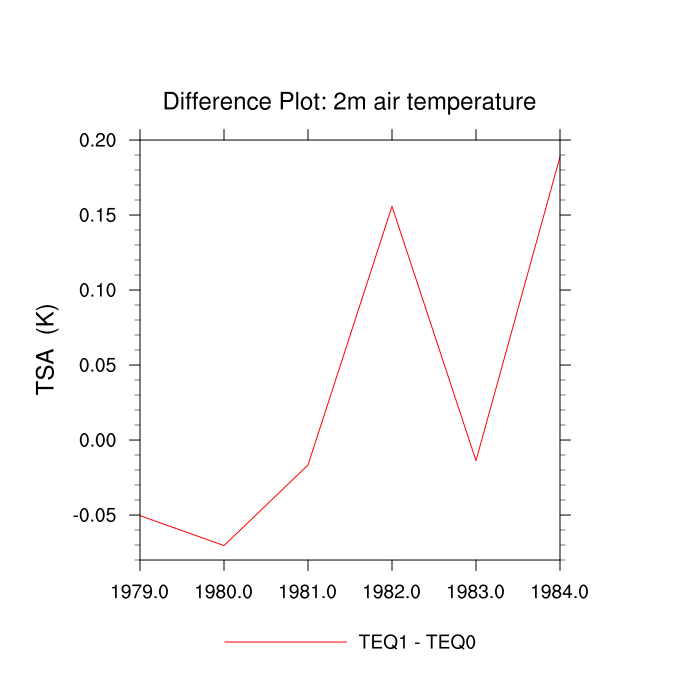
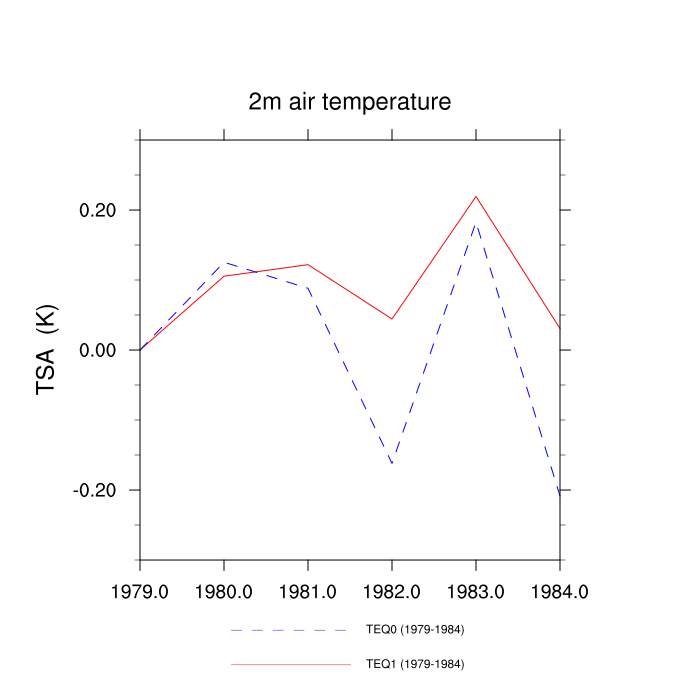
| 2m air temperature (TSA) | TrendPlot | DifferencePlot | AnomalyPlot | ||
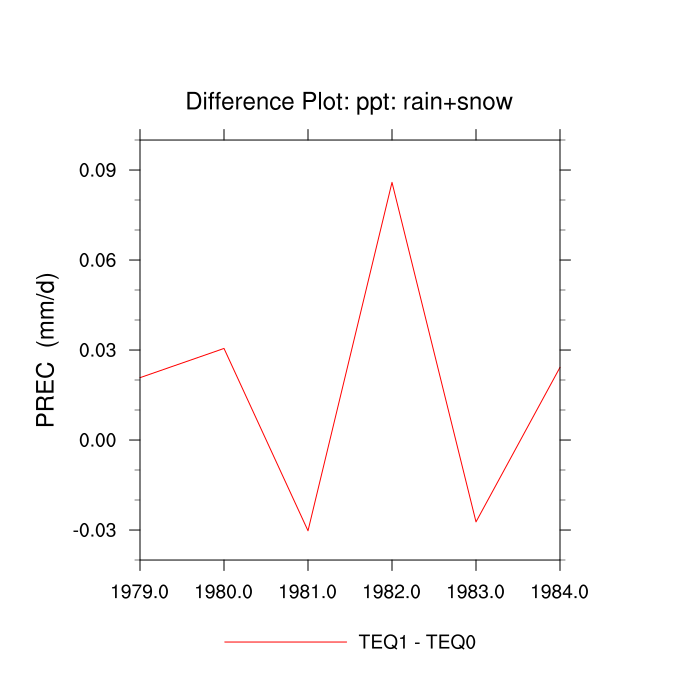
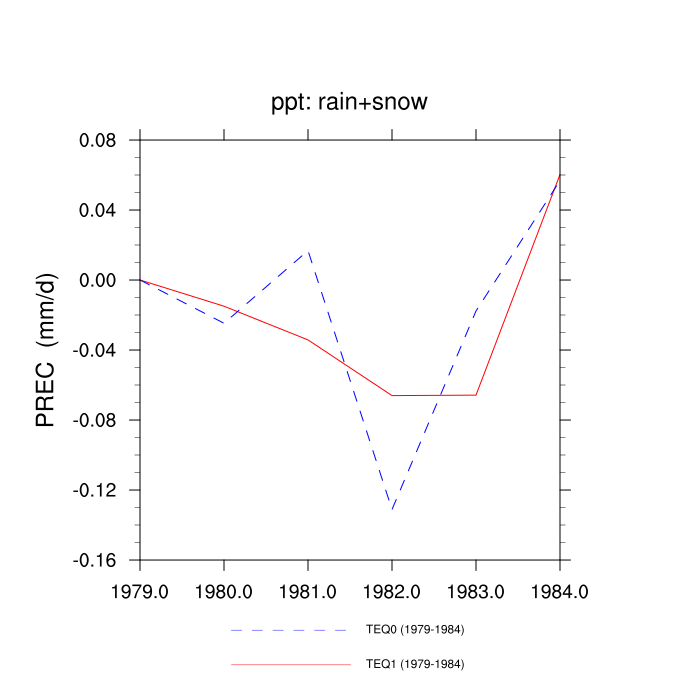
| ppt: rain+snow (PREC) | TrendPlot | DifferencePlot | AnomalyPlot | ||
| Total Liquid Runoff (TOTRUNOFF) | TrendPlot | DifferencePlot | AnomalyPlot | ||
| soil temperature: layers 1,5,10 (TSOI) | TrendPlot | DifferencePlot | AnomalyPlot | ||
| photosynthesis (FPSN) | TrendPlot | DifferencePlot | AnomalyPlot | ||
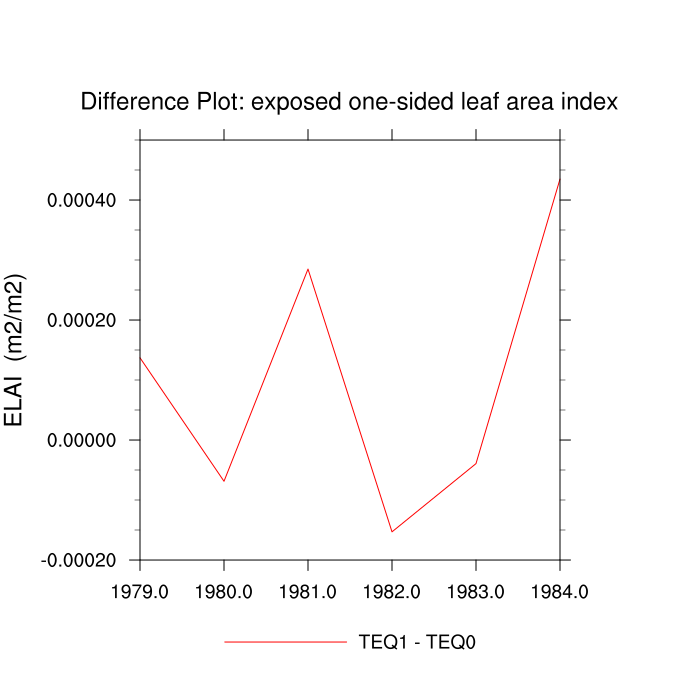
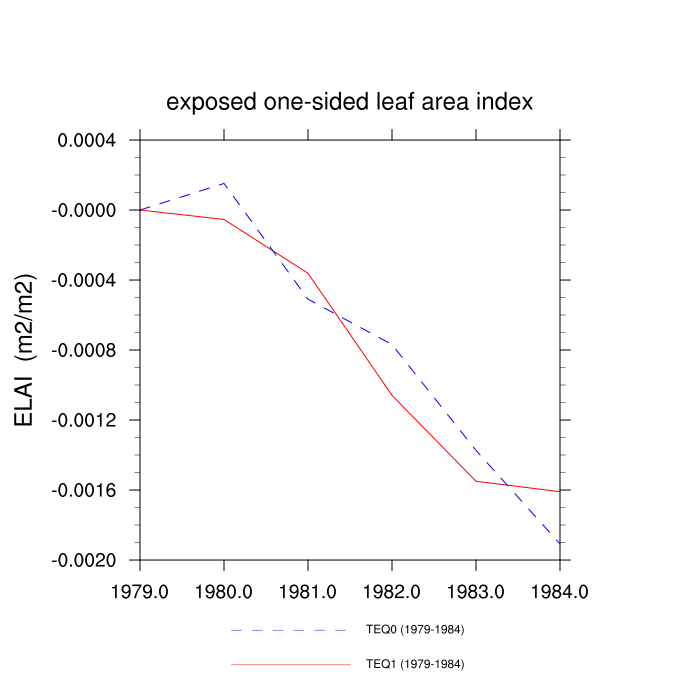
| exposed one-sided leaf area index (ELAI) | TrendPlot | DifferencePlot | AnomalyPlot | ||
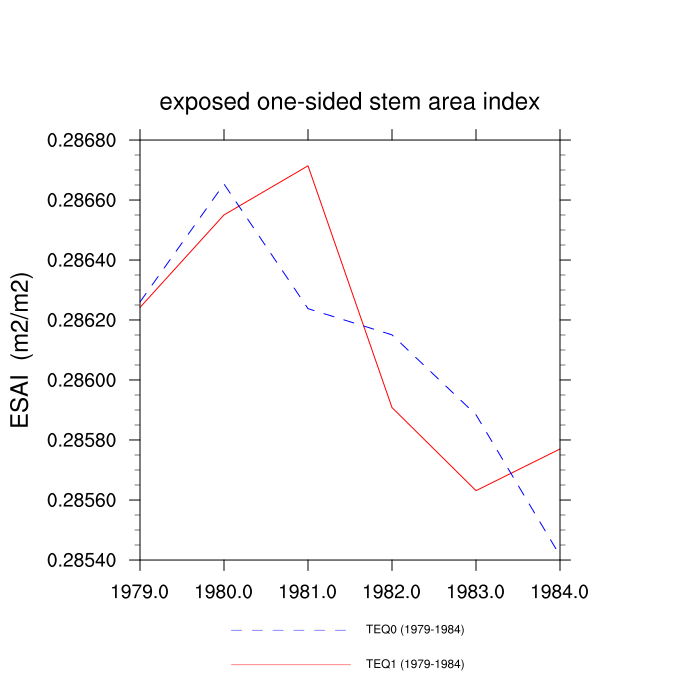
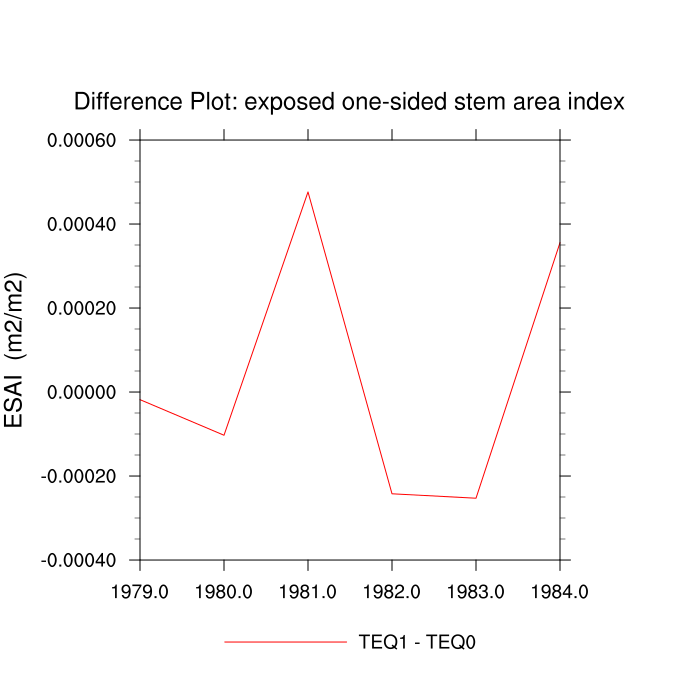
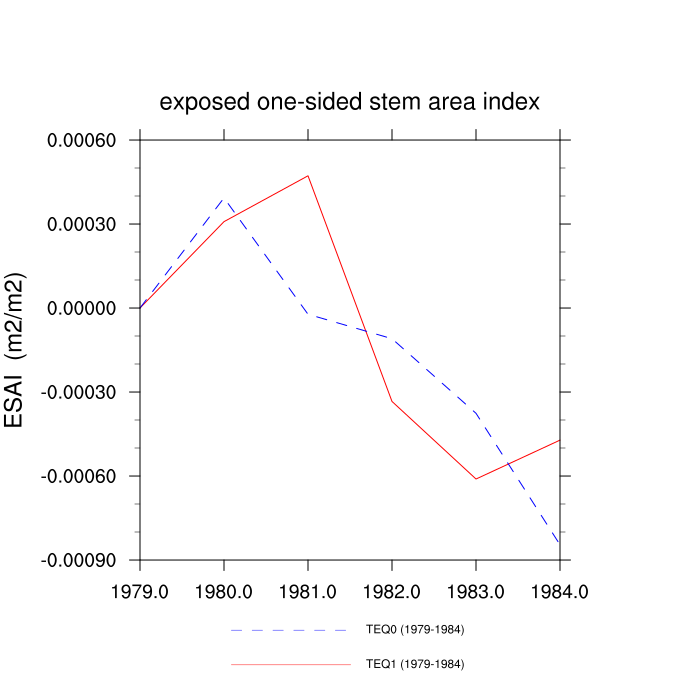
| exposed one-sided stem area index (ESAI) | TrendPlot | DifferencePlot | AnomalyPlot | ||
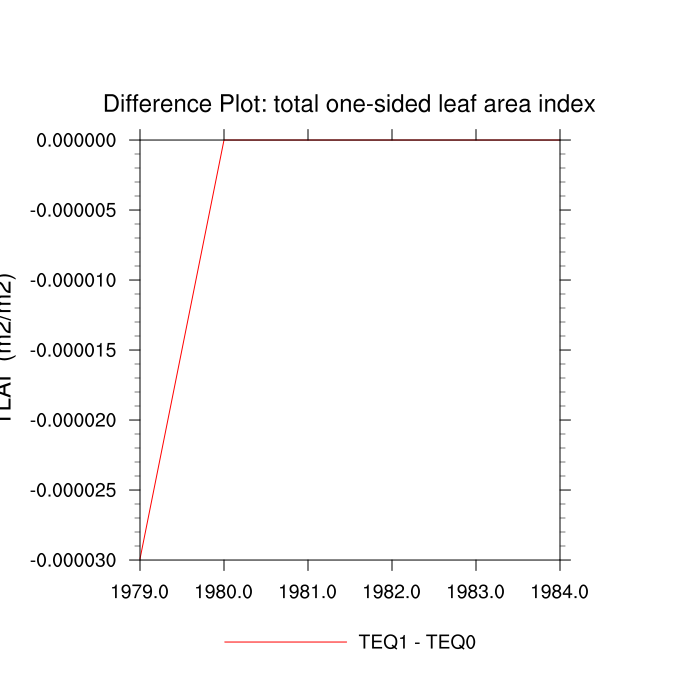
| total one-sided leaf area index (TLAI) | TrendPlot | DifferencePlot | AnomalyPlot | ||
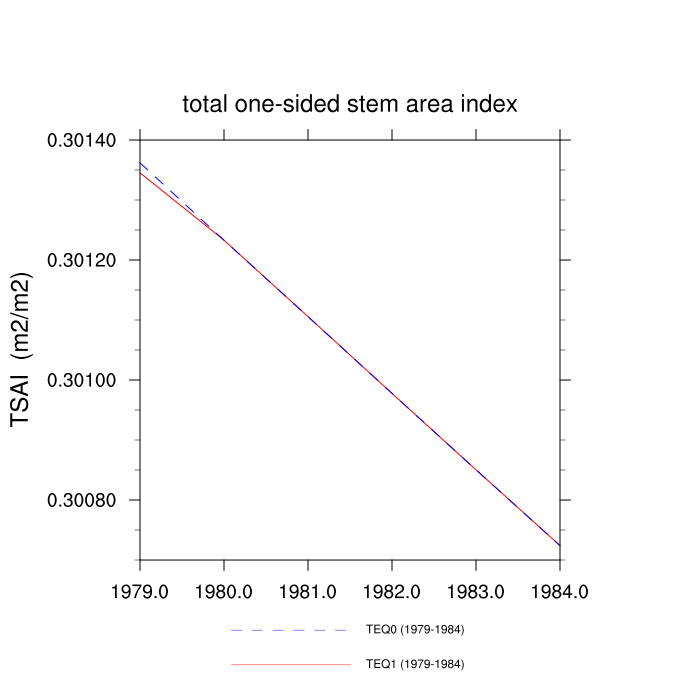
| total one-sided stem area index (TSAI) | TrendPlot | DifferencePlot | AnomalyPlot | ||
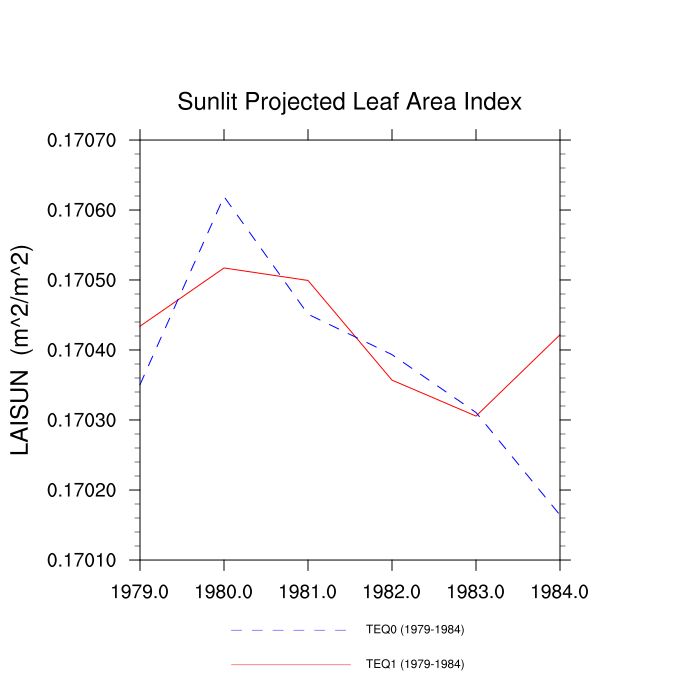
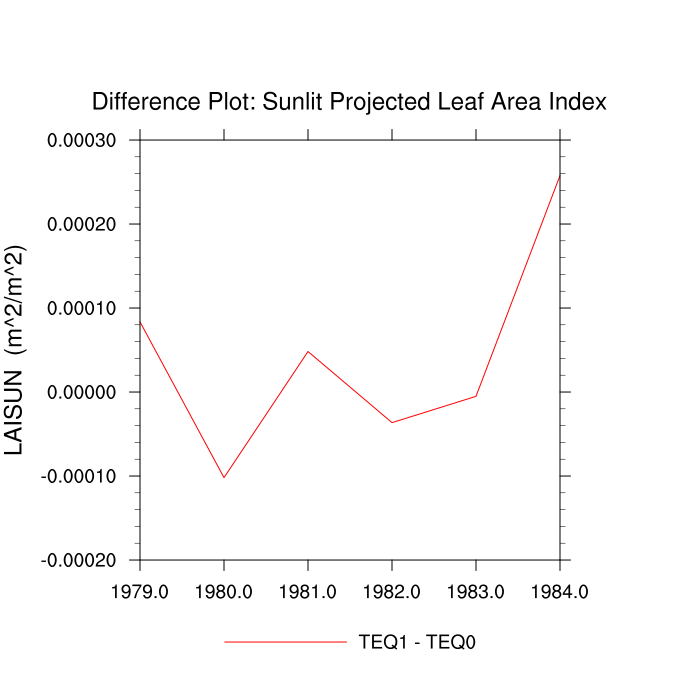
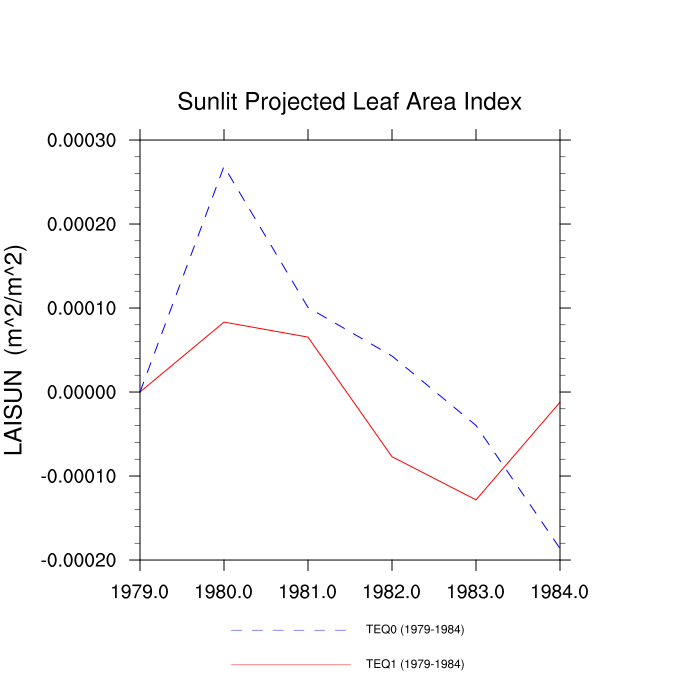
| Sunlit Projected Leaf Area Index (LAISUN) | TrendPlot | DifferencePlot | AnomalyPlot | ||
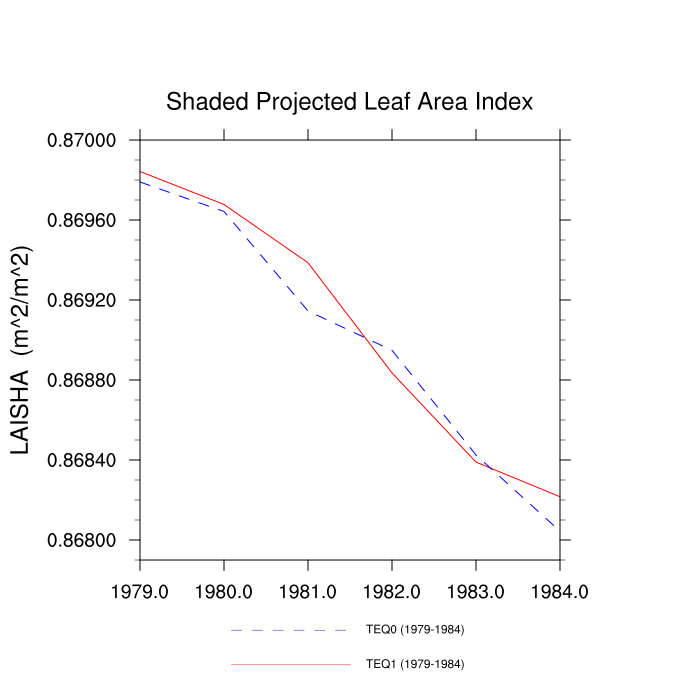
| Shaded Projected Leaf Area Index (LAISHA) | TrendPlot | DifferencePlot | AnomalyPlot | ||
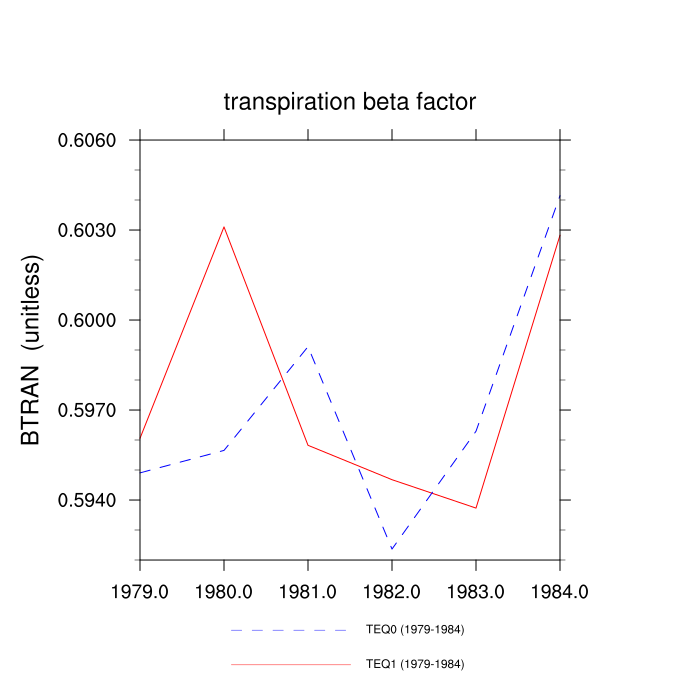
| transpiration beta factor (BTRAN) | TrendPlot | DifferencePlot | AnomalyPlot | ||
| infiltration (QINFL) | TrendPlot | DifferencePlot | AnomalyPlot | ||
| surface runoff (QOVER) | TrendPlot | DifferencePlot | AnomalyPlot | ||
| 0 (QIRRIG) | --- | --- | --- | ||
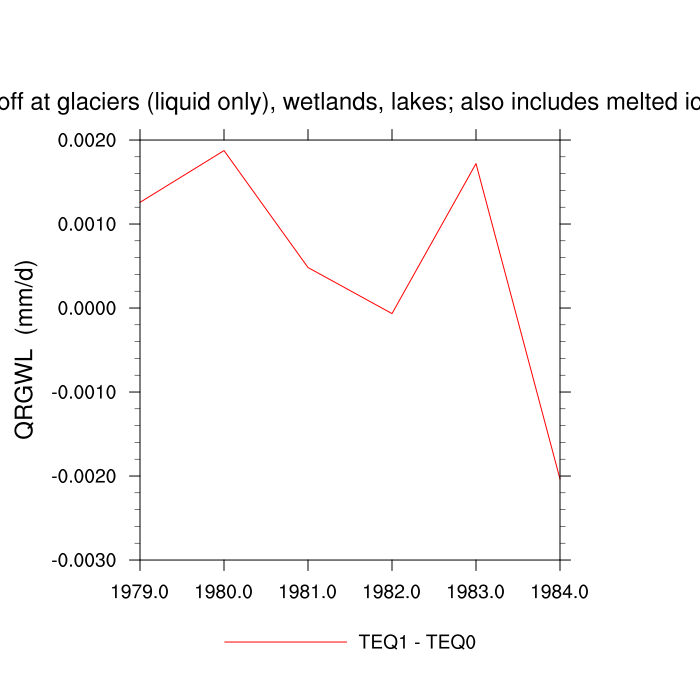
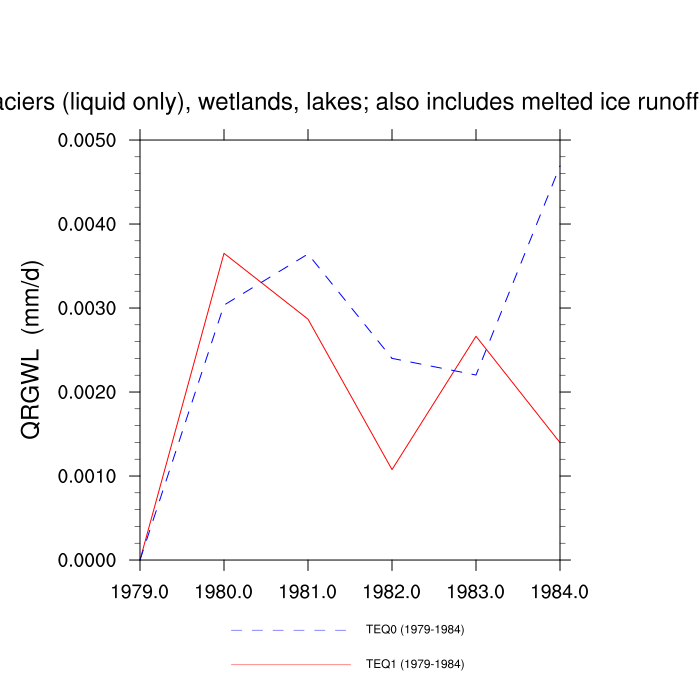
| surface runoff at glaciers (liquid only), wetlands, lakes; also includes melted ice runoff from QSNWCPICE (QRGWL) | TrendPlot | DifferencePlot | AnomalyPlot | ||
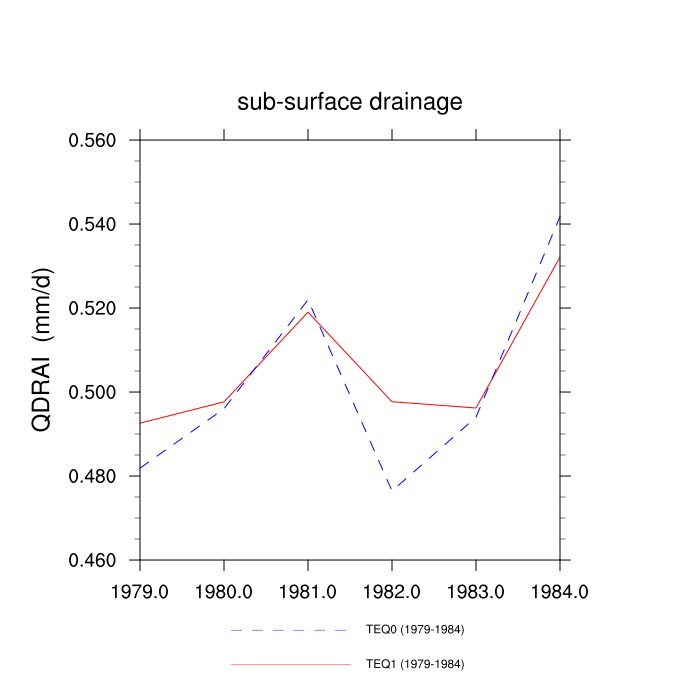
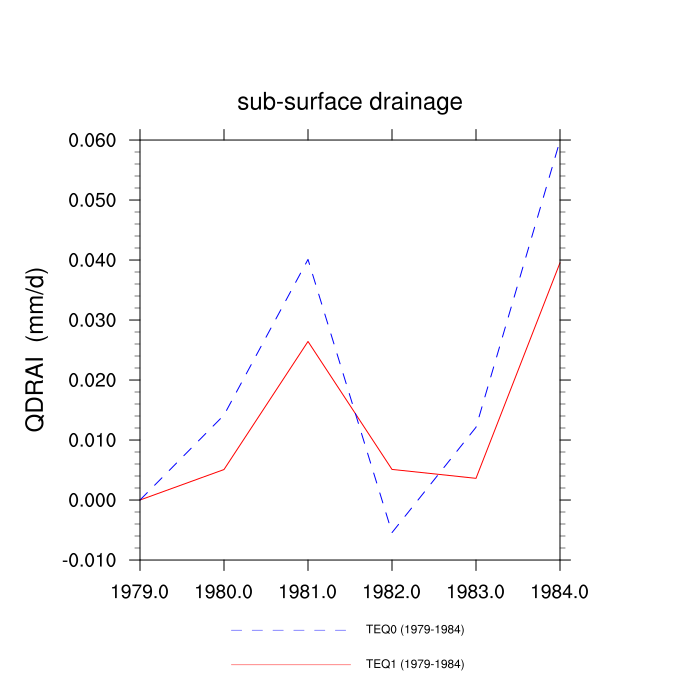
| sub-surface drainage (QDRAI) | TrendPlot | DifferencePlot | AnomalyPlot | ||
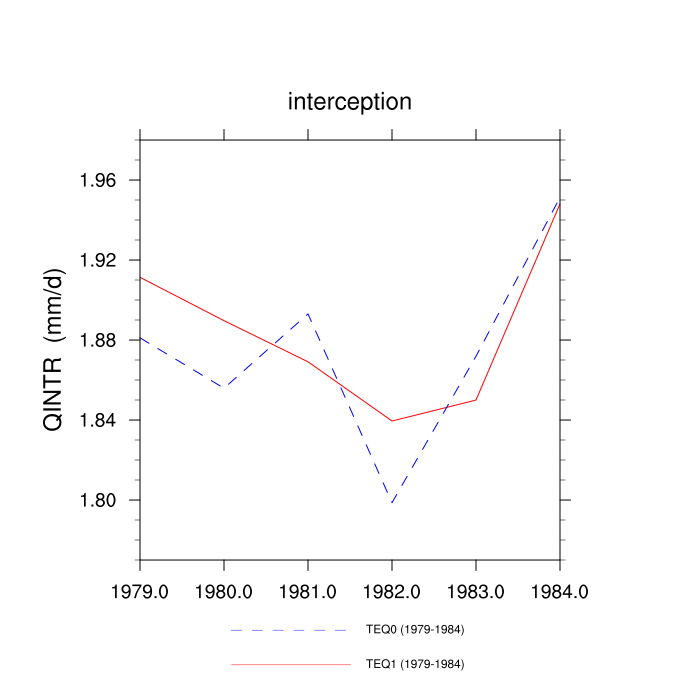
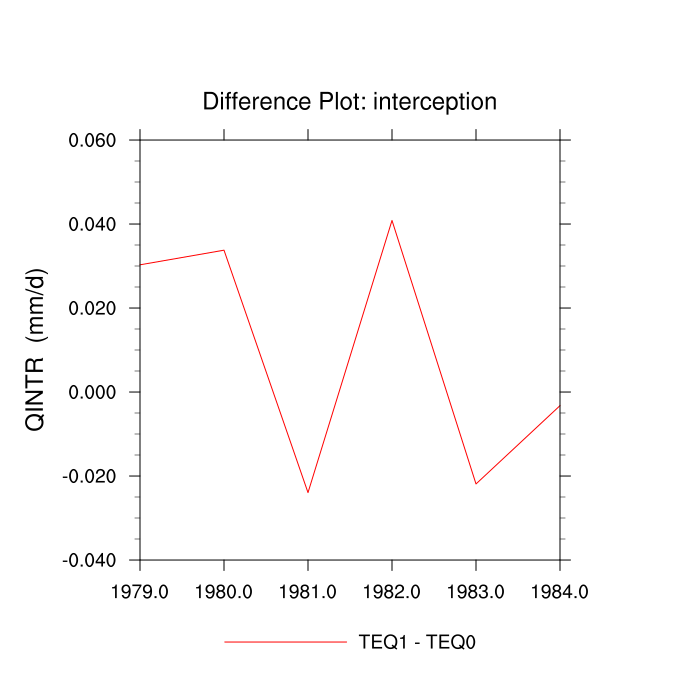
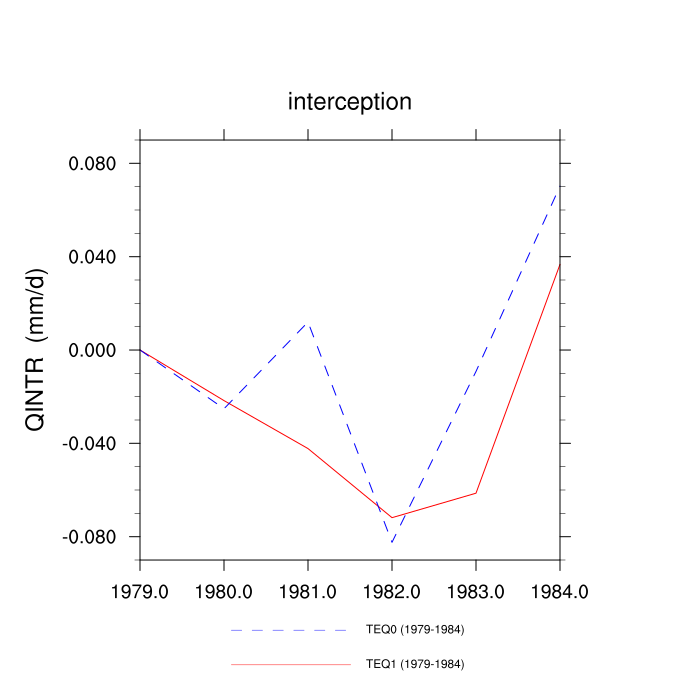
| interception (QINTR) | TrendPlot | DifferencePlot | AnomalyPlot | ||
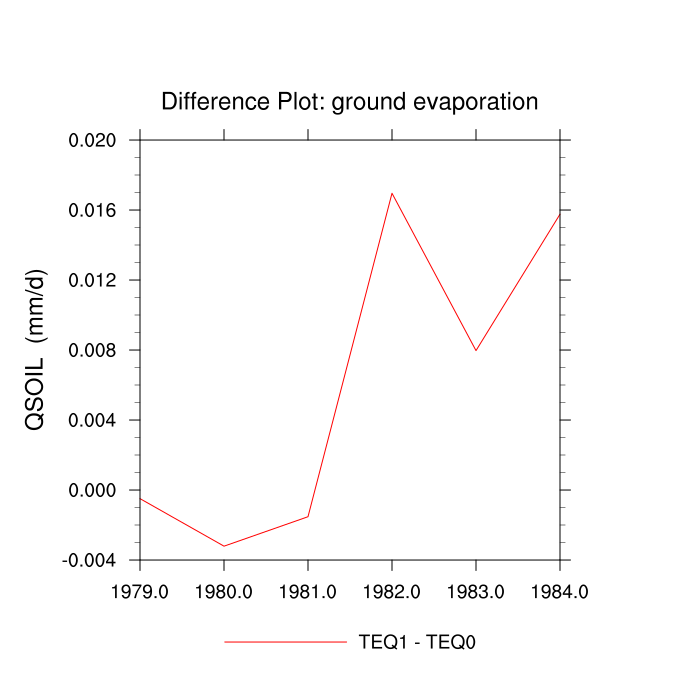
| ground evaporation (QSOIL) | TrendPlot | DifferencePlot | AnomalyPlot | ||
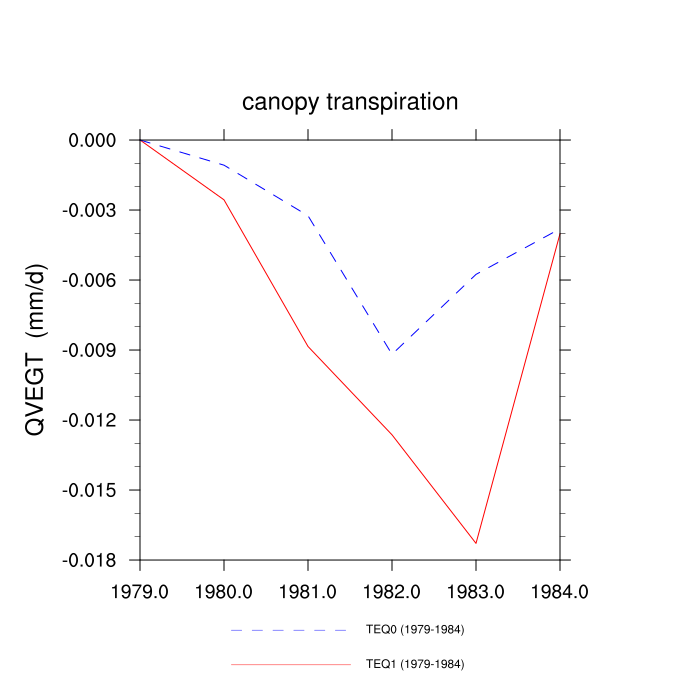
| canopy transpiration (QVEGT) | TrendPlot | DifferencePlot | AnomalyPlot | ||
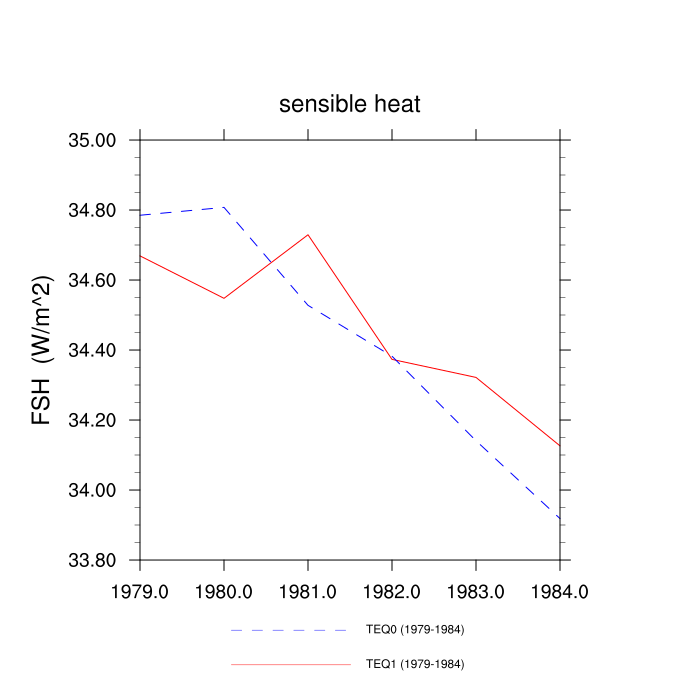
| sensible heat (FSH) | TrendPlot | DifferencePlot | AnomalyPlot | ||
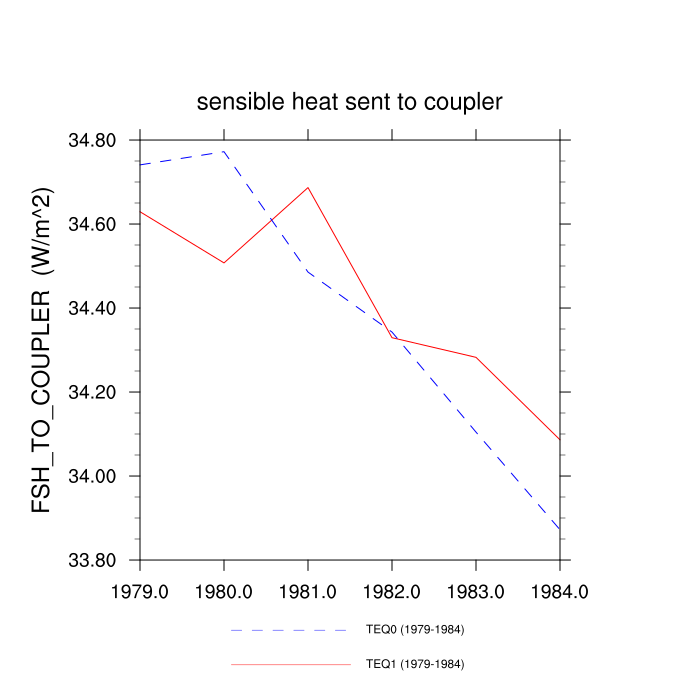
| sensible heat sent to coupler (FSH_TO_COUPLER) | TrendPlot | DifferencePlot | AnomalyPlot | ||
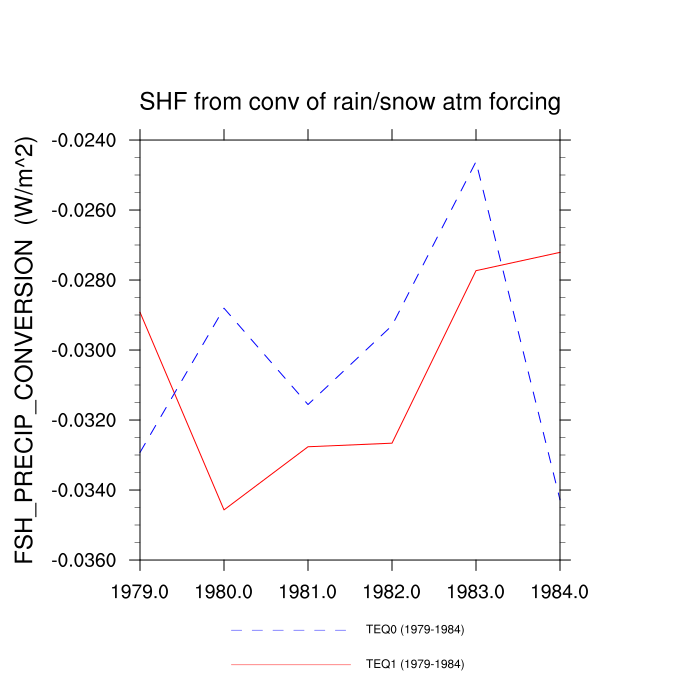
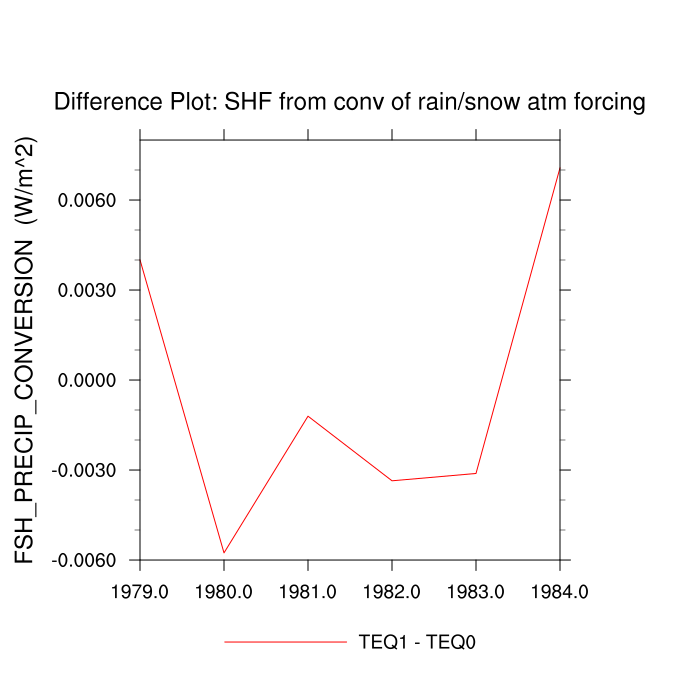
| SHF from conv of rain/snow atm forcing (FSH_PRECIP_CONVERSION) | TrendPlot | DifferencePlot | AnomalyPlot | ||
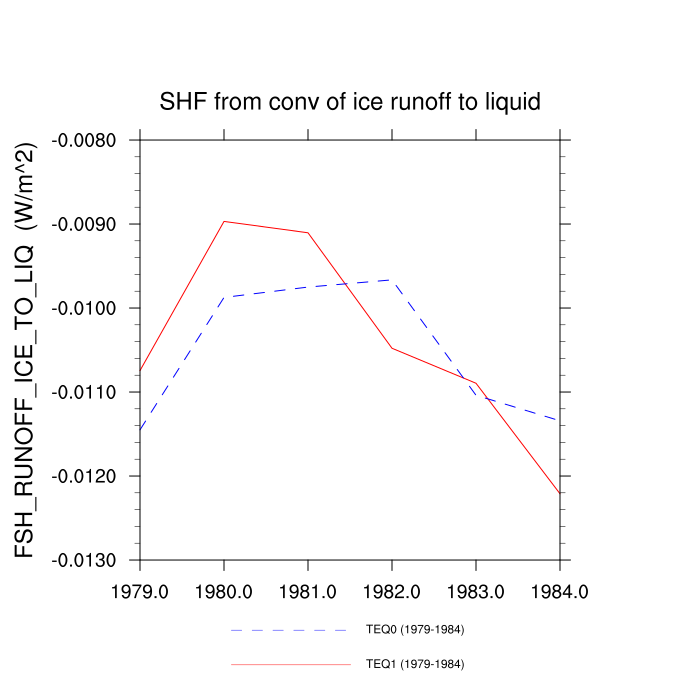
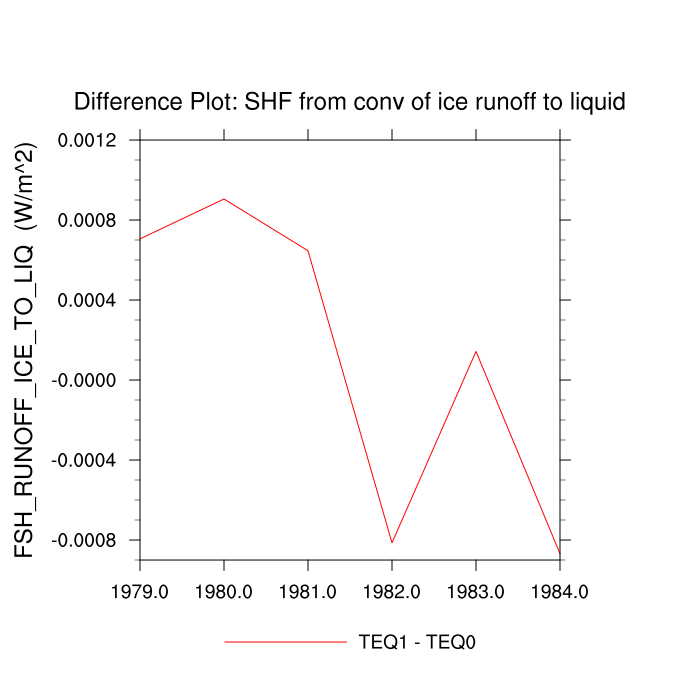
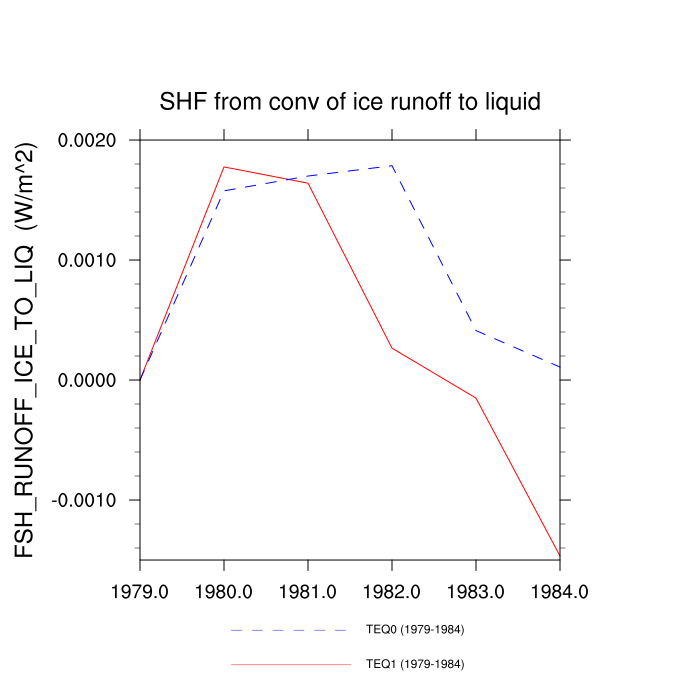
| SHF from conv of ice runoff to liquid (FSH_RUNOFF_ICE_TO_LIQ) | TrendPlot | DifferencePlot | AnomalyPlot | ||
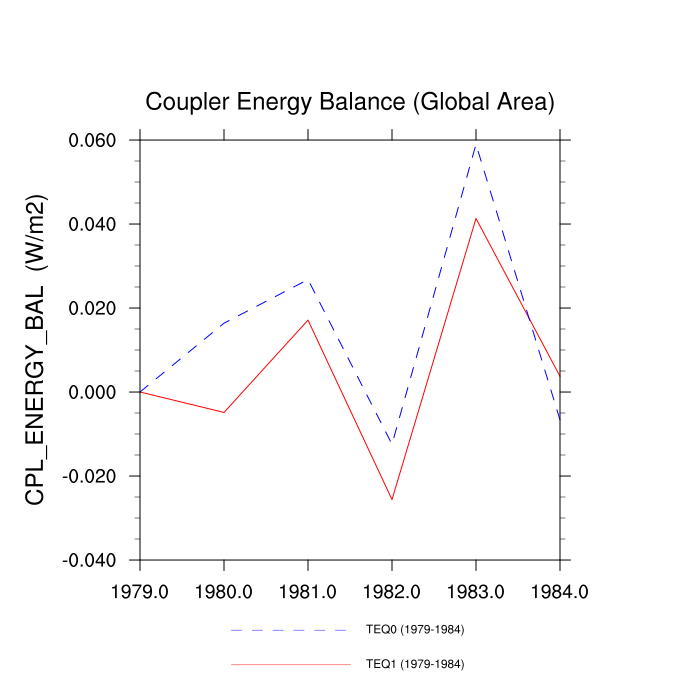
| Coupler Energy Balance (Global Area) (CPL_ENERGY_BAL) | TrendPlot | DifferencePlot | AnomalyPlot | ||
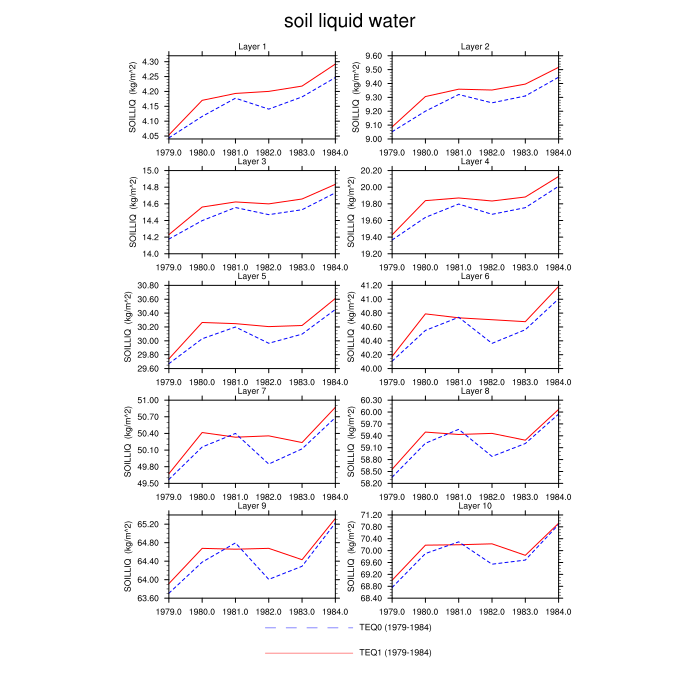
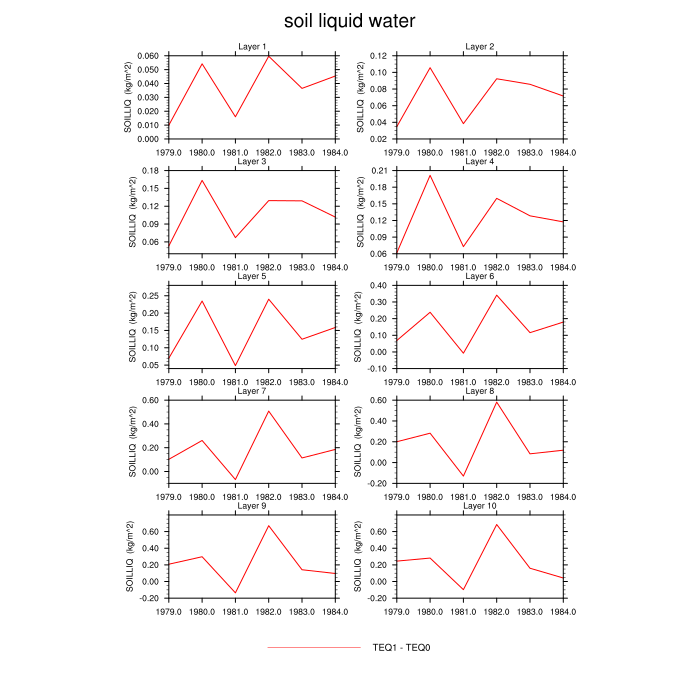
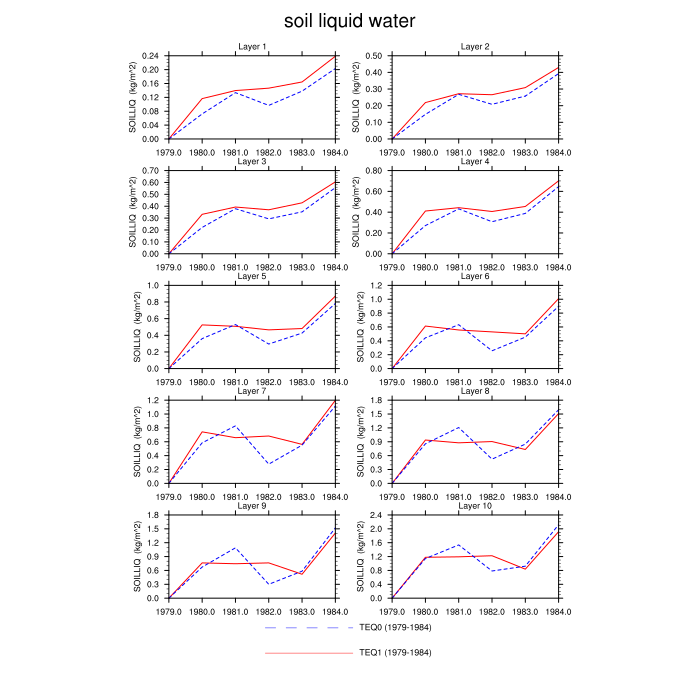
| soil liquid water: layers 1,5,10 (SOILLIQ) | TrendPlot | DifferencePlot | AnomalyPlot | ||
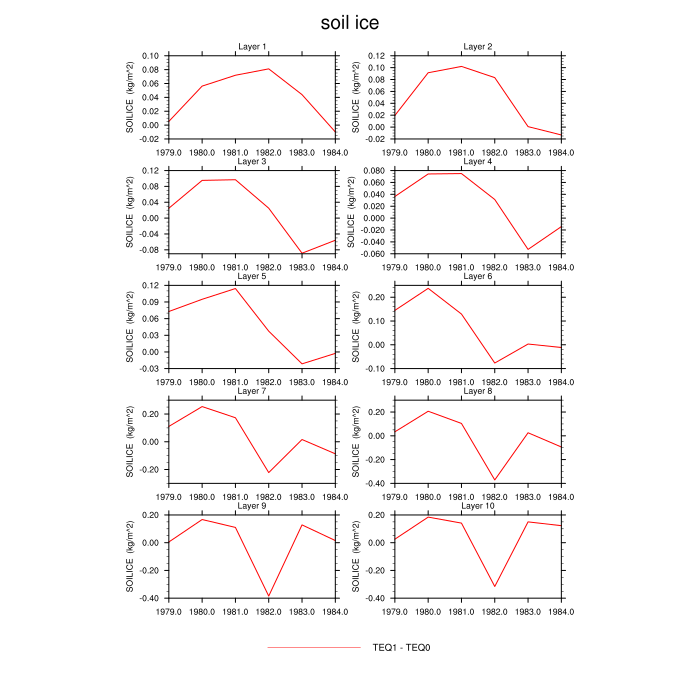
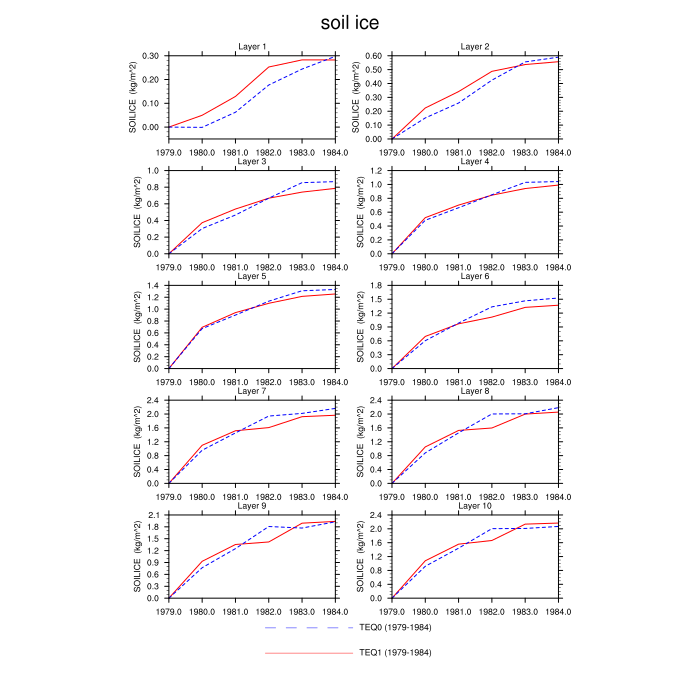
| soil ice: layers 1,5,10 (SOILICE) | TrendPlot | DifferencePlot | AnomalyPlot | ||
| Soil Water Potential in Each Soil Layer (SOILPSI) | --- | --- | --- | ||
| snow liquid water (SNOWLIQ) | TrendPlot | DifferencePlot | AnomalyPlot | ||
| snow ice (SNOWICE) | TrendPlot | DifferencePlot | AnomalyPlot | ||
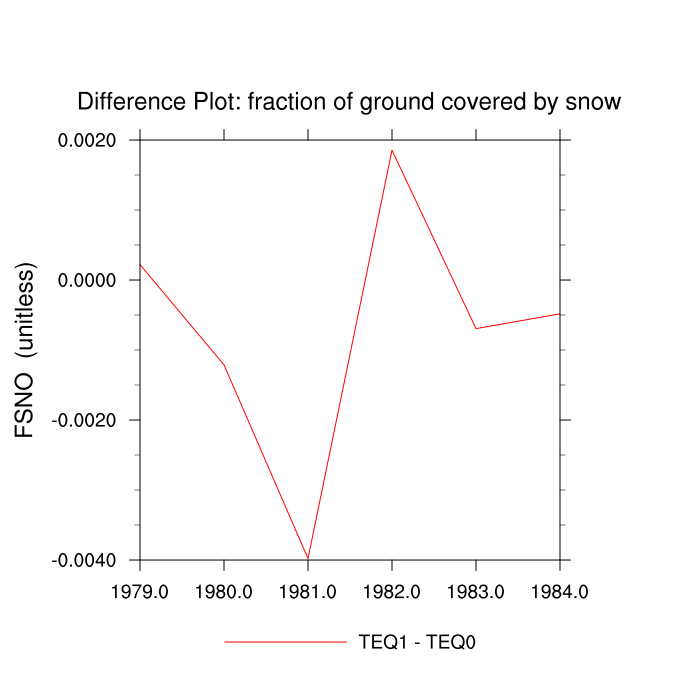
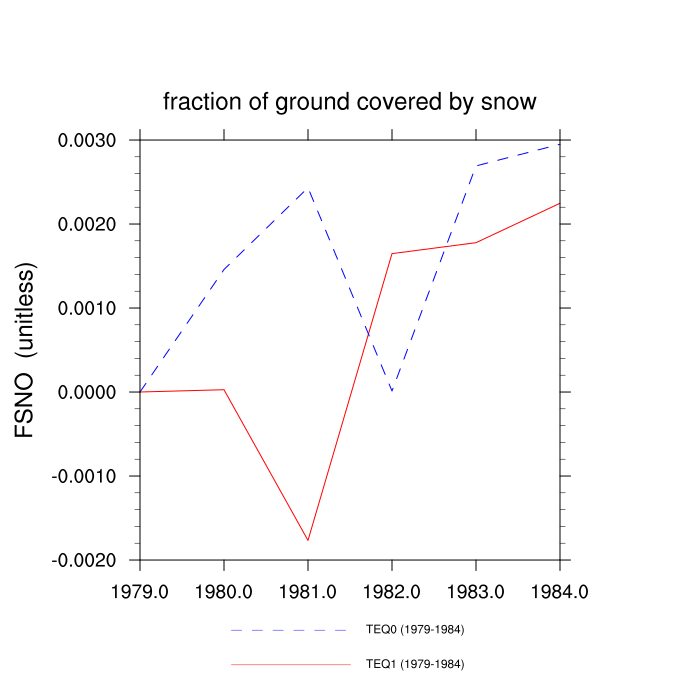
| fraction of ground covered by snow (FSNO) | TrendPlot | DifferencePlot | AnomalyPlot | ||
| total snow water equiv (SNOWICE + SNOWLIQ) (H2OSNO) | TrendPlot | DifferencePlot | AnomalyPlot | ||
| total soil liquid water (TOTSOILLIQ) | TrendPlot | DifferencePlot | AnomalyPlot | ||
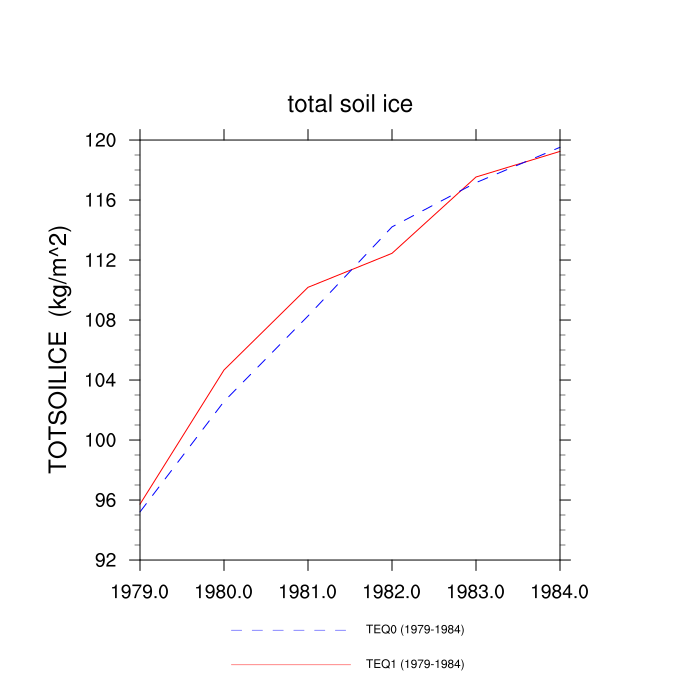
| total soil ice (TOTSOILICE) | TrendPlot | DifferencePlot | AnomalyPlot | ||
| water in the unconfined aquifer (WA) | --- | --- | --- | ||
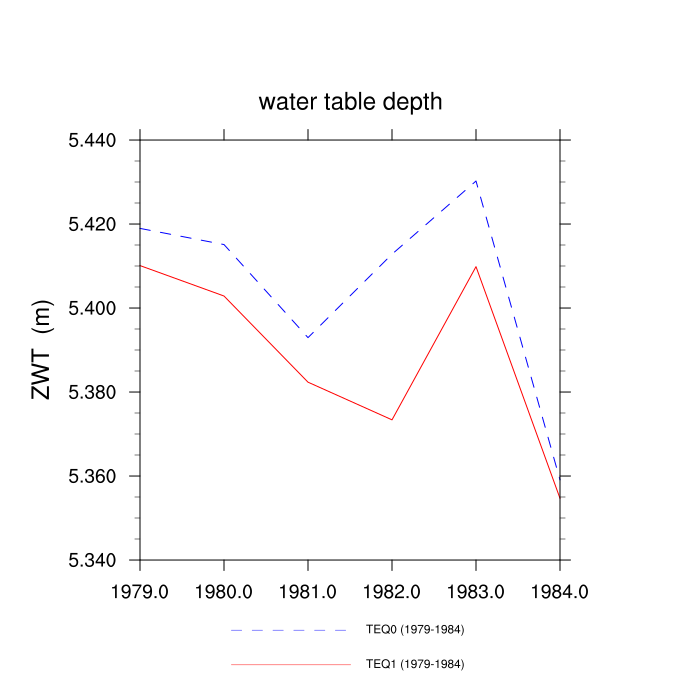
| water table depth (ZWT) | TrendPlot | DifferencePlot | AnomalyPlot | ||
| aquifer recharge rate (QCHARGE) | --- | --- | --- | ||
| fractional area with water table at surface (FCOV) | TrendPlot | DifferencePlot | AnomalyPlot | ||
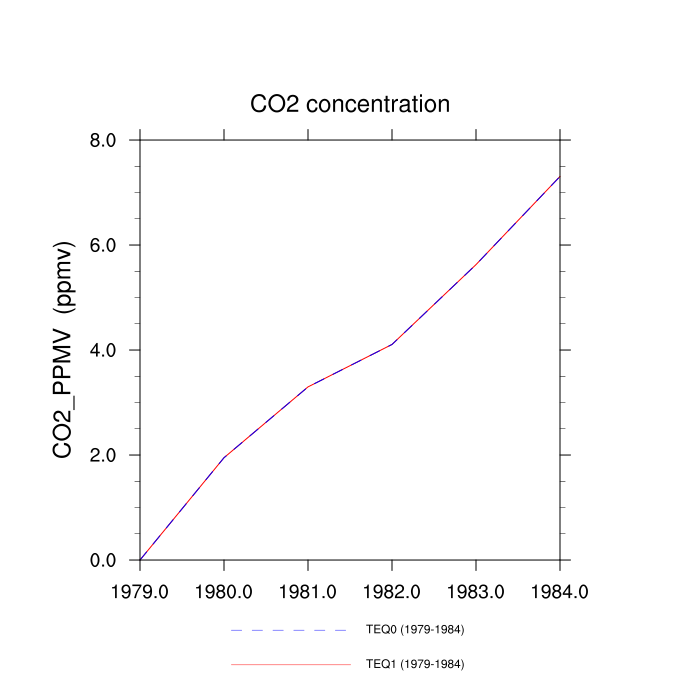
| CO2 concentration (CO2_PPMV) | TrendPlot | DifferencePlot | AnomalyPlot | ||
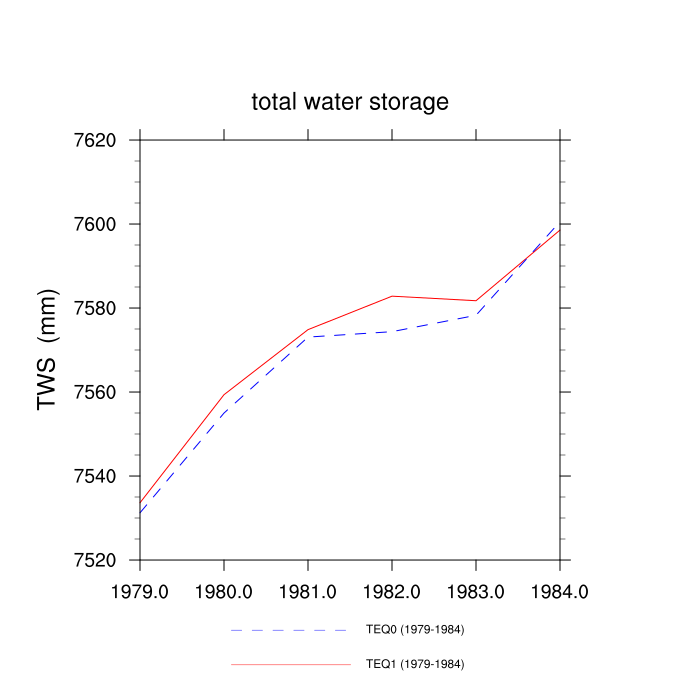
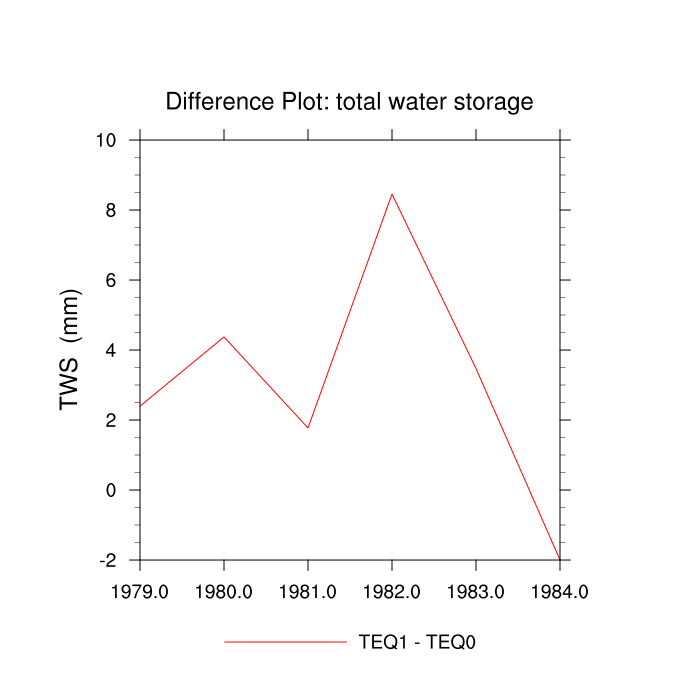
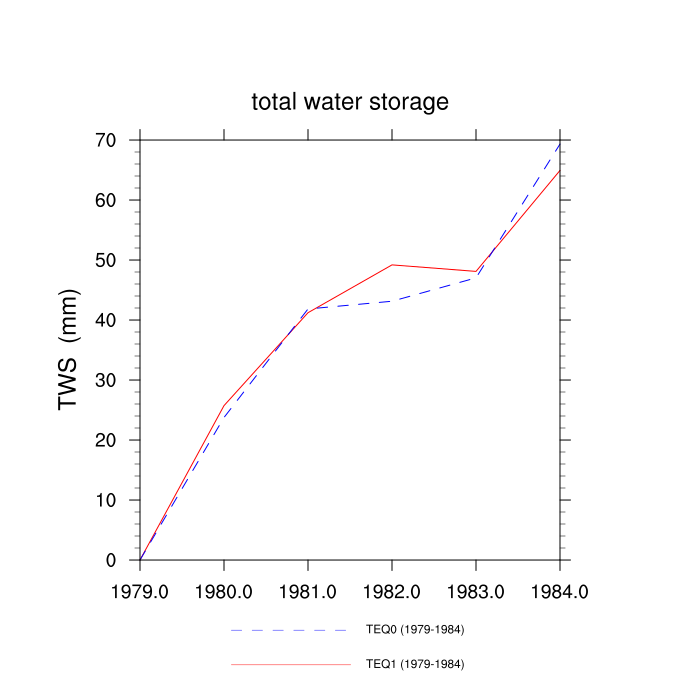
| total water storage (TWS) | TrendPlot | DifferencePlot | AnomalyPlot | ||
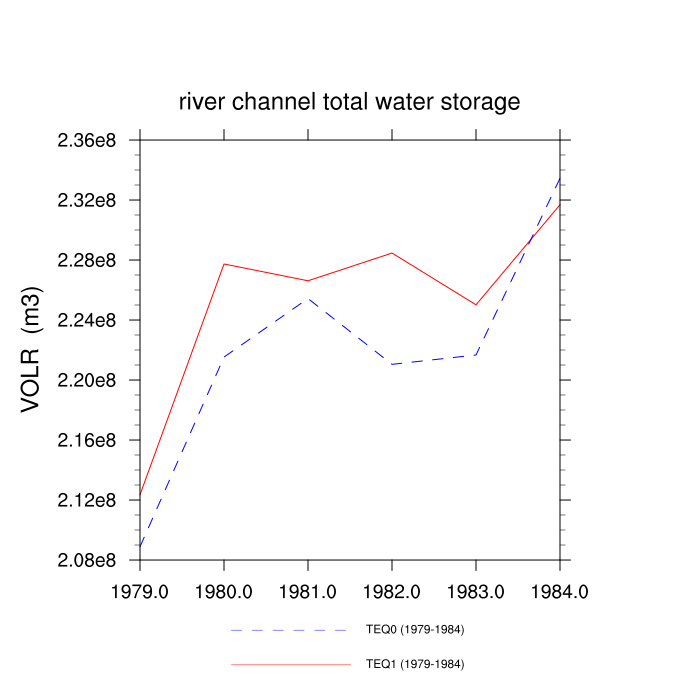
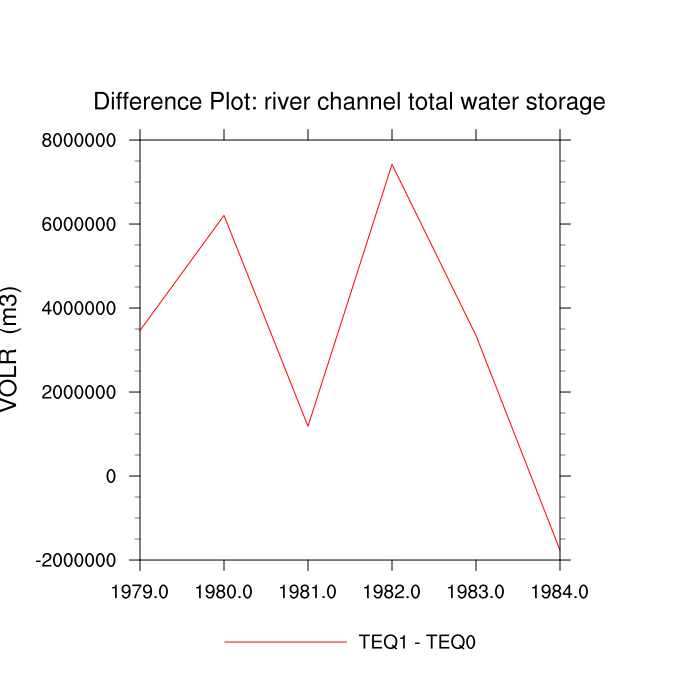
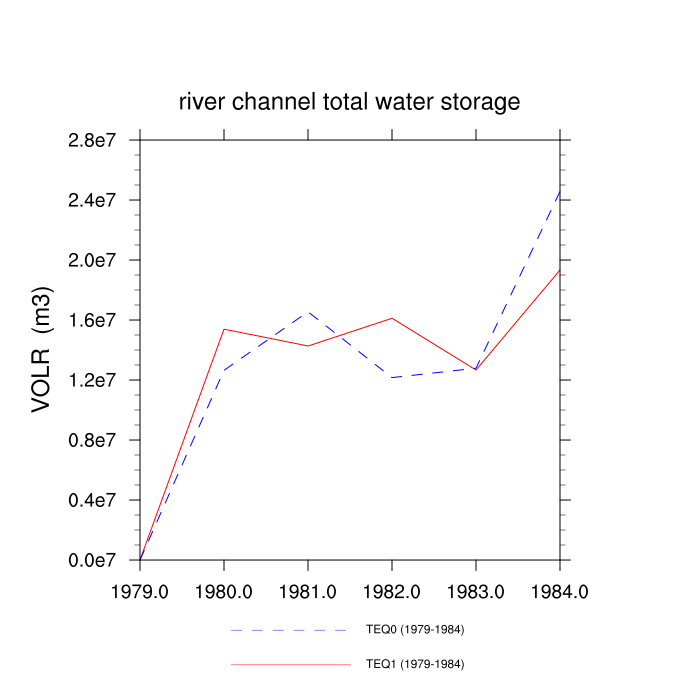
| river channel total water storage (VOLR) | TrendPlot | DifferencePlot | AnomalyPlot | ||
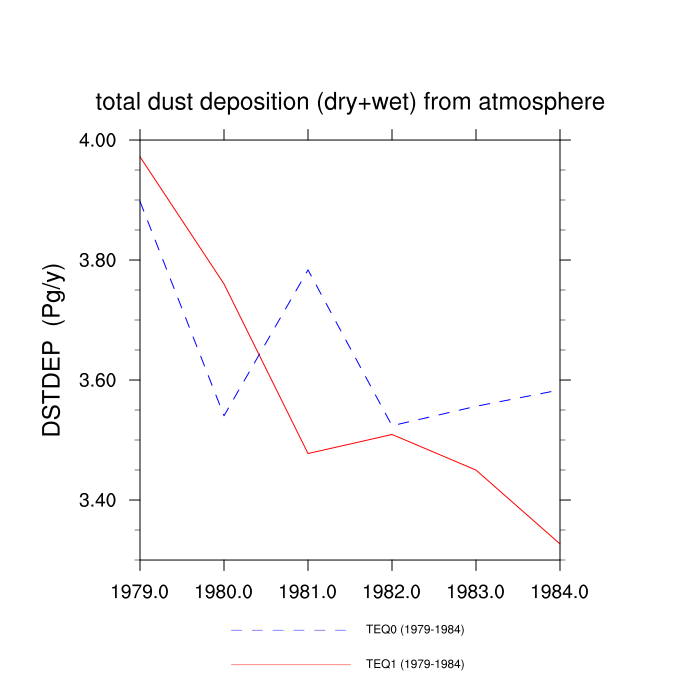
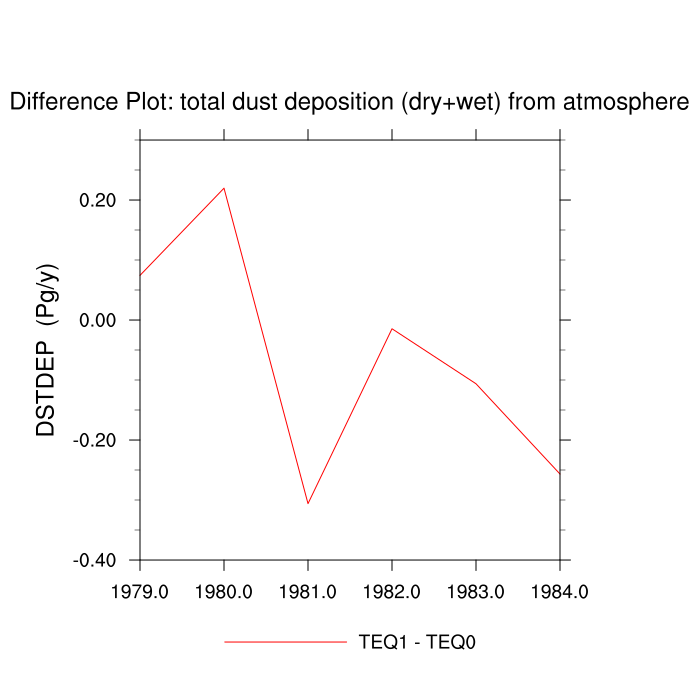
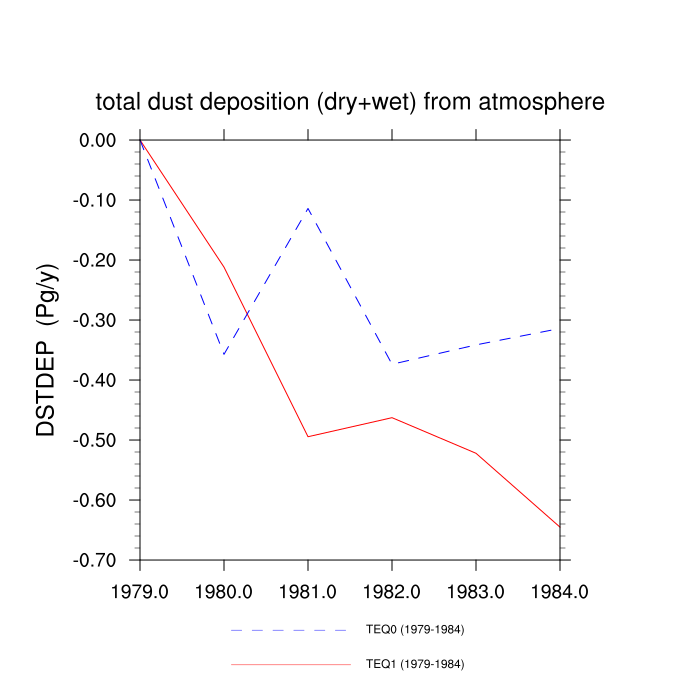
| total dust deposition (dry+wet) from atmosphere (DSTDEP) | TrendPlot | DifferencePlot | AnomalyPlot | ||
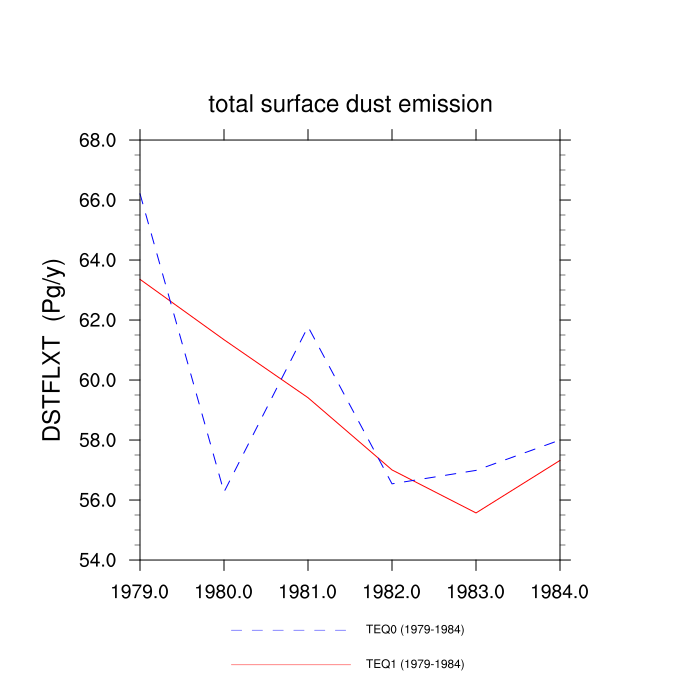
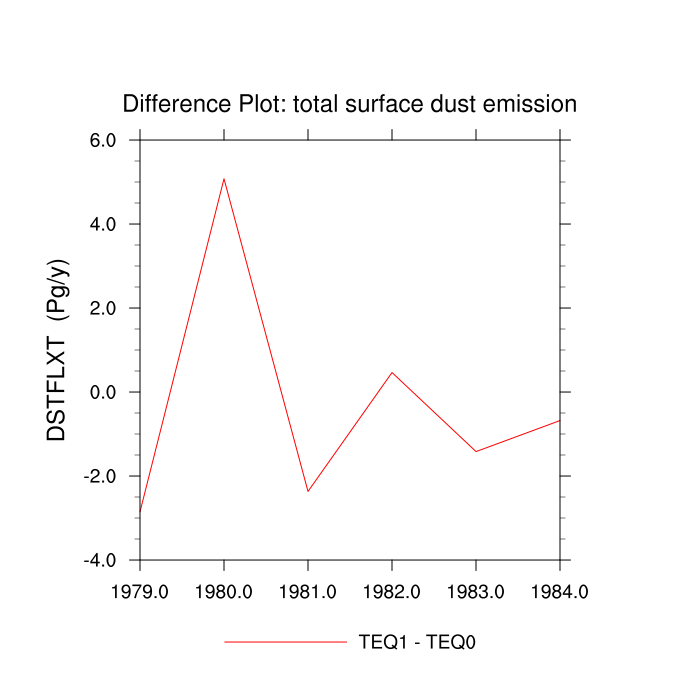
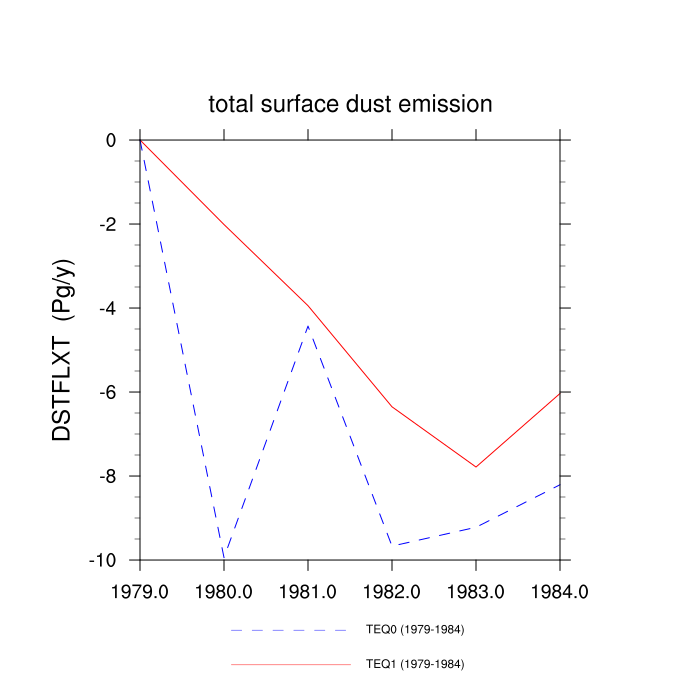
| total surface dust emission (DSTFLXT) | TrendPlot | DifferencePlot | AnomalyPlot | ||
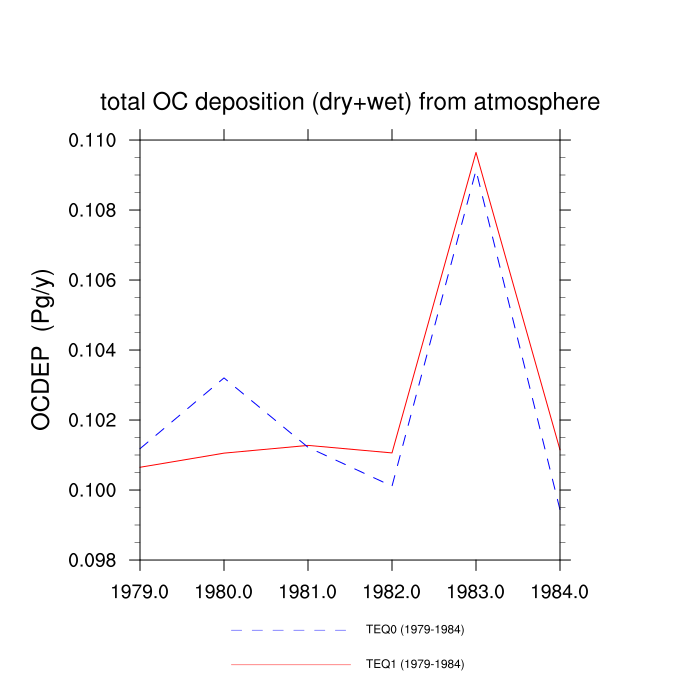
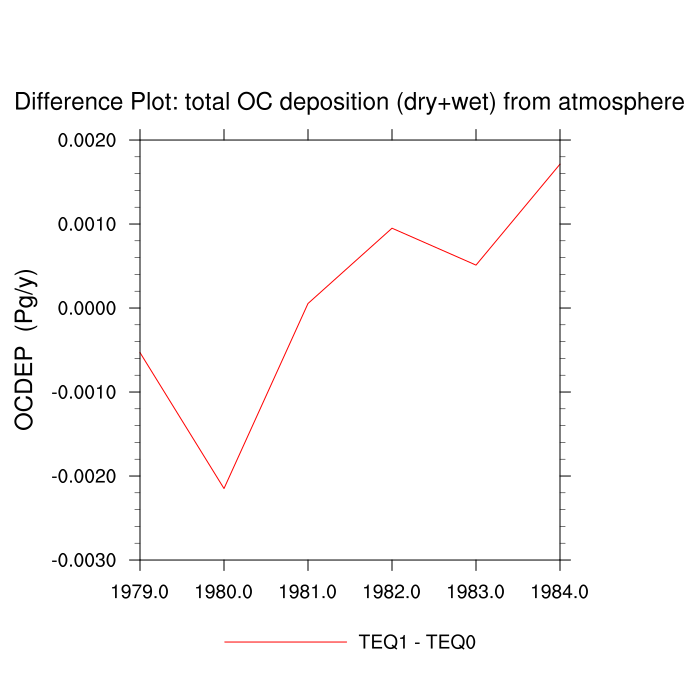
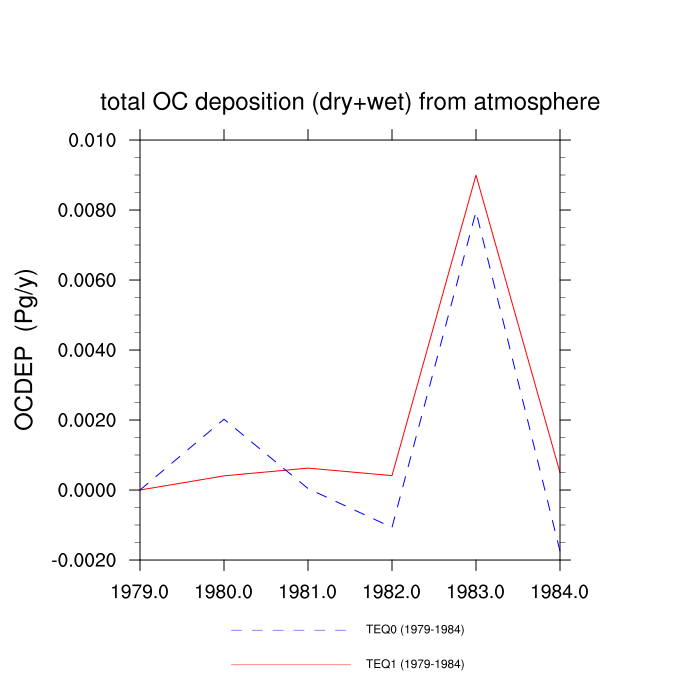
| total OC deposition (dry+wet) from atmosphere (OCDEP) | TrendPlot | DifferencePlot | AnomalyPlot | ||
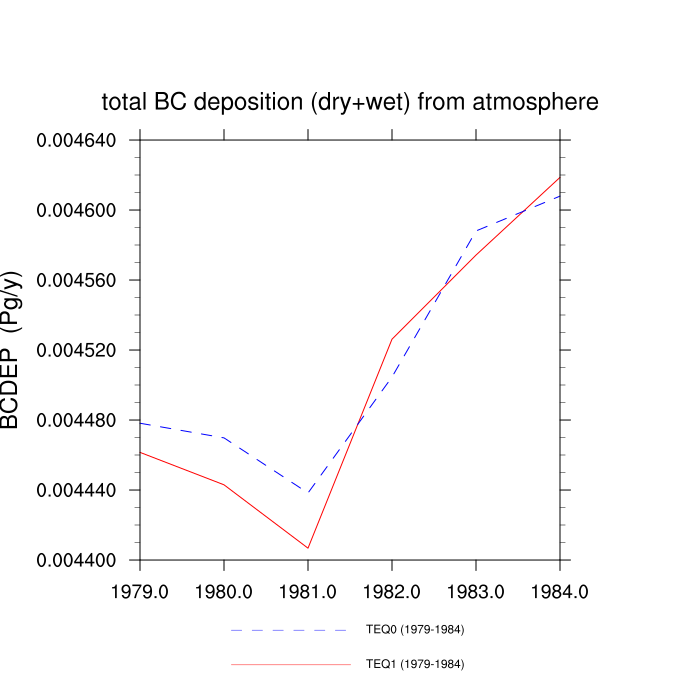
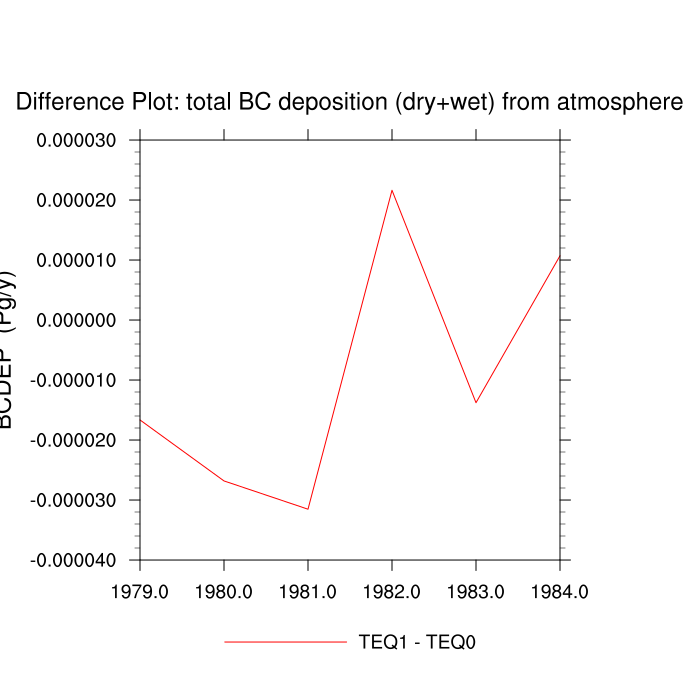
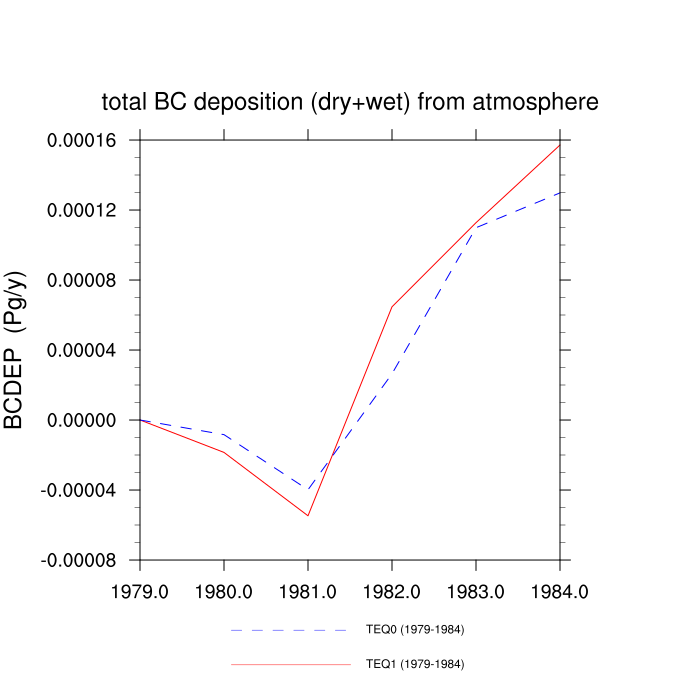
| total BC deposition (dry+wet) from atmosphere (BCDEP) | TrendPlot | DifferencePlot | AnomalyPlot | ||
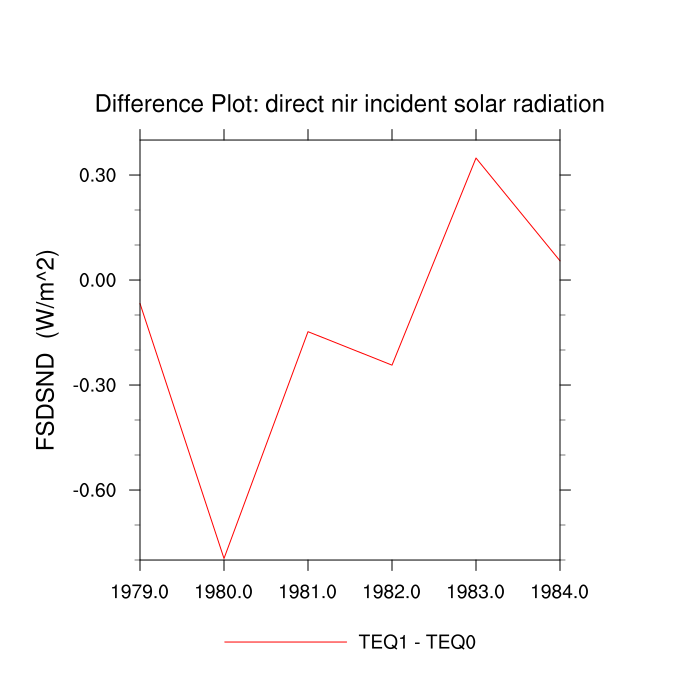
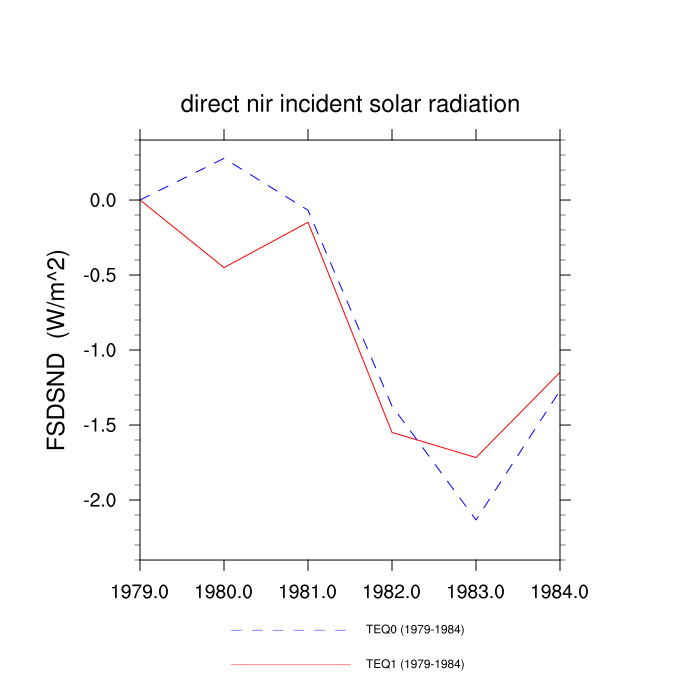
| direct nir incident solar radiation (FSDSND) | TrendPlot | DifferencePlot | AnomalyPlot | ||
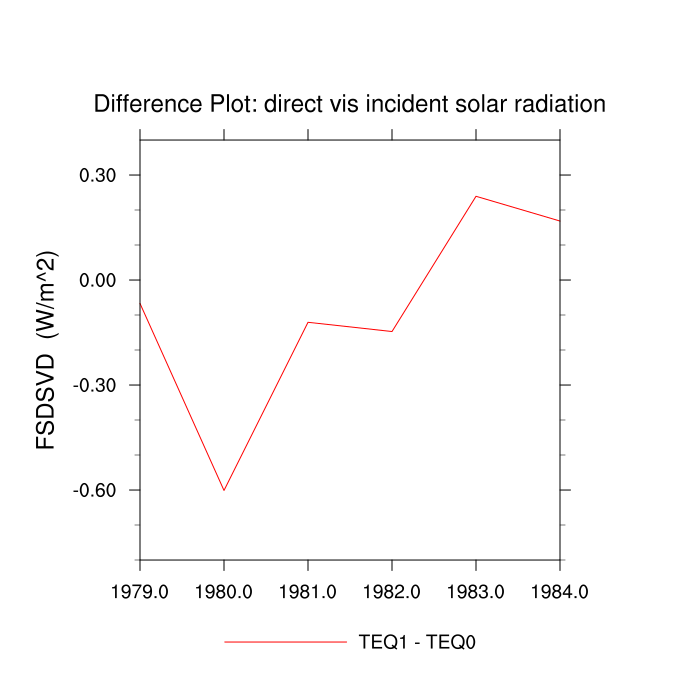
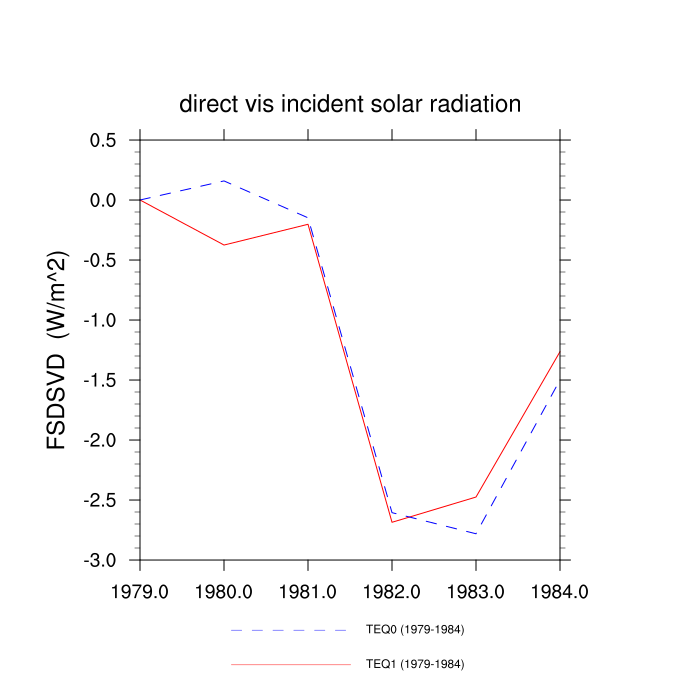
| direct vis incident solar radiation (FSDSVD) | TrendPlot | DifferencePlot | AnomalyPlot | ||
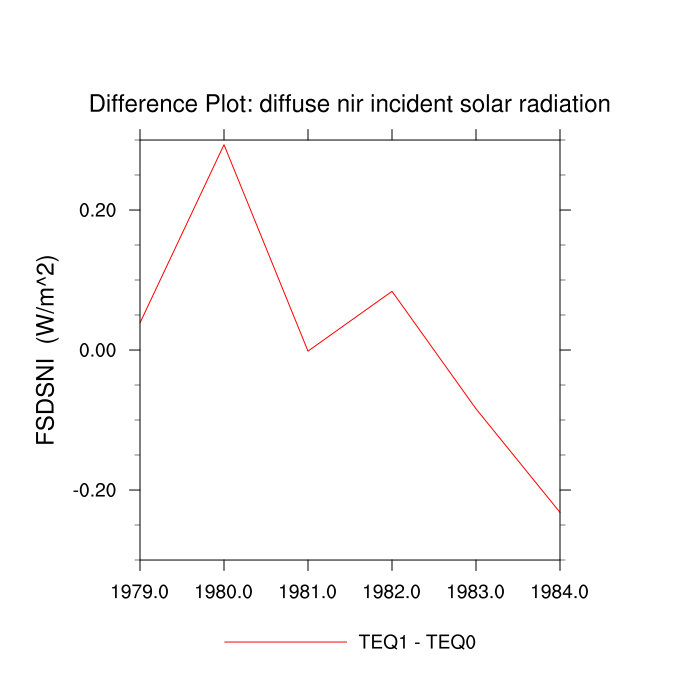
| diffuse nir incident solar radiation (FSDSNI) | TrendPlot | DifferencePlot | AnomalyPlot | ||
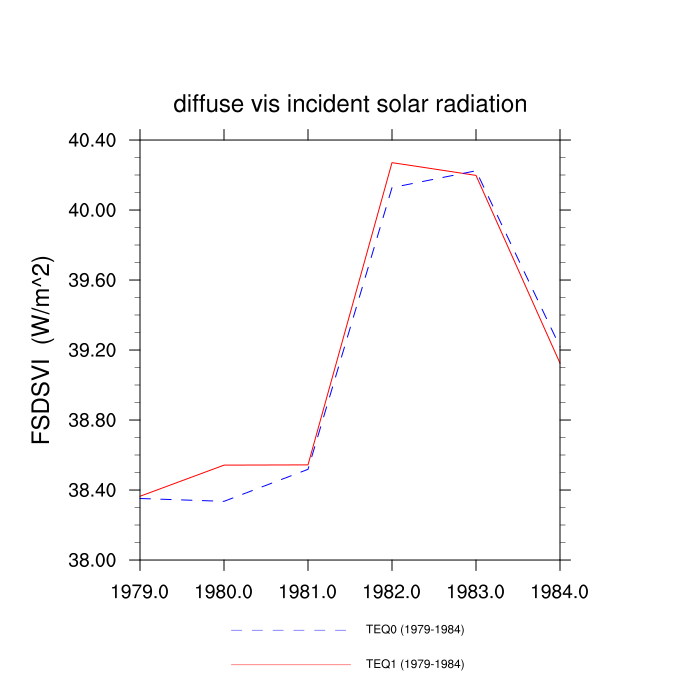
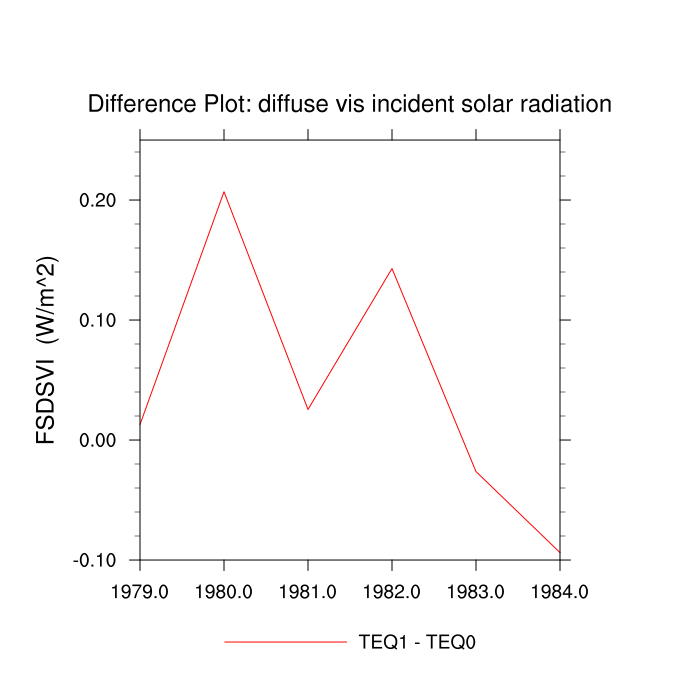
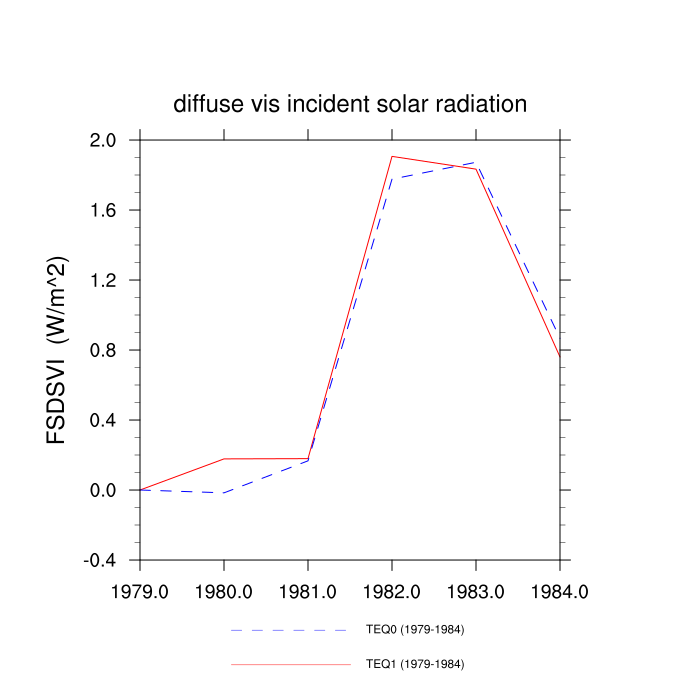
| diffuse vis incident solar radiation (FSDSVI) | TrendPlot | DifferencePlot | AnomalyPlot | ||
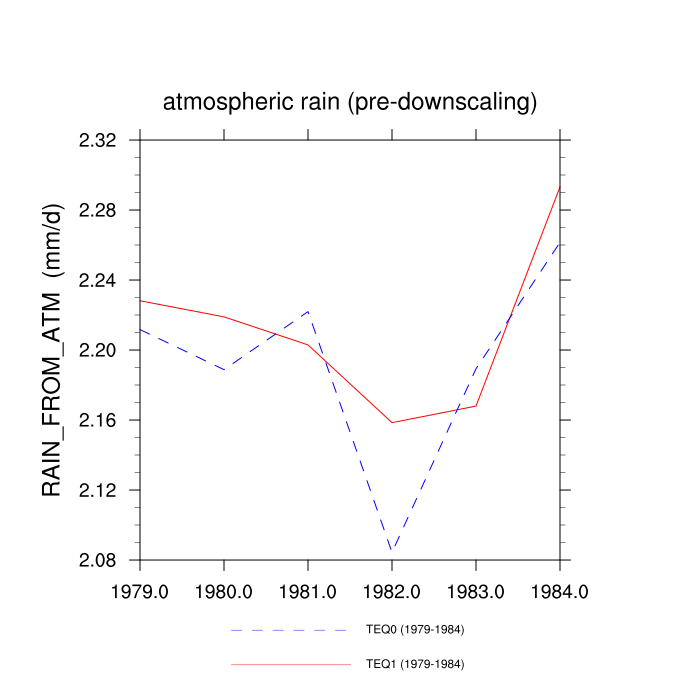
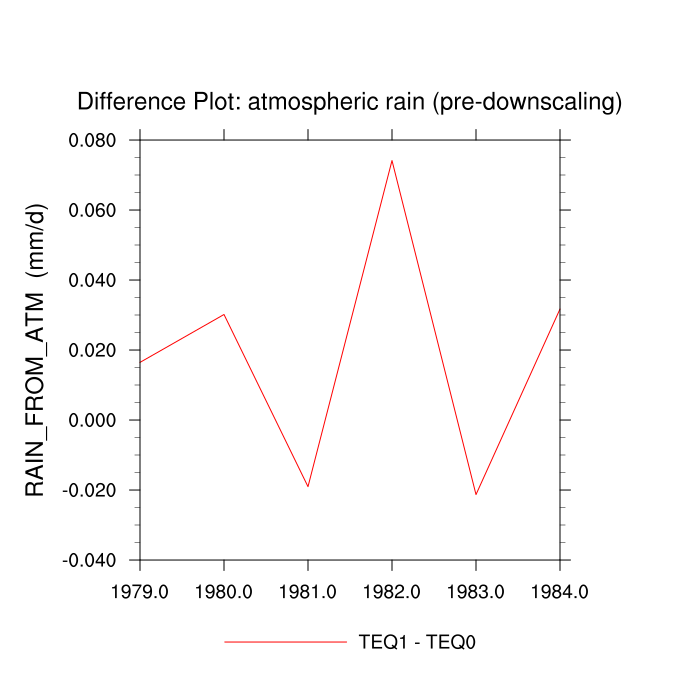
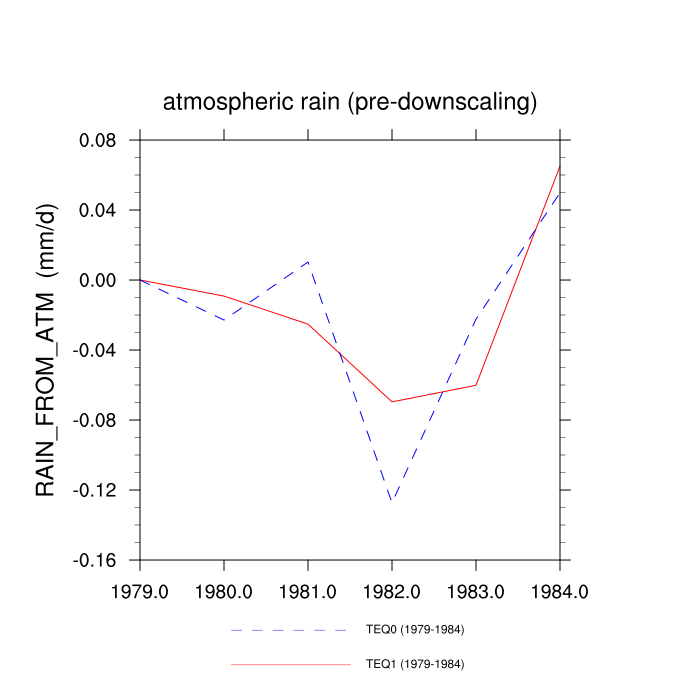
| atmospheric rain (pre-downscaling) (RAIN_FROM_ATM) | TrendPlot | DifferencePlot | AnomalyPlot | ||
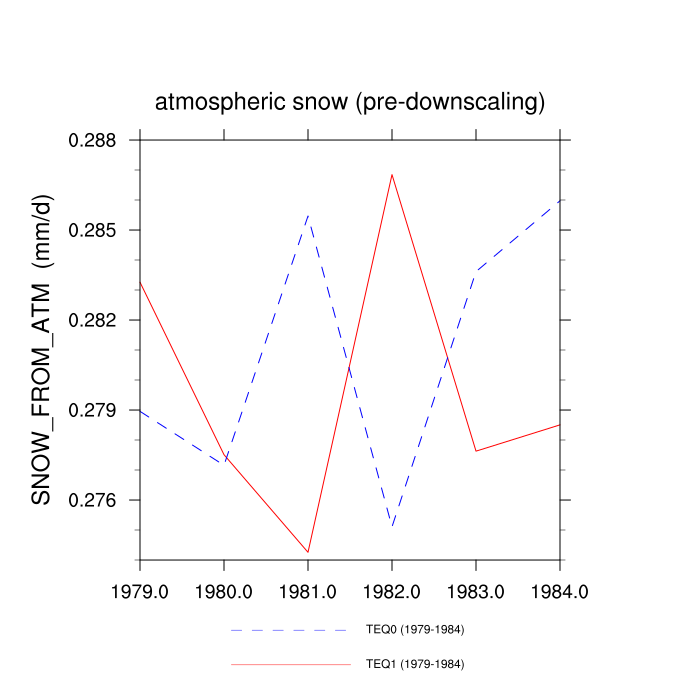
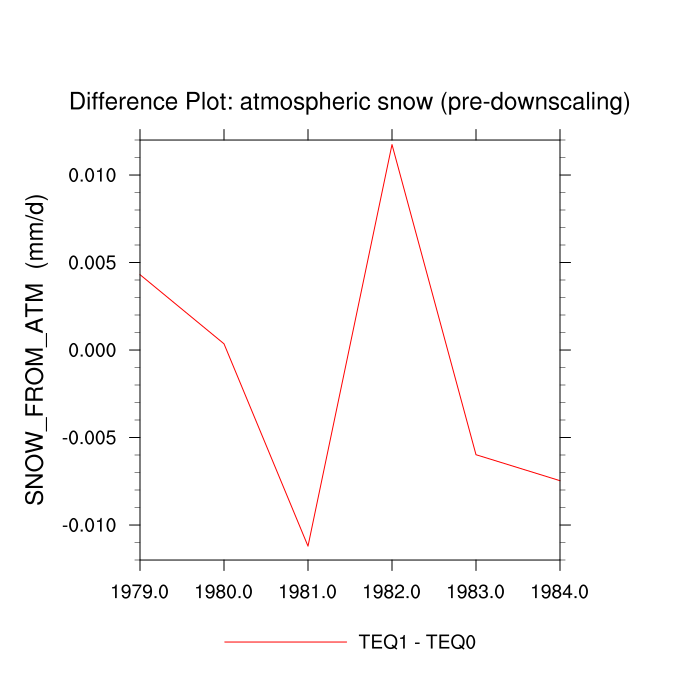
| atmospheric snow (pre-downscaling) (SNOW_FROM_ATM) | TrendPlot | DifferencePlot | AnomalyPlot | ||
| atmospheric longwave radiation (pre-downscaling) (FLDS_NOT_DOWNSCALED) | --- | --- | --- | ||
| atmospheric reference height (ZBOT) | TrendPlot | DifferencePlot | AnomalyPlot | ||
| atmospheric air temperature (pre-downscaling) (Tair_from_atm) | --- | --- | --- | ||
| atmospheric air potential temperature (pre-downscaling) (Thair_from_atm) | --- | --- | --- | ||
| atmospheric specific humidity (pre-downscaling) (QBOT_NOT_DOWNSCALED) | --- | --- | --- | ||
| atm pressure of bottom layer (pre-downscaling) (PBOT_NOT_DOWNSCALED) | --- | --- | --- | ||
| atmospheric density of bottom layer (pre-downscaling) (Rho_from_atm) | --- | --- | --- | ||
| atmospheric uwind velocity magnitude (UWIND) | --- | --- | --- | ||
| atmospheric vwind velocity magnitude (VWIND) | --- | --- | --- | ||
| BC deposition (phidry) from atmosphere (BCPHIDRY) | --- | --- | --- | ||
| BC deposition (phodry) from atmosphere (BCPHODRY) | --- | --- | --- | ||
| BC deposition (phiwet) from atmosphere (BCPHIWET) | --- | --- | --- | ||
| OC deposition (phidry) from atmosphere (OCPHIDRY) | --- | --- | --- | ||
| OC deposition (phodry) from atmosphere (OCPHODRY) | --- | --- | --- | ||
| OC deposition (phiwet) from atmosphere (OCPHIWET) | --- | --- | --- | ||
| dust deposition (wet1) from atmosphere (DSTWET1) | --- | --- | --- | ||
| dust deposition (dry1) from atmosphere (DSTDRY1) | --- | --- | --- | ||
| dust deposition (wet2) from atmosphere (DSTWET2) | --- | --- | --- | ||
| dust deposition (dry2) from atmosphere (DSTDRY2) | --- | --- | --- | ||
| dust deposition (wet3) from atmosphere (DSTWET3) | --- | --- | --- | ||
| dust deposition (dry3) from atmosphere (DSTDRY3) | --- | --- | --- | ||
| dust deposition (wet4) from atmosphere (DSTWET4) | --- | --- | --- | ||
| dust deposition (dry4) from atmosphere (DSTDRY4) | --- | --- | --- | ||
| atmospheric surface height (ATM_TOPO) | TrendPlot | DifferencePlot | AnomalyPlot | ||