CICE Output for g.e20.G.TL319_t13.control.001
Hemisphere time series.
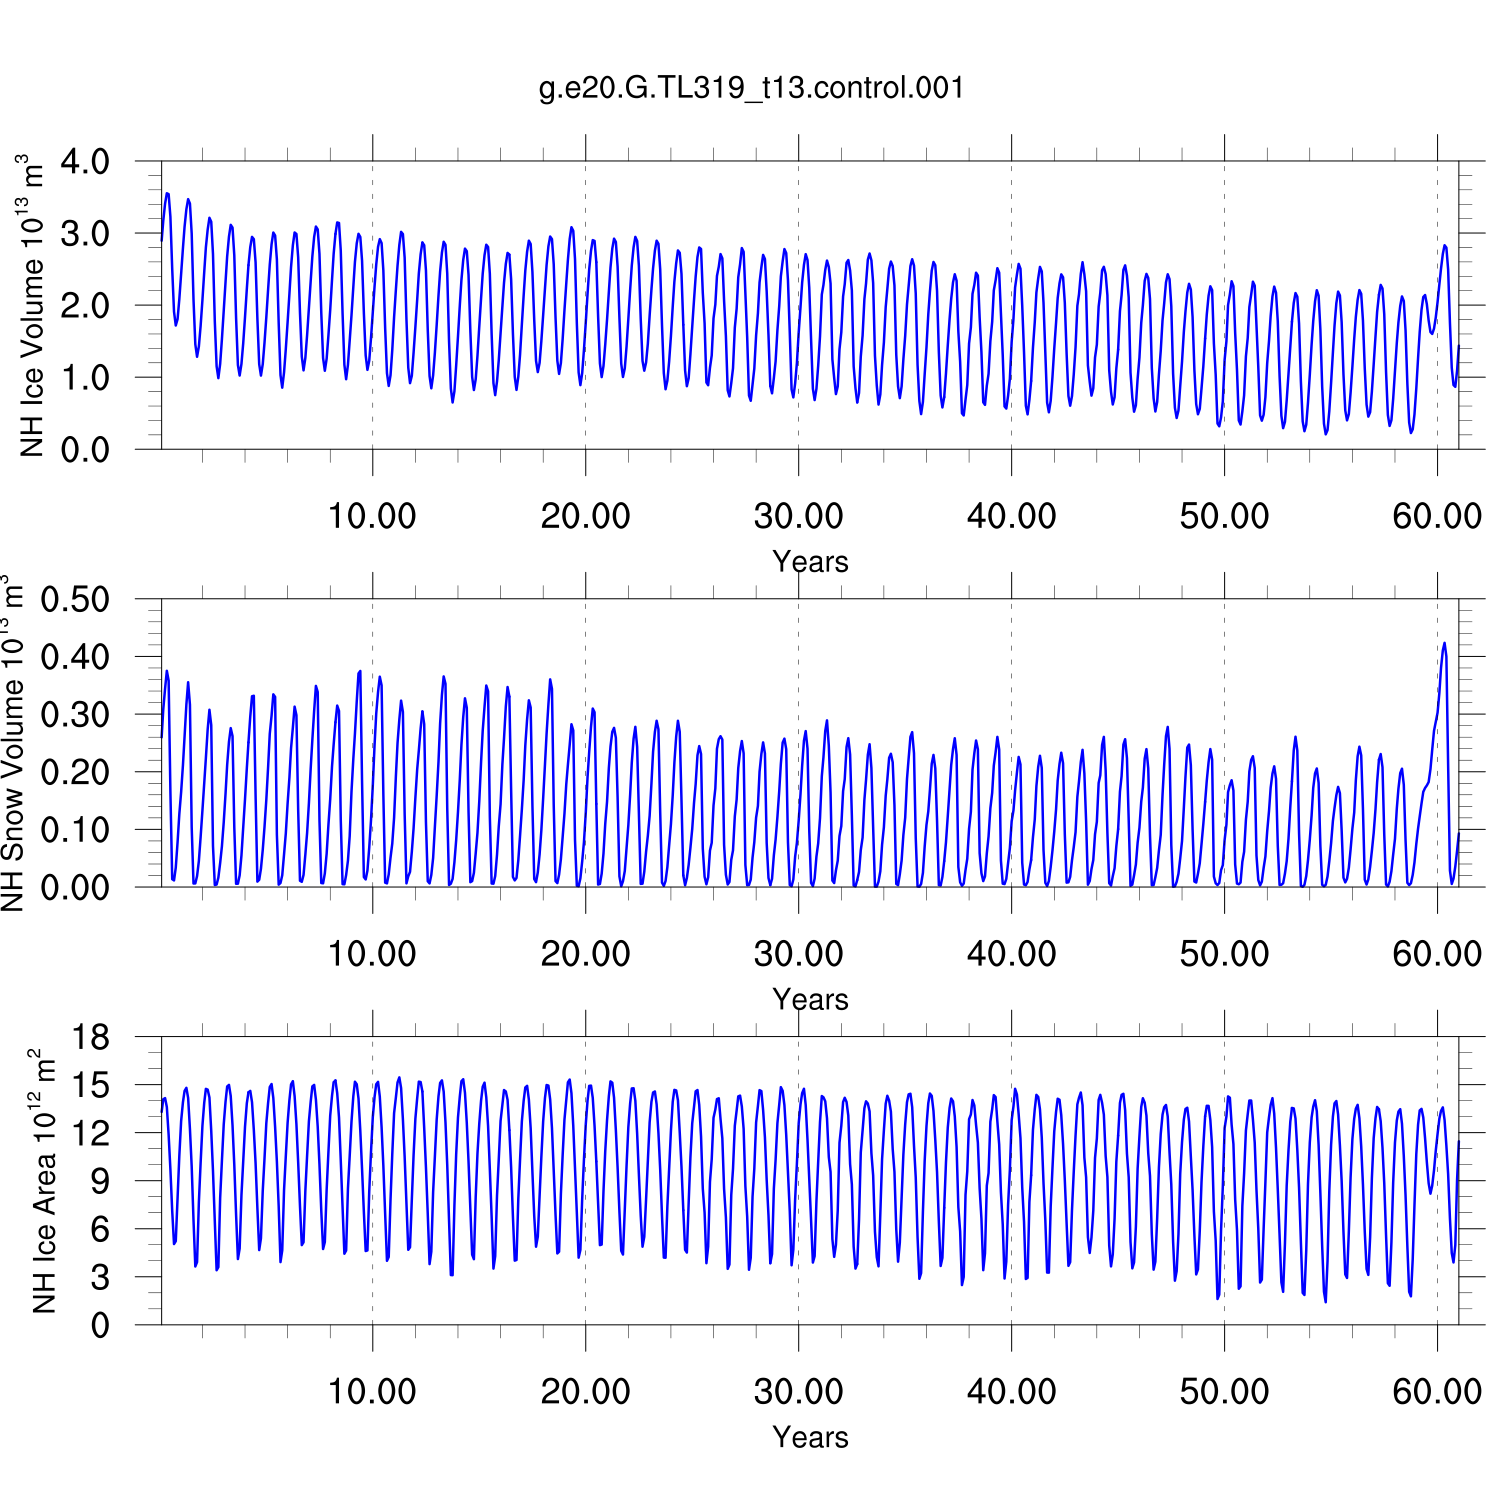
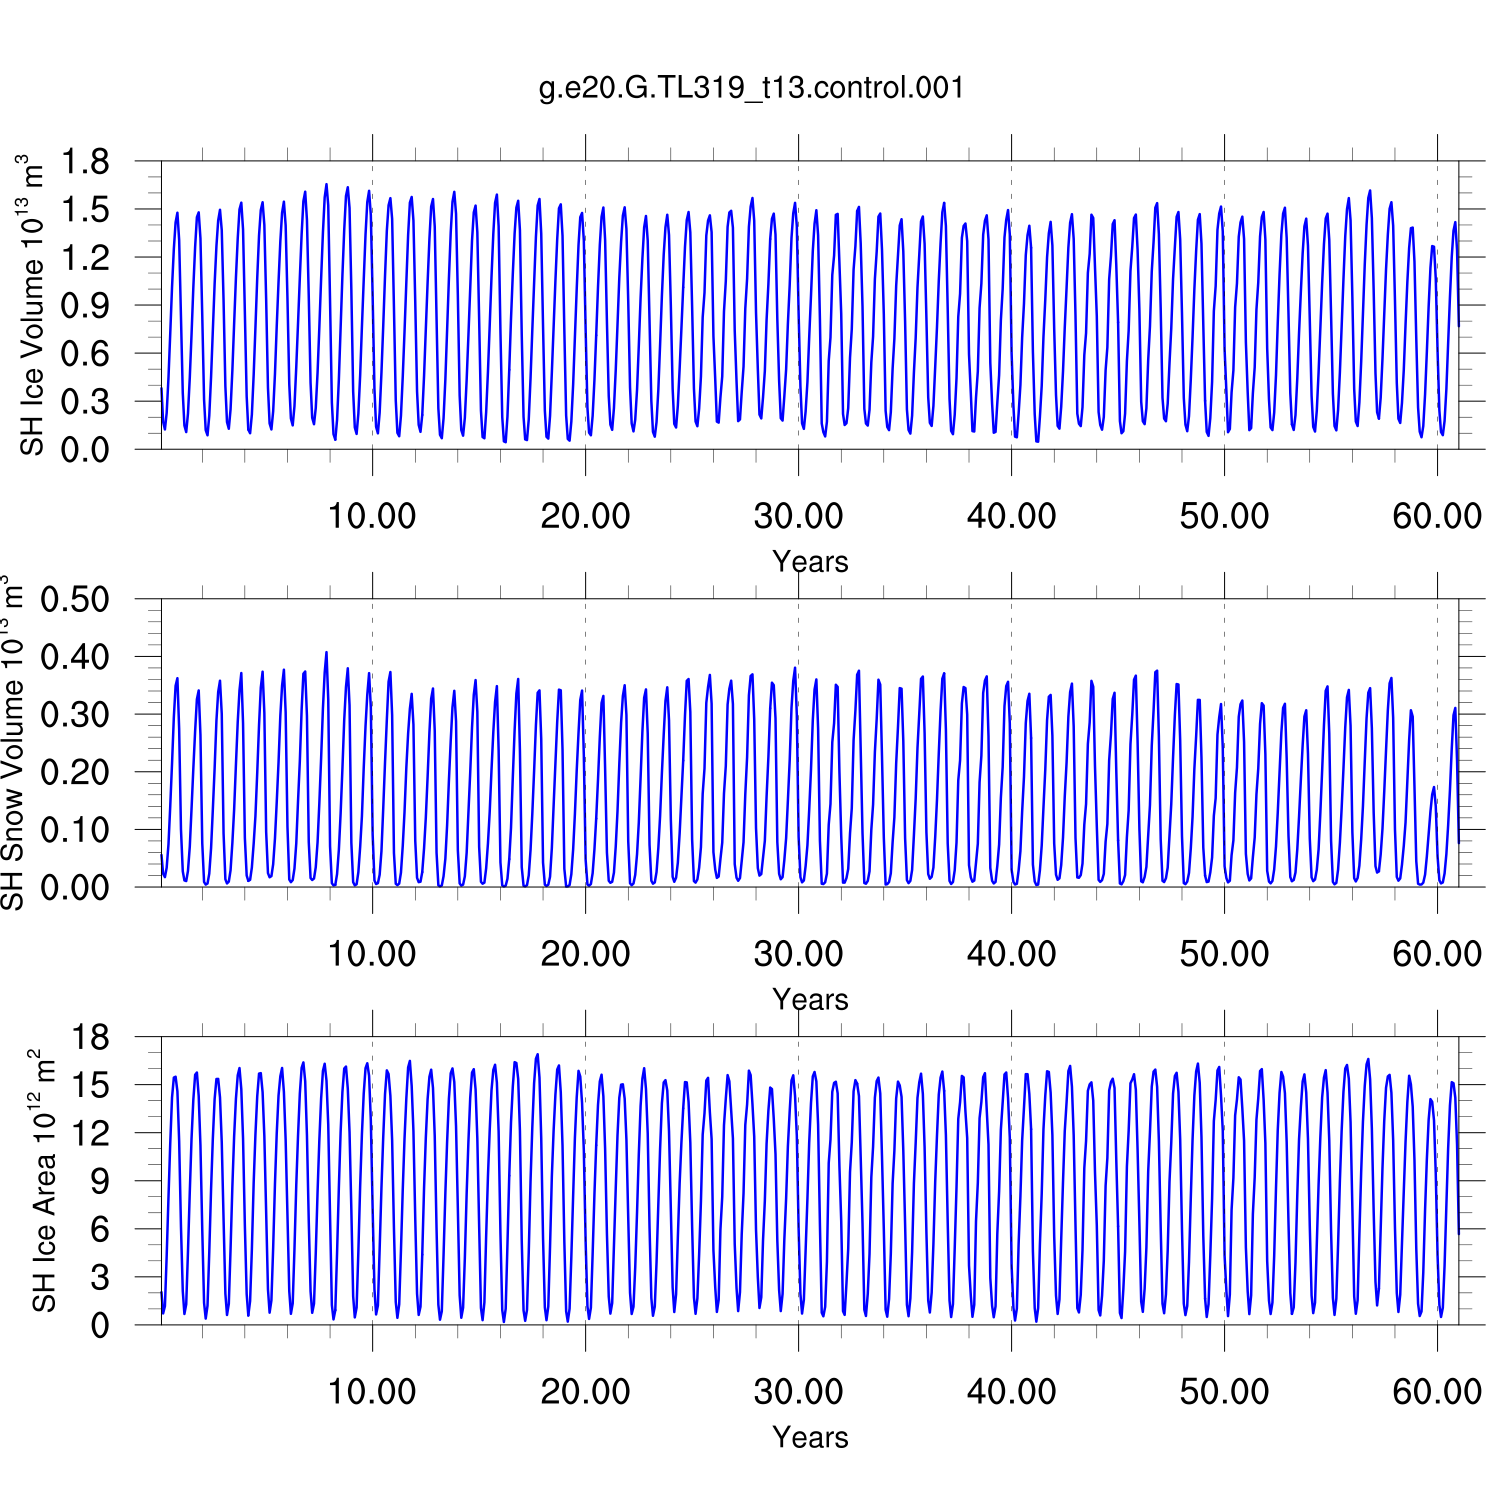
Time Series of Ice Volume, Snow Volume and Ice Area
NH
SH
Monthly Means
plot
plot
Monthly Mean Ice Volume vs. PIOMAS (20thC)
----
----
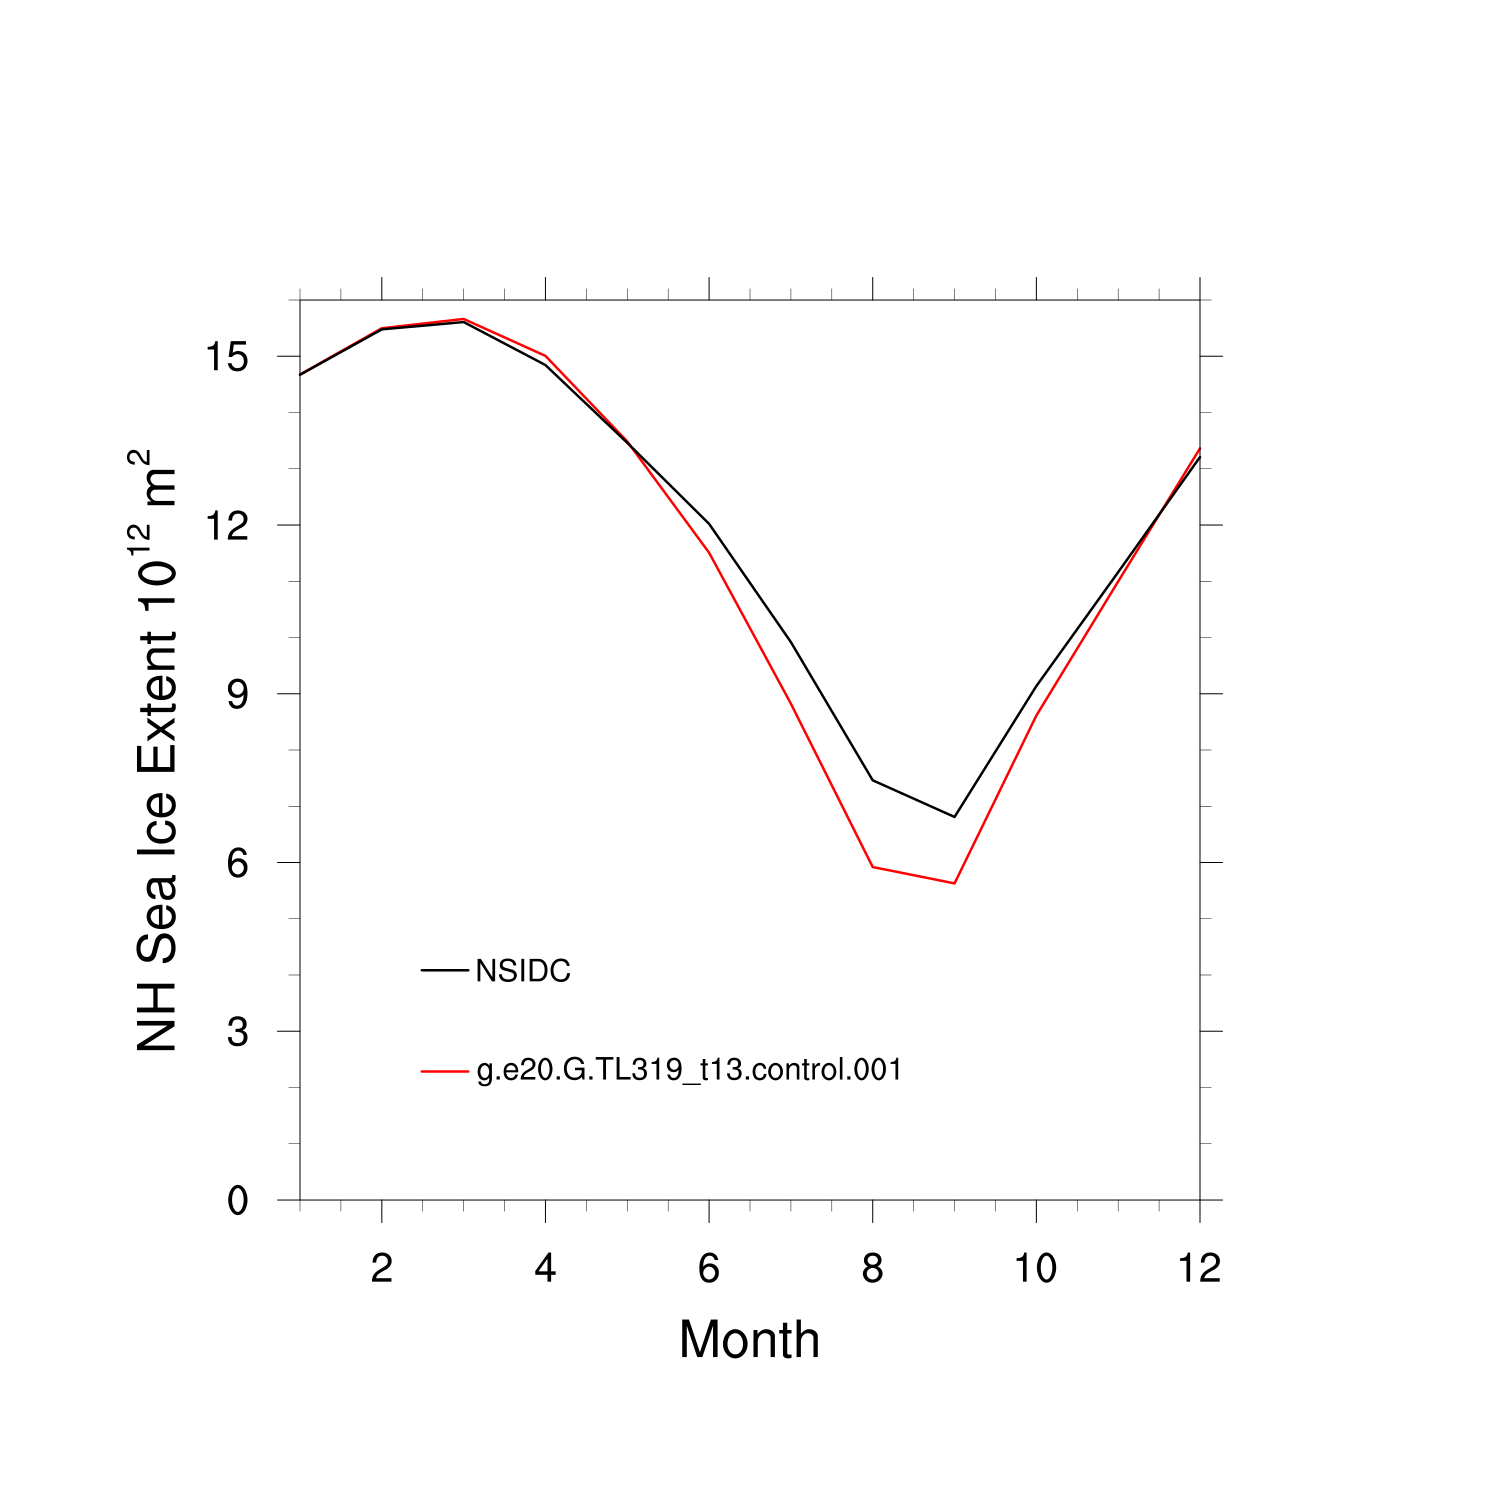
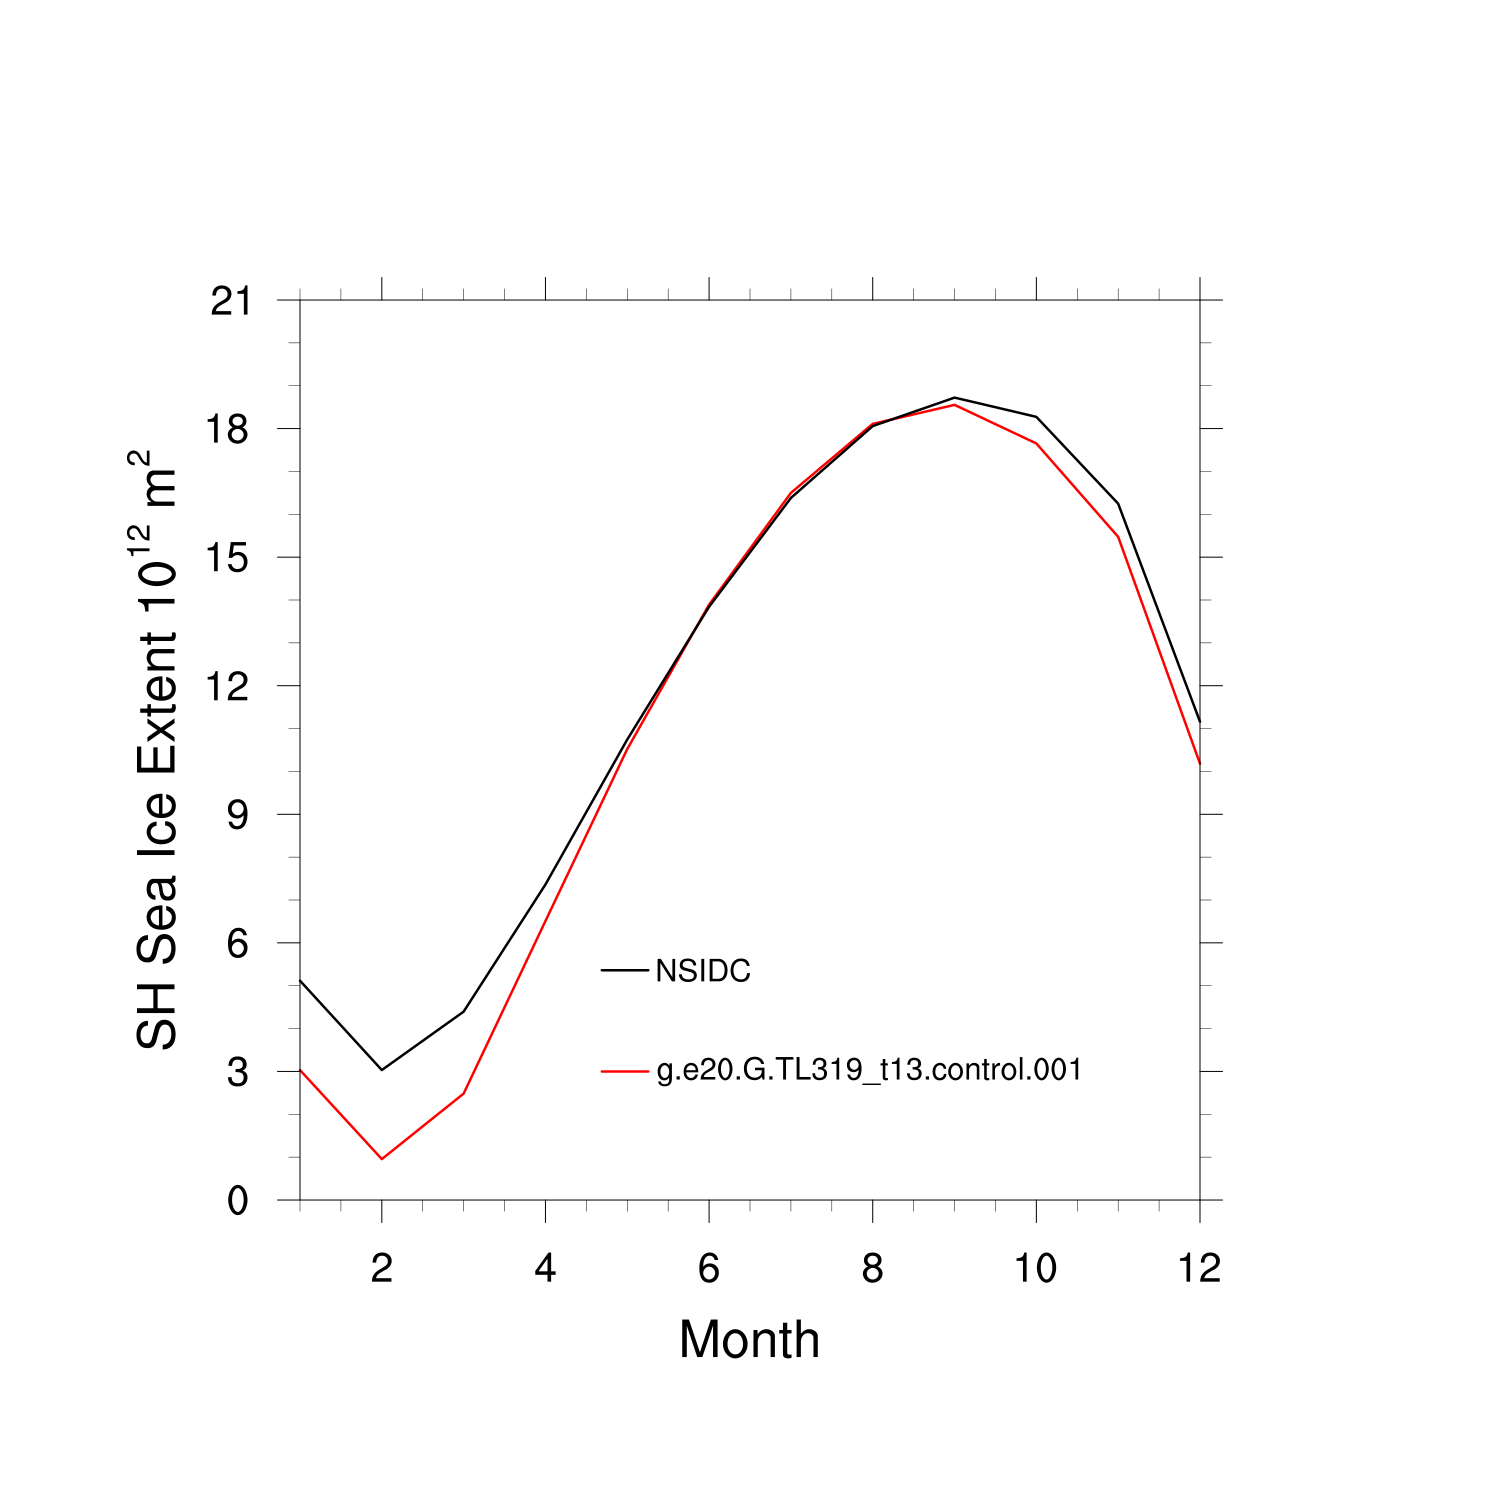
Climatological Monthly Mean Extent vs Obs
plot
plot
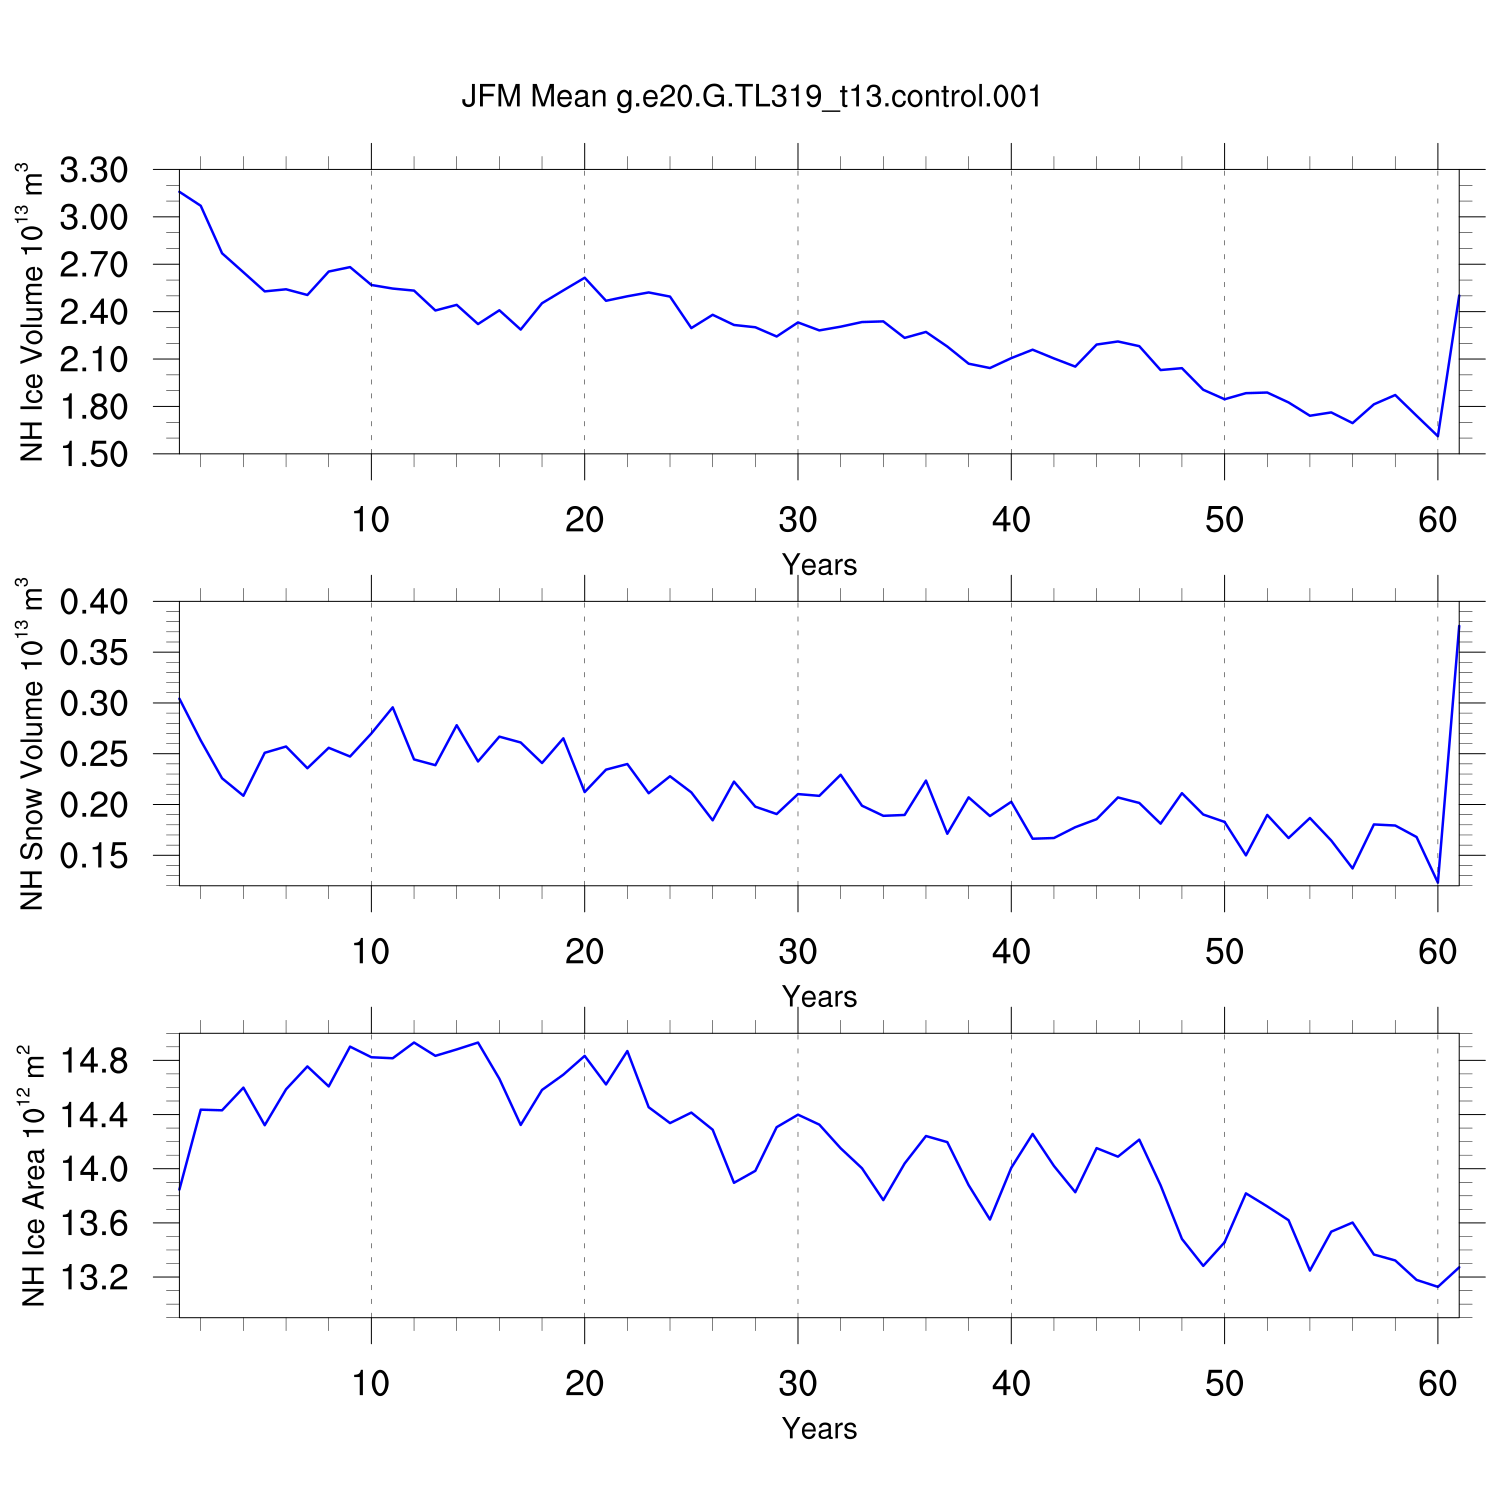
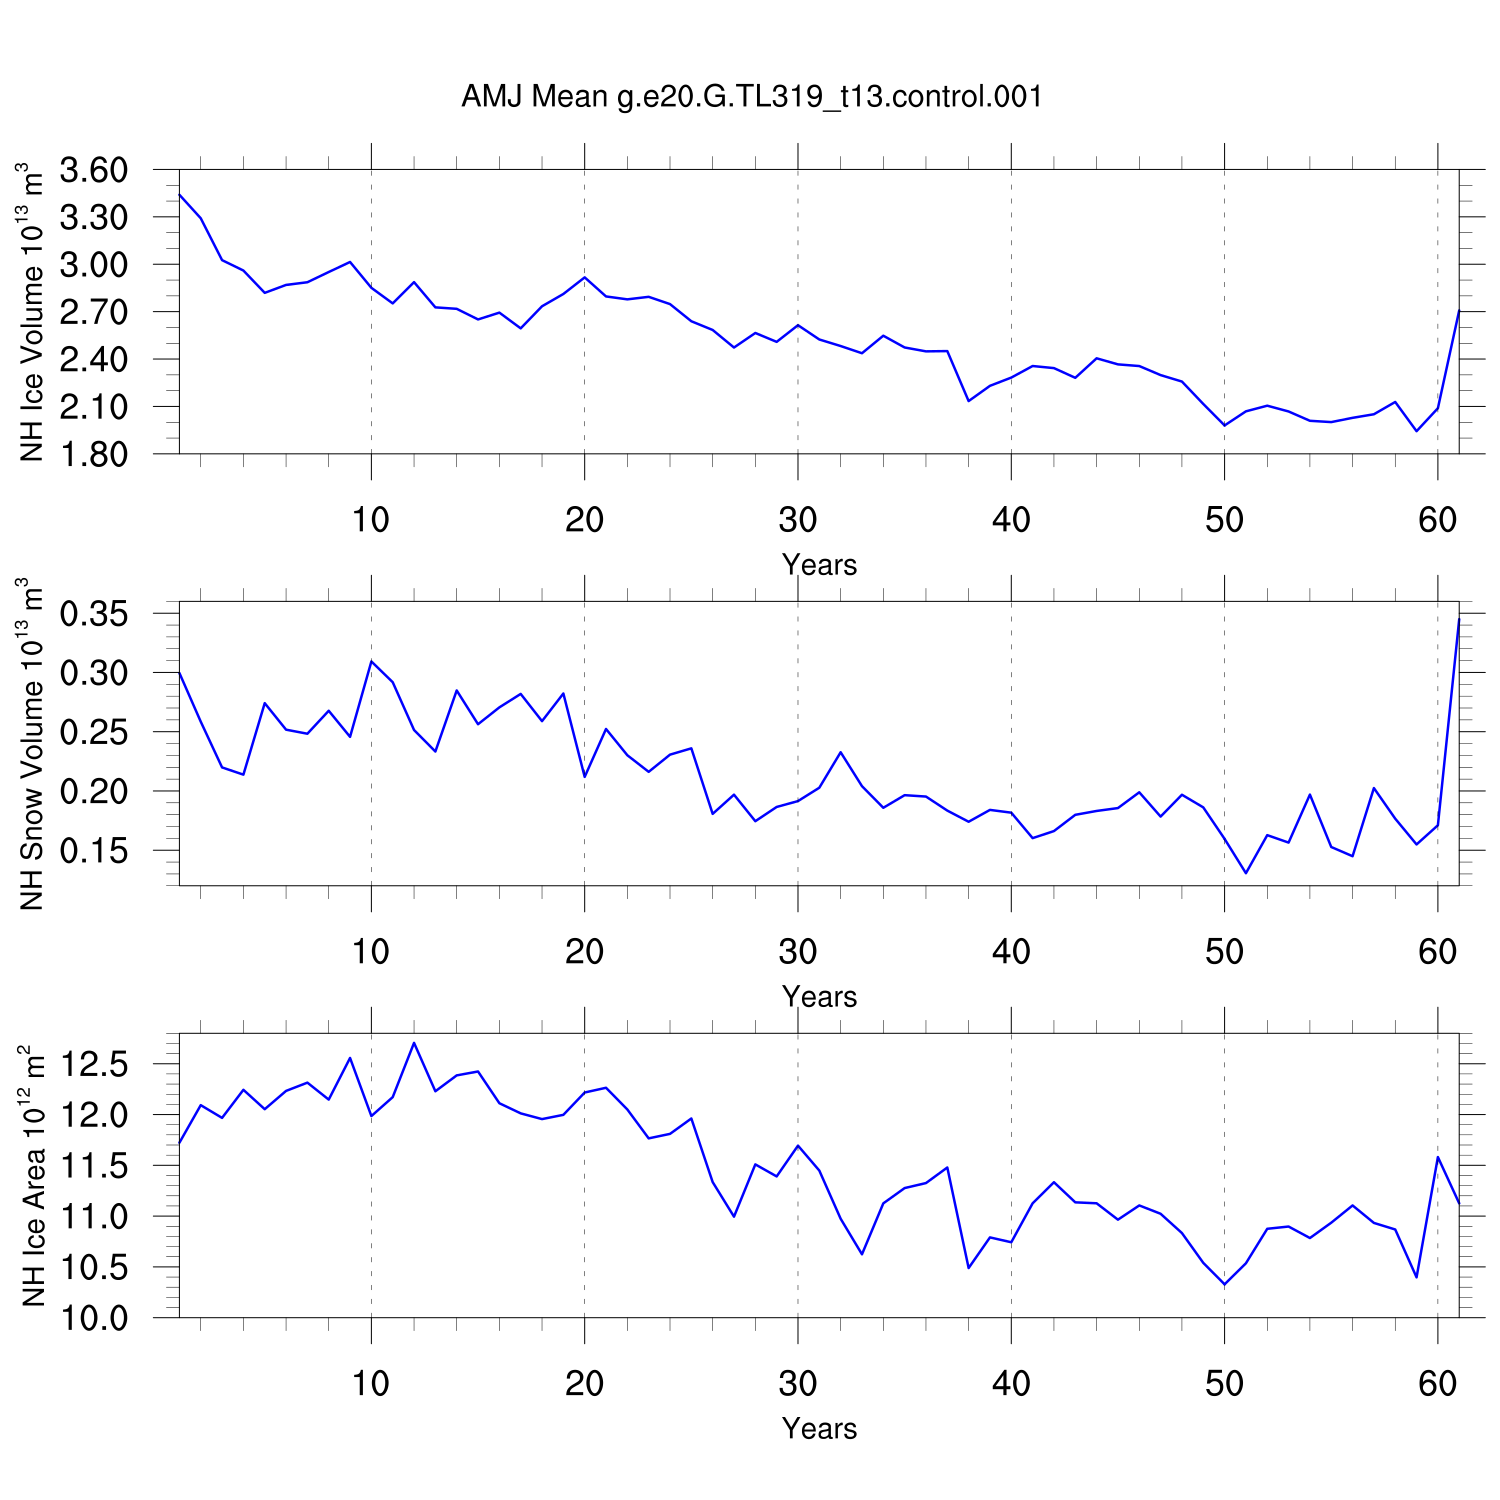
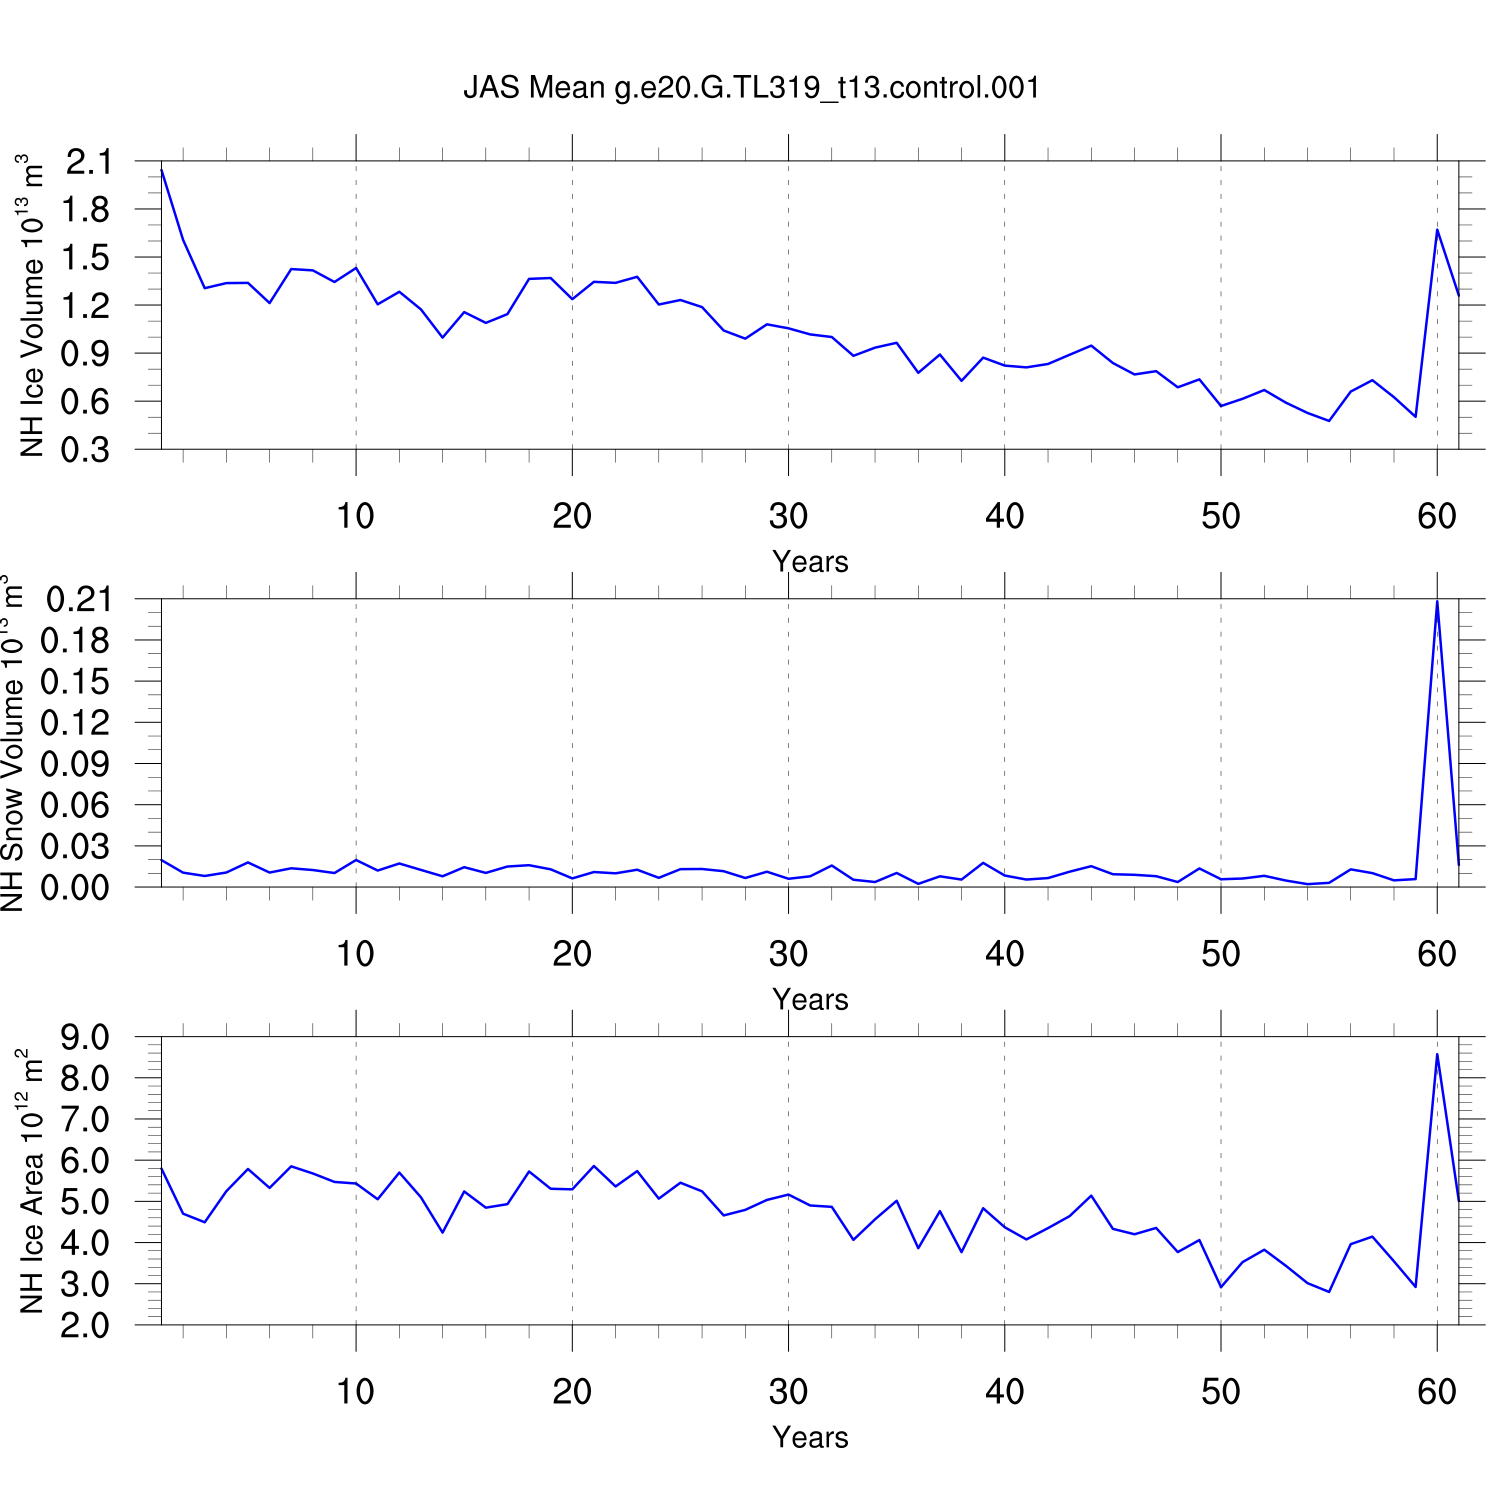
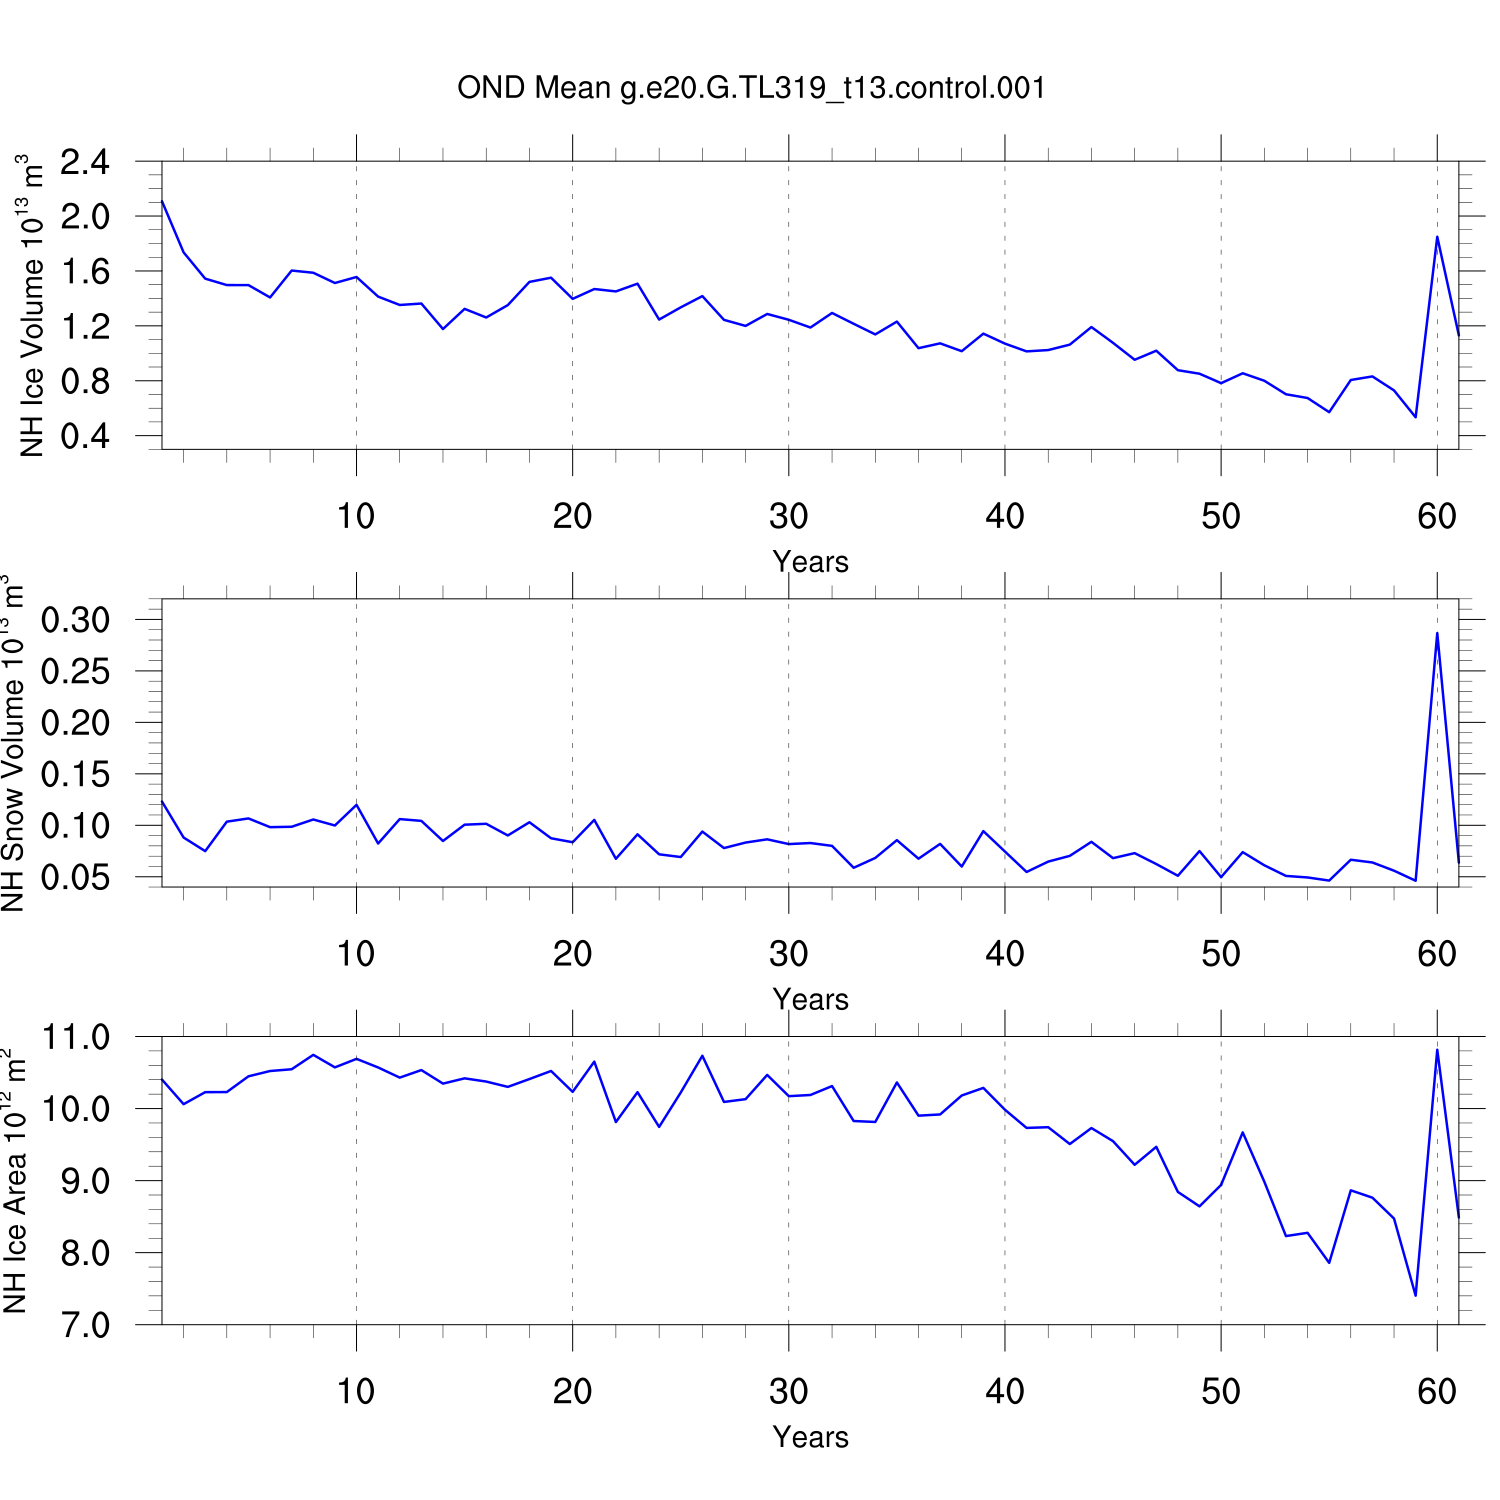
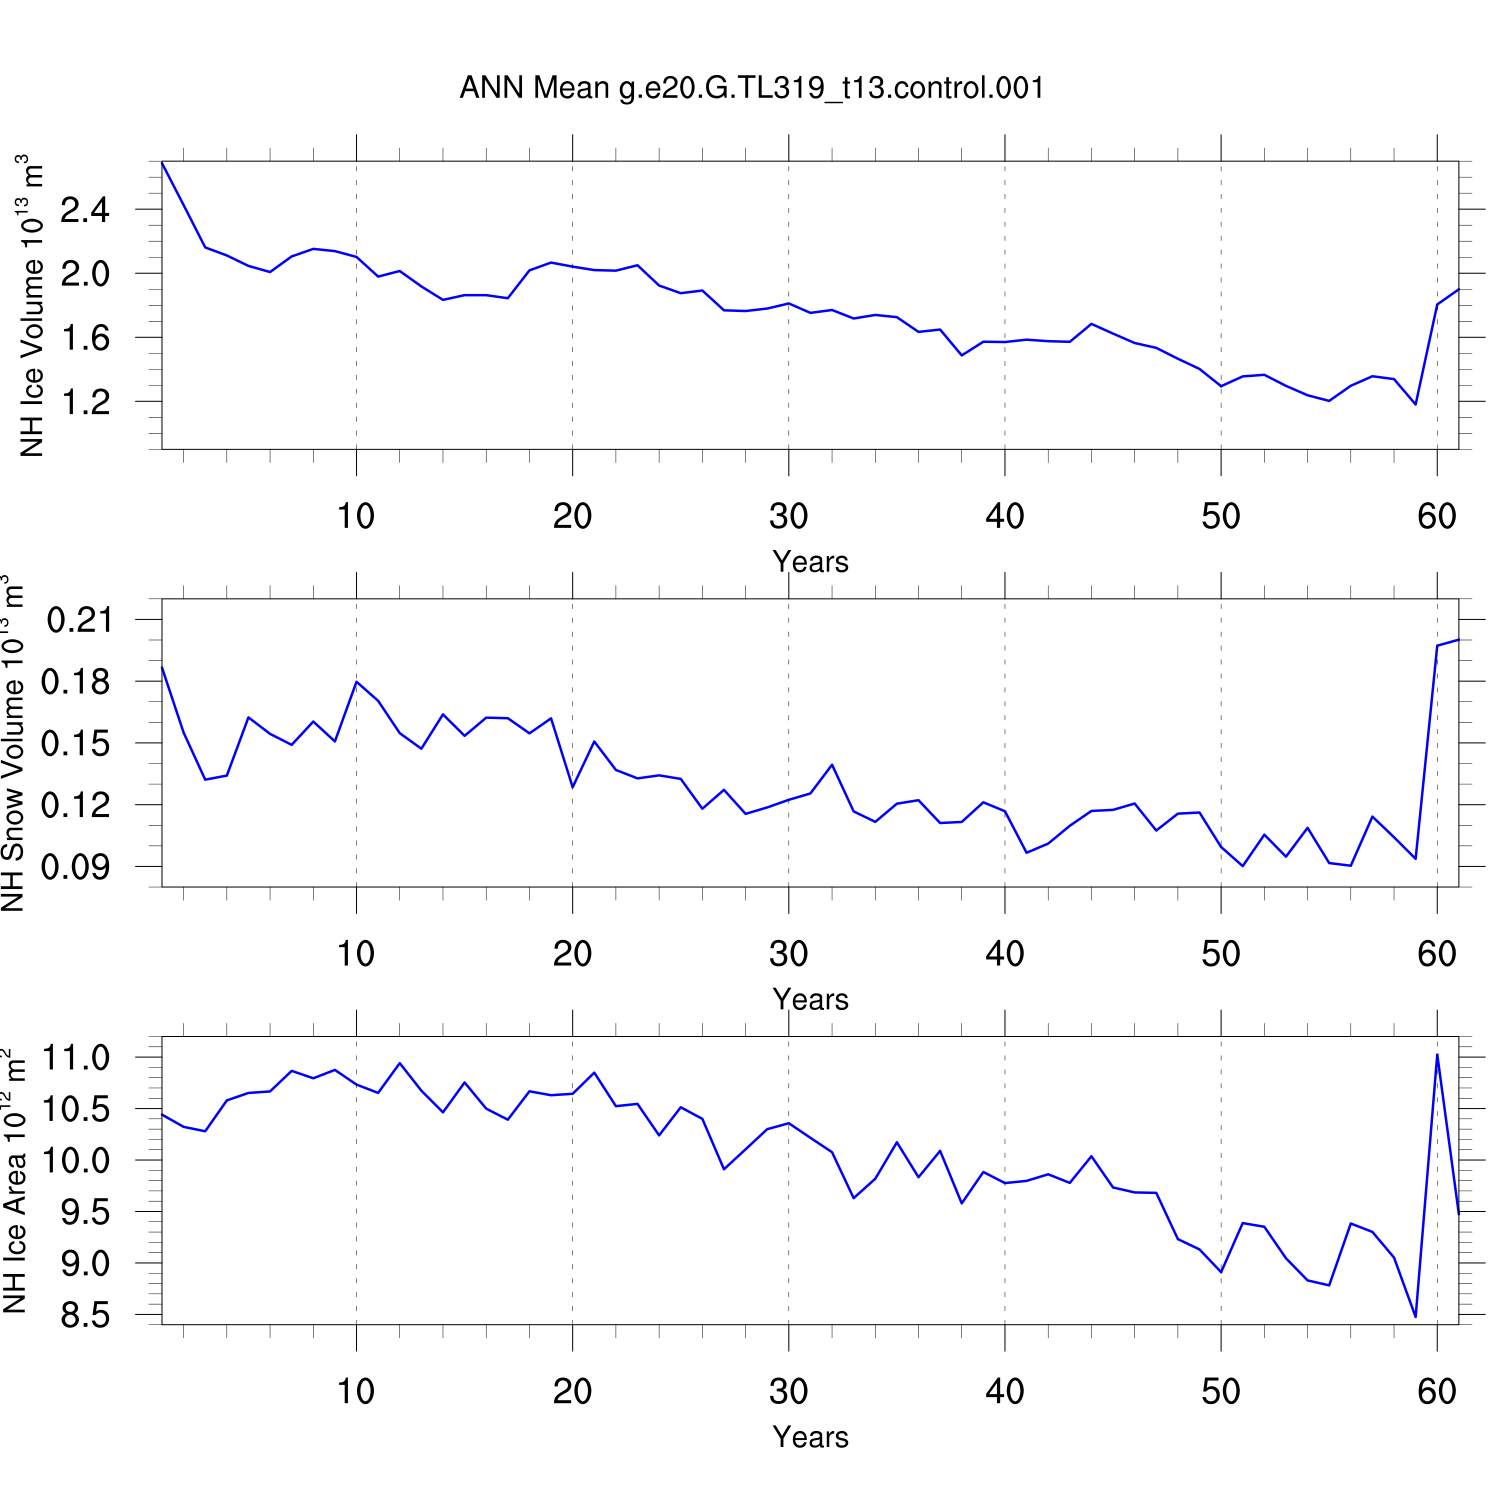
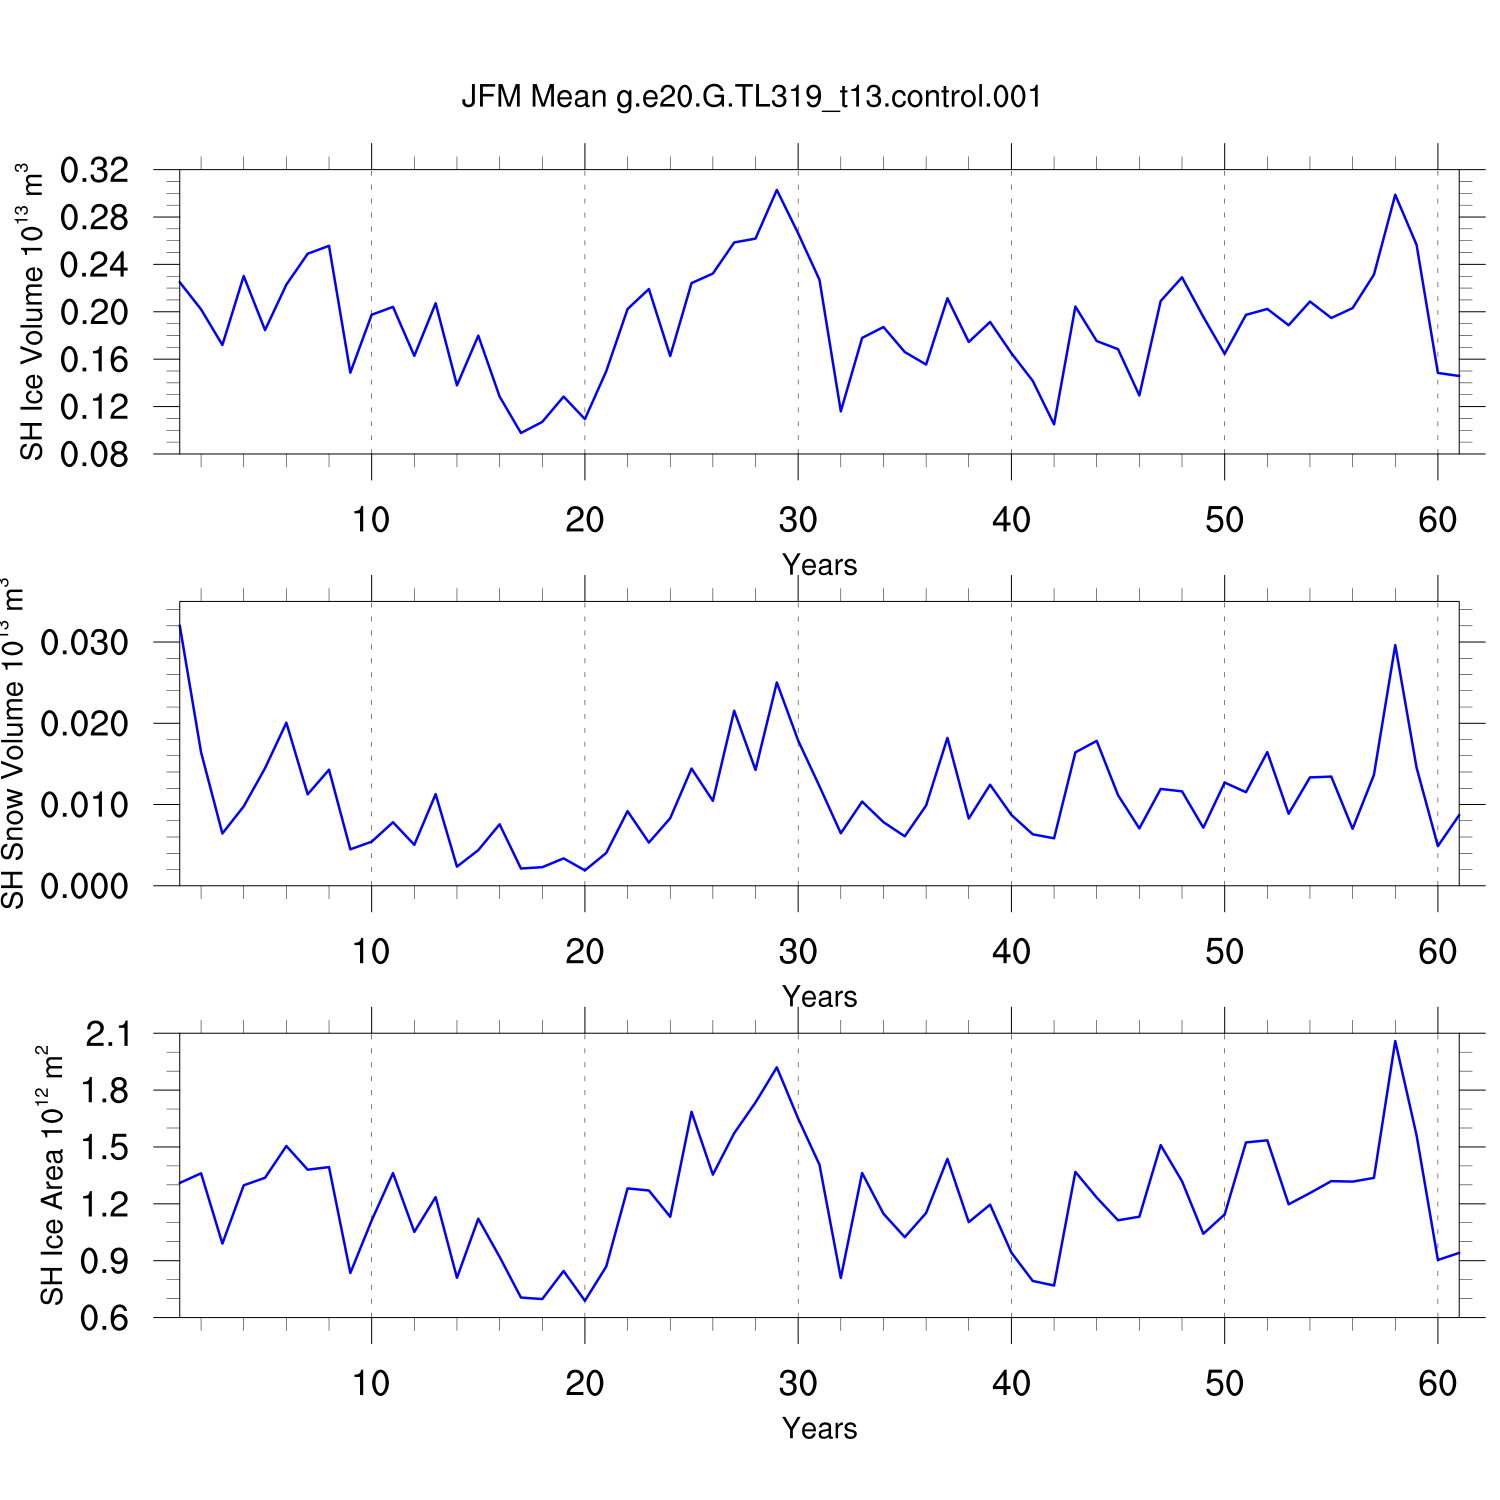
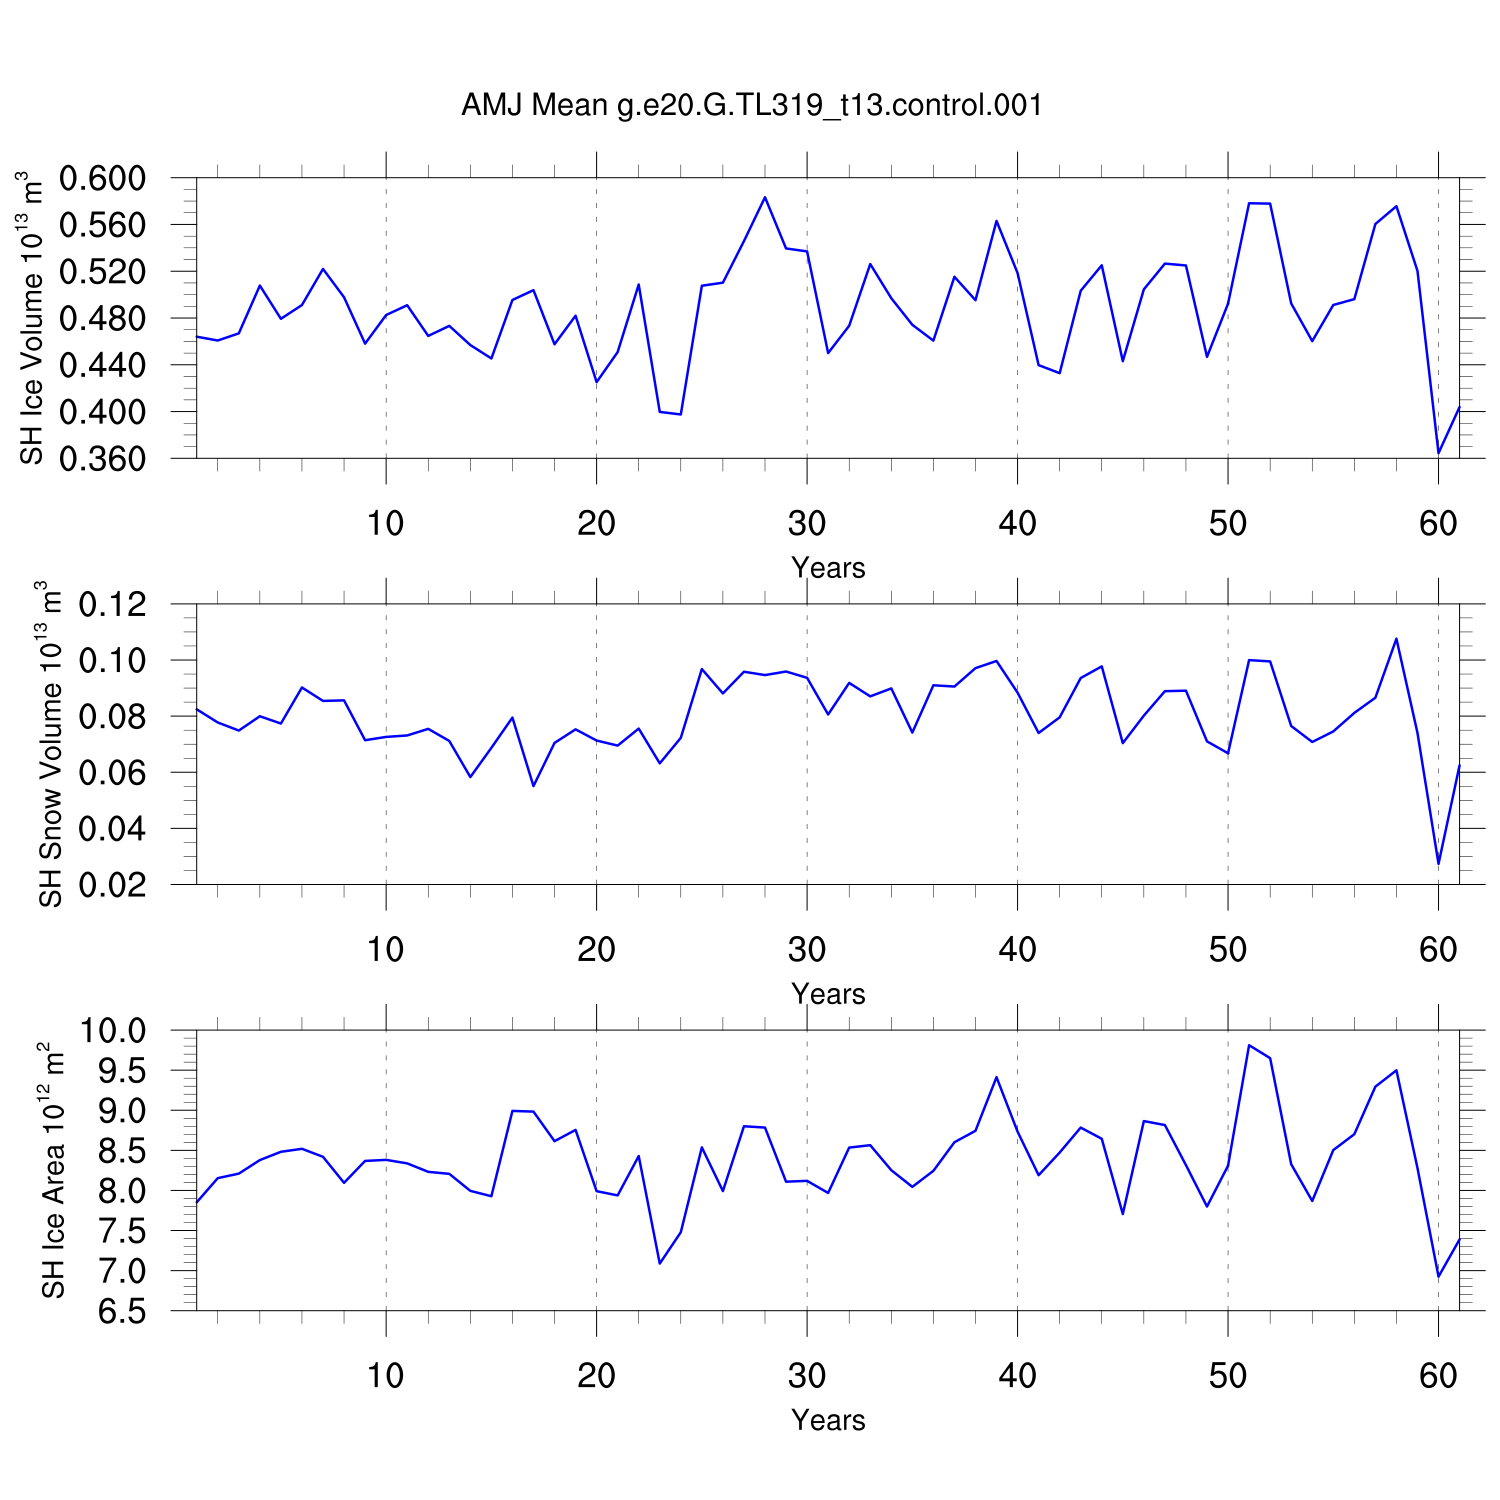
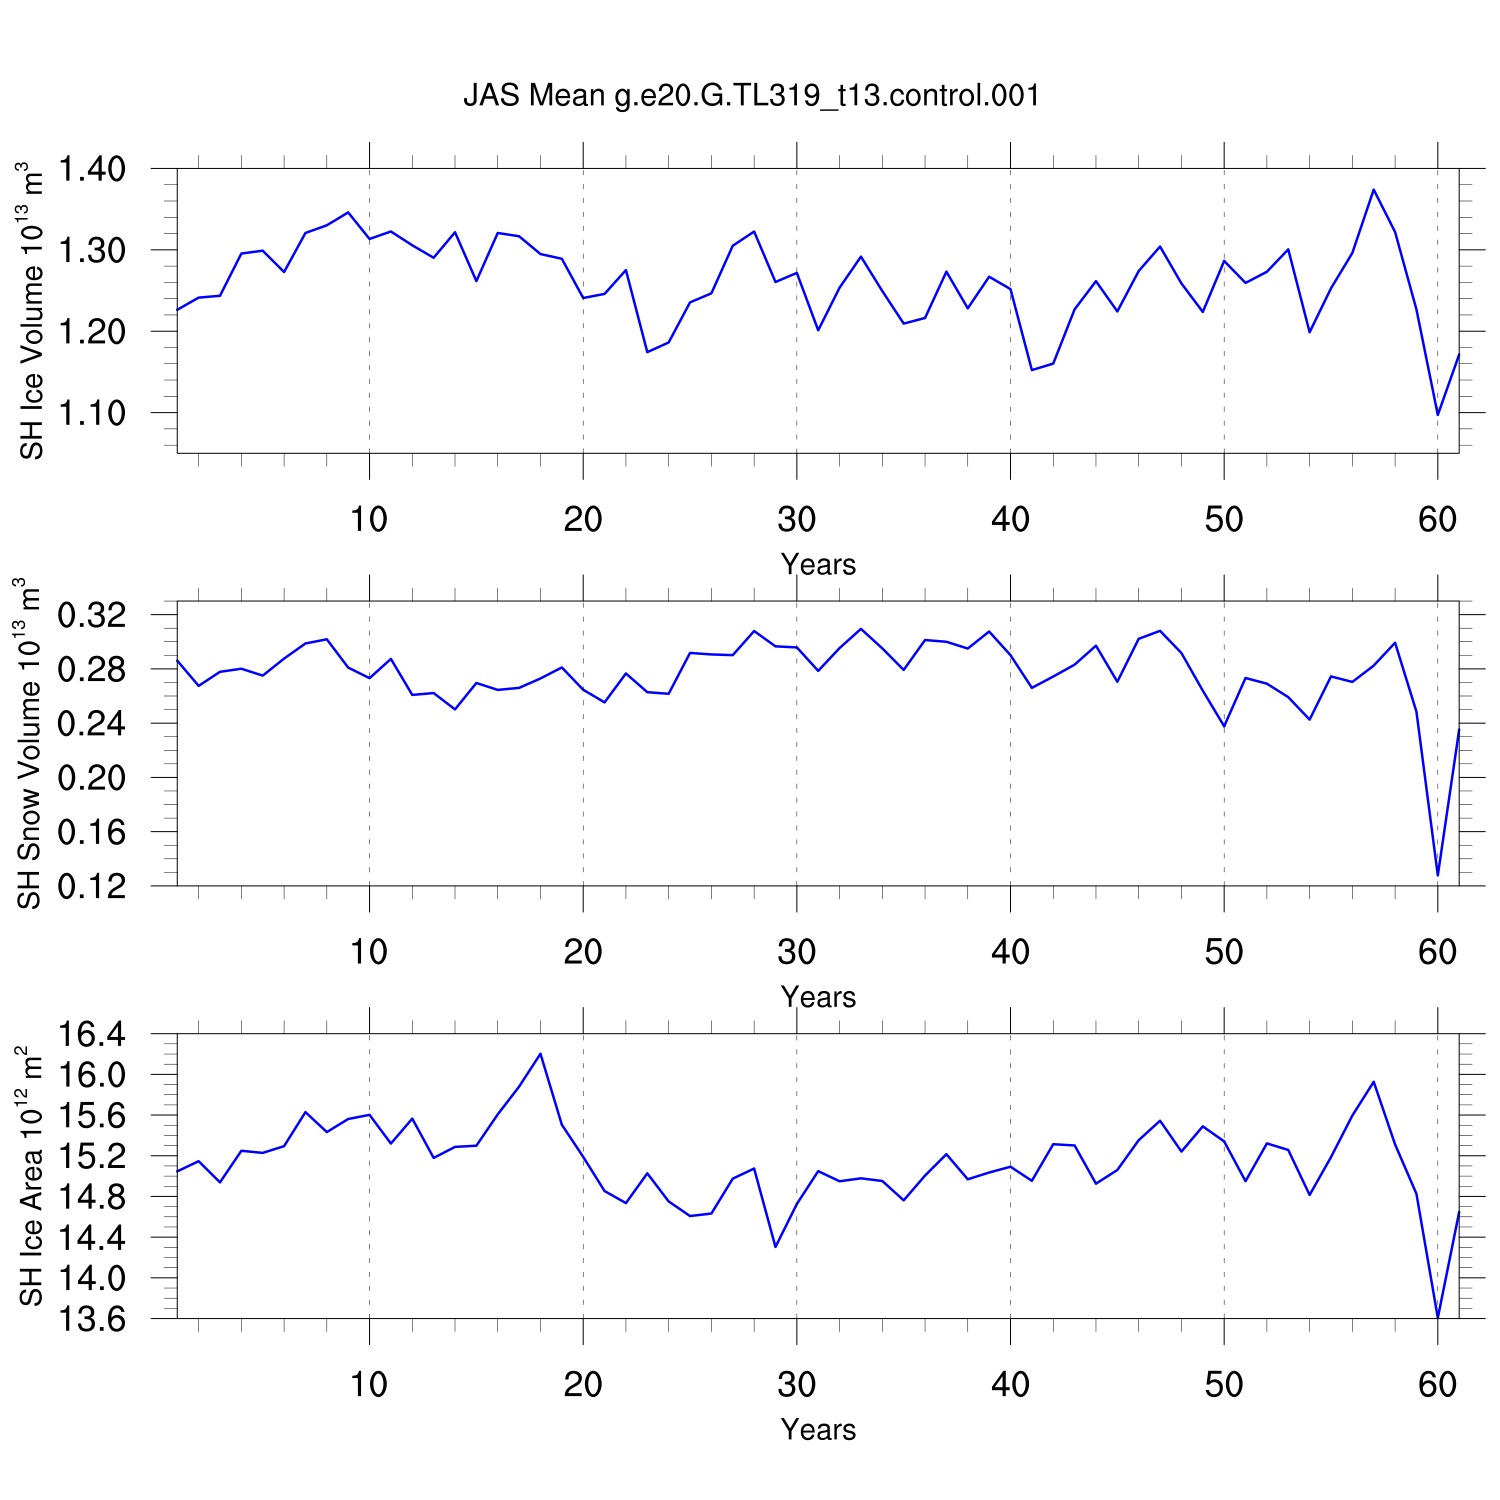
Annual and Seasonal Means
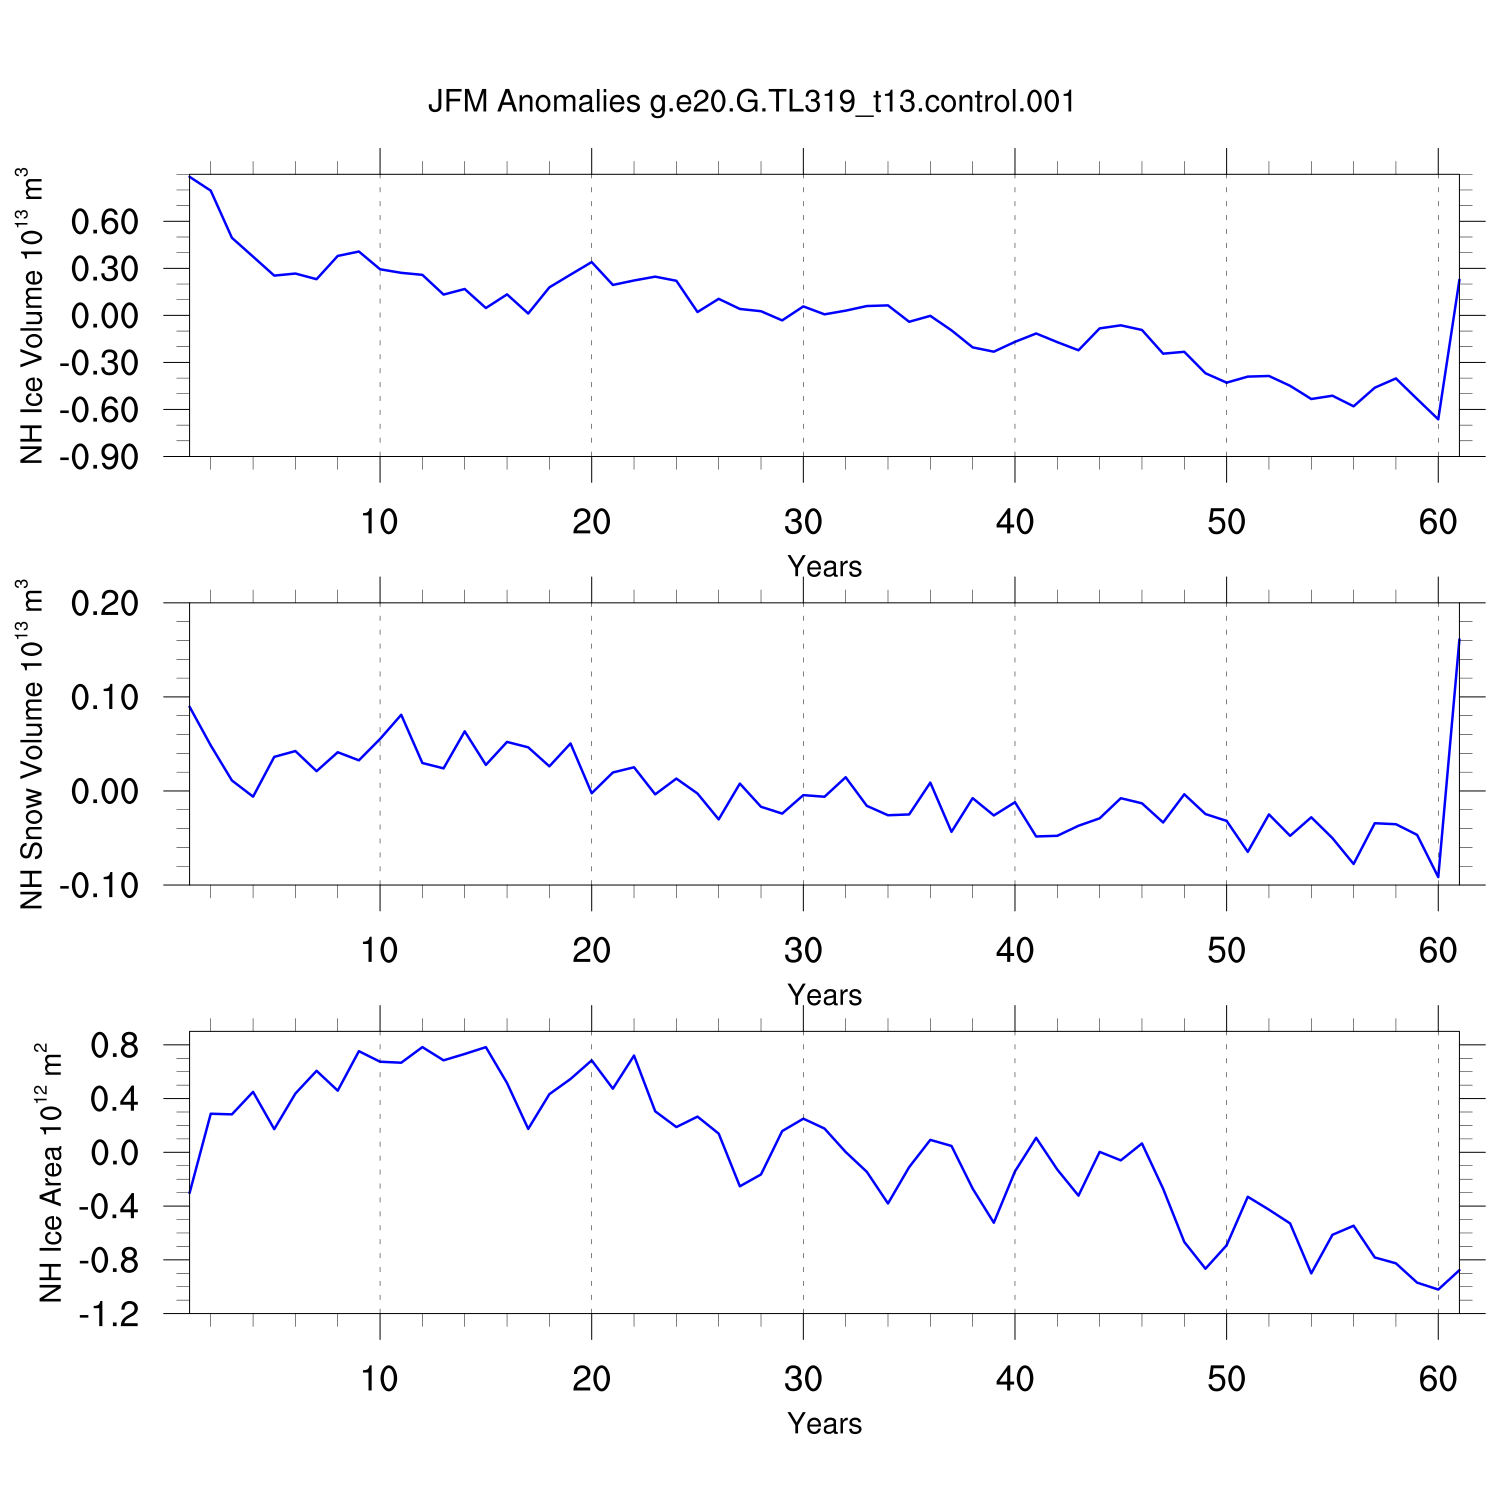
JFM
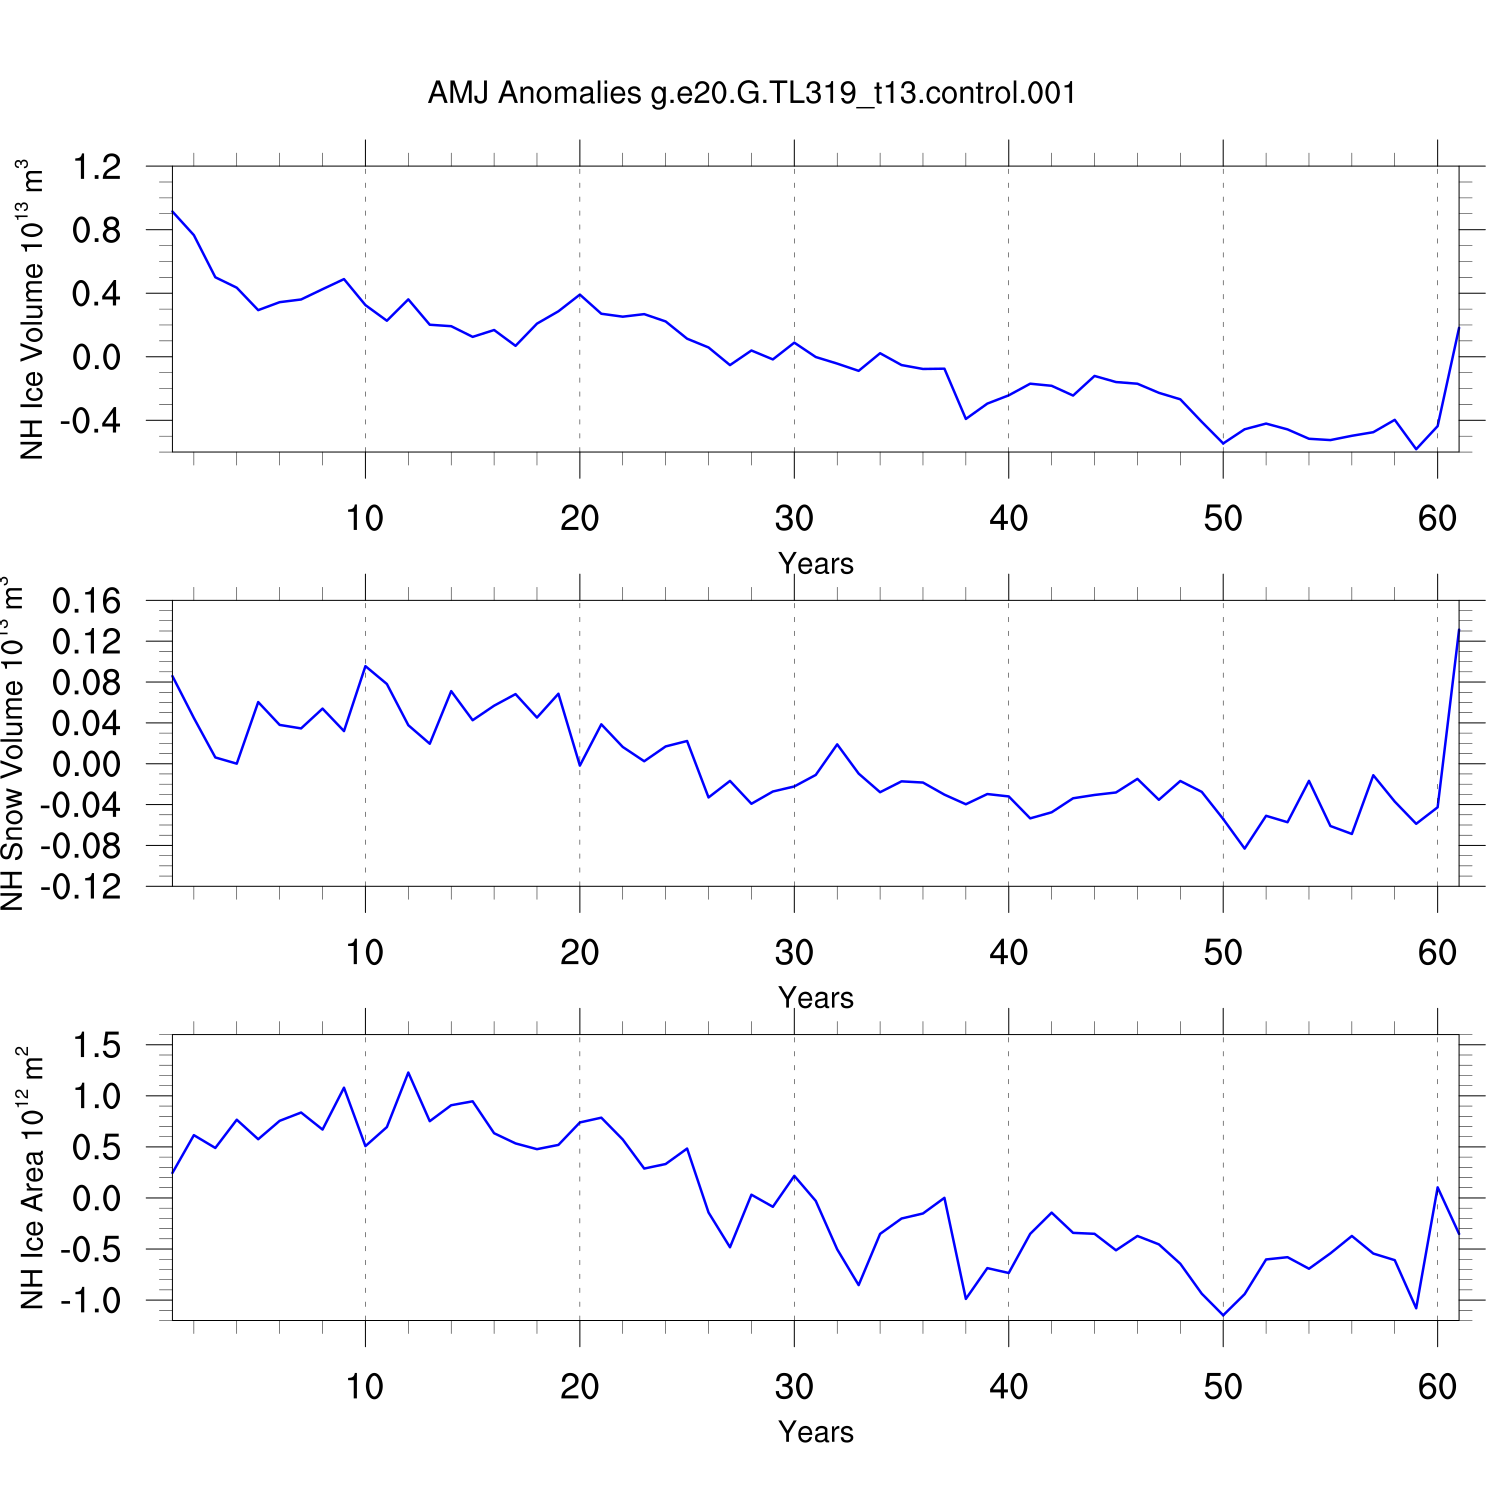
AMJ
JAS
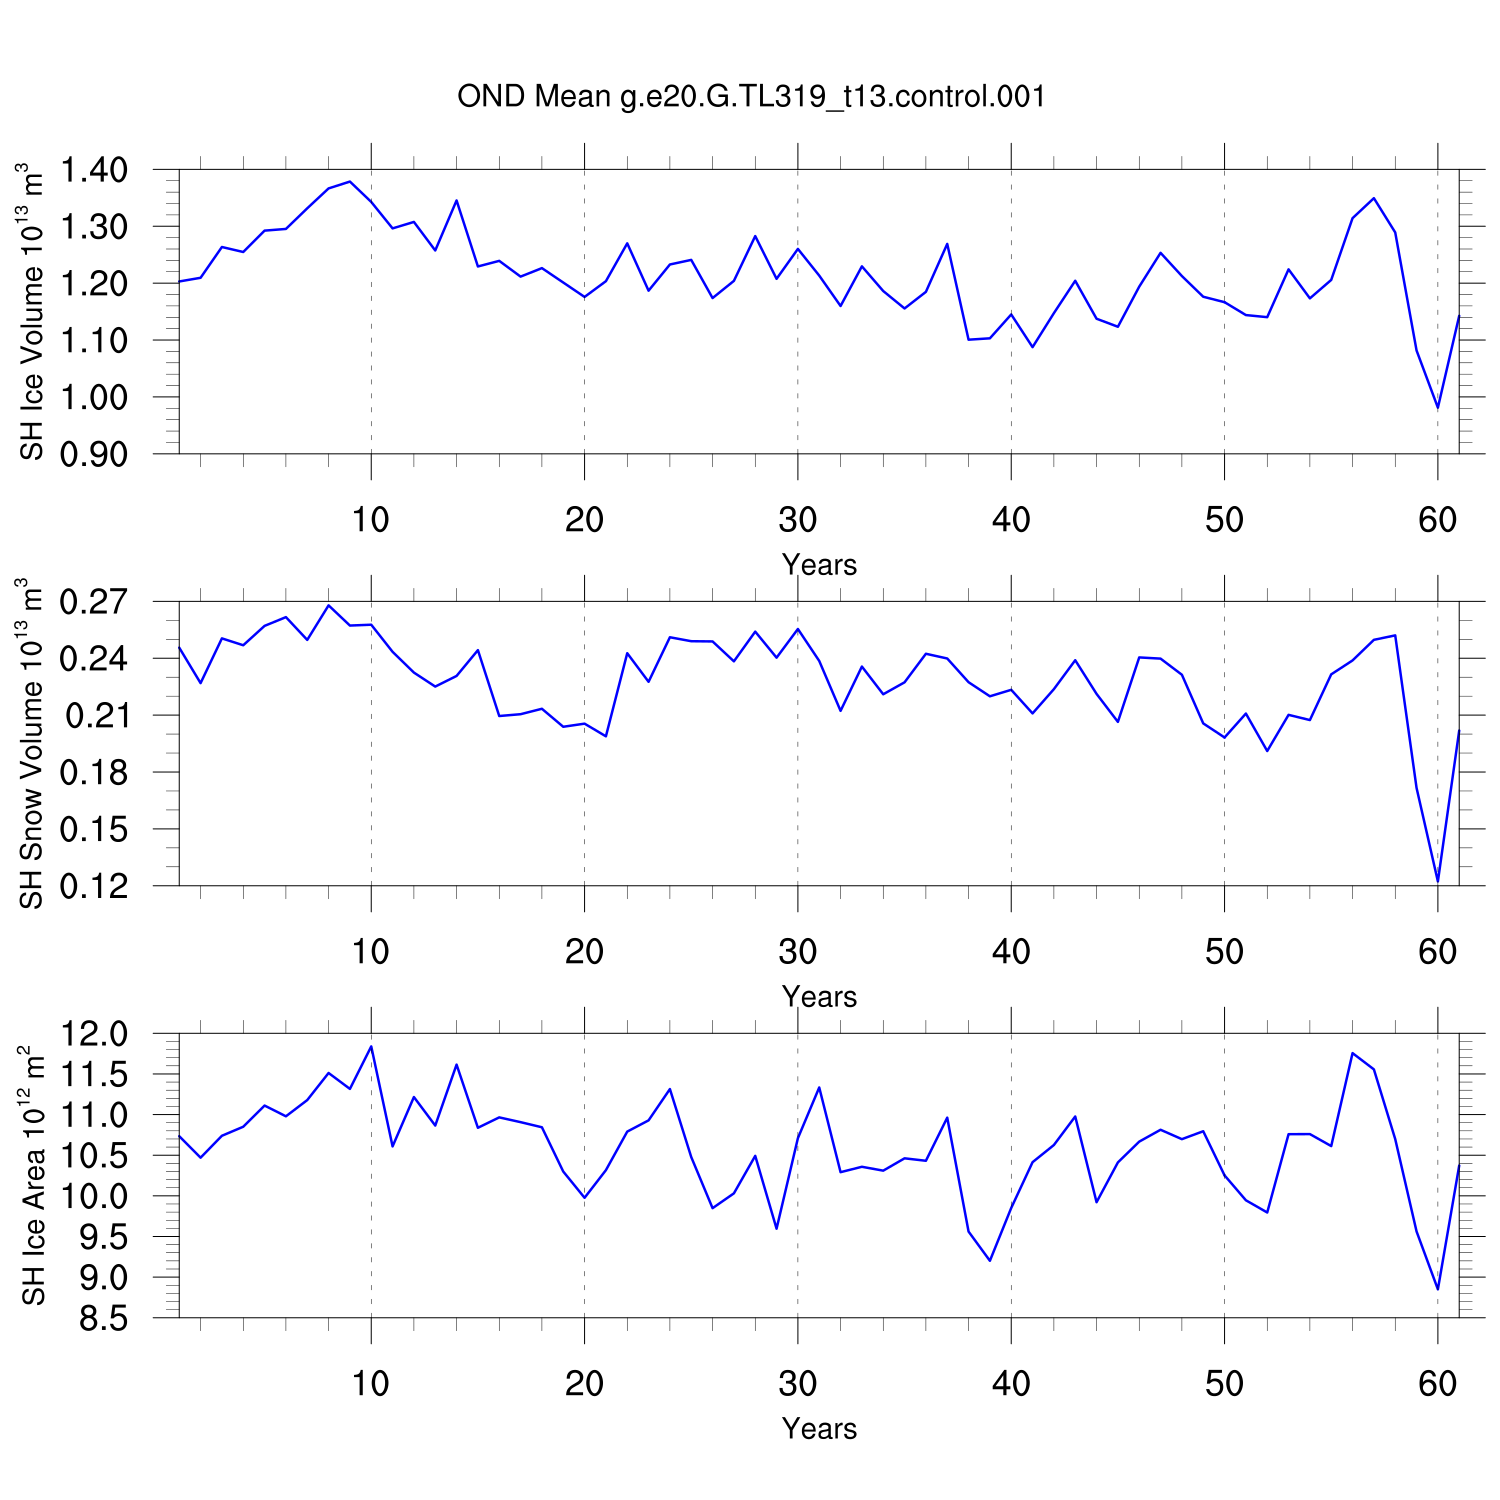
OND
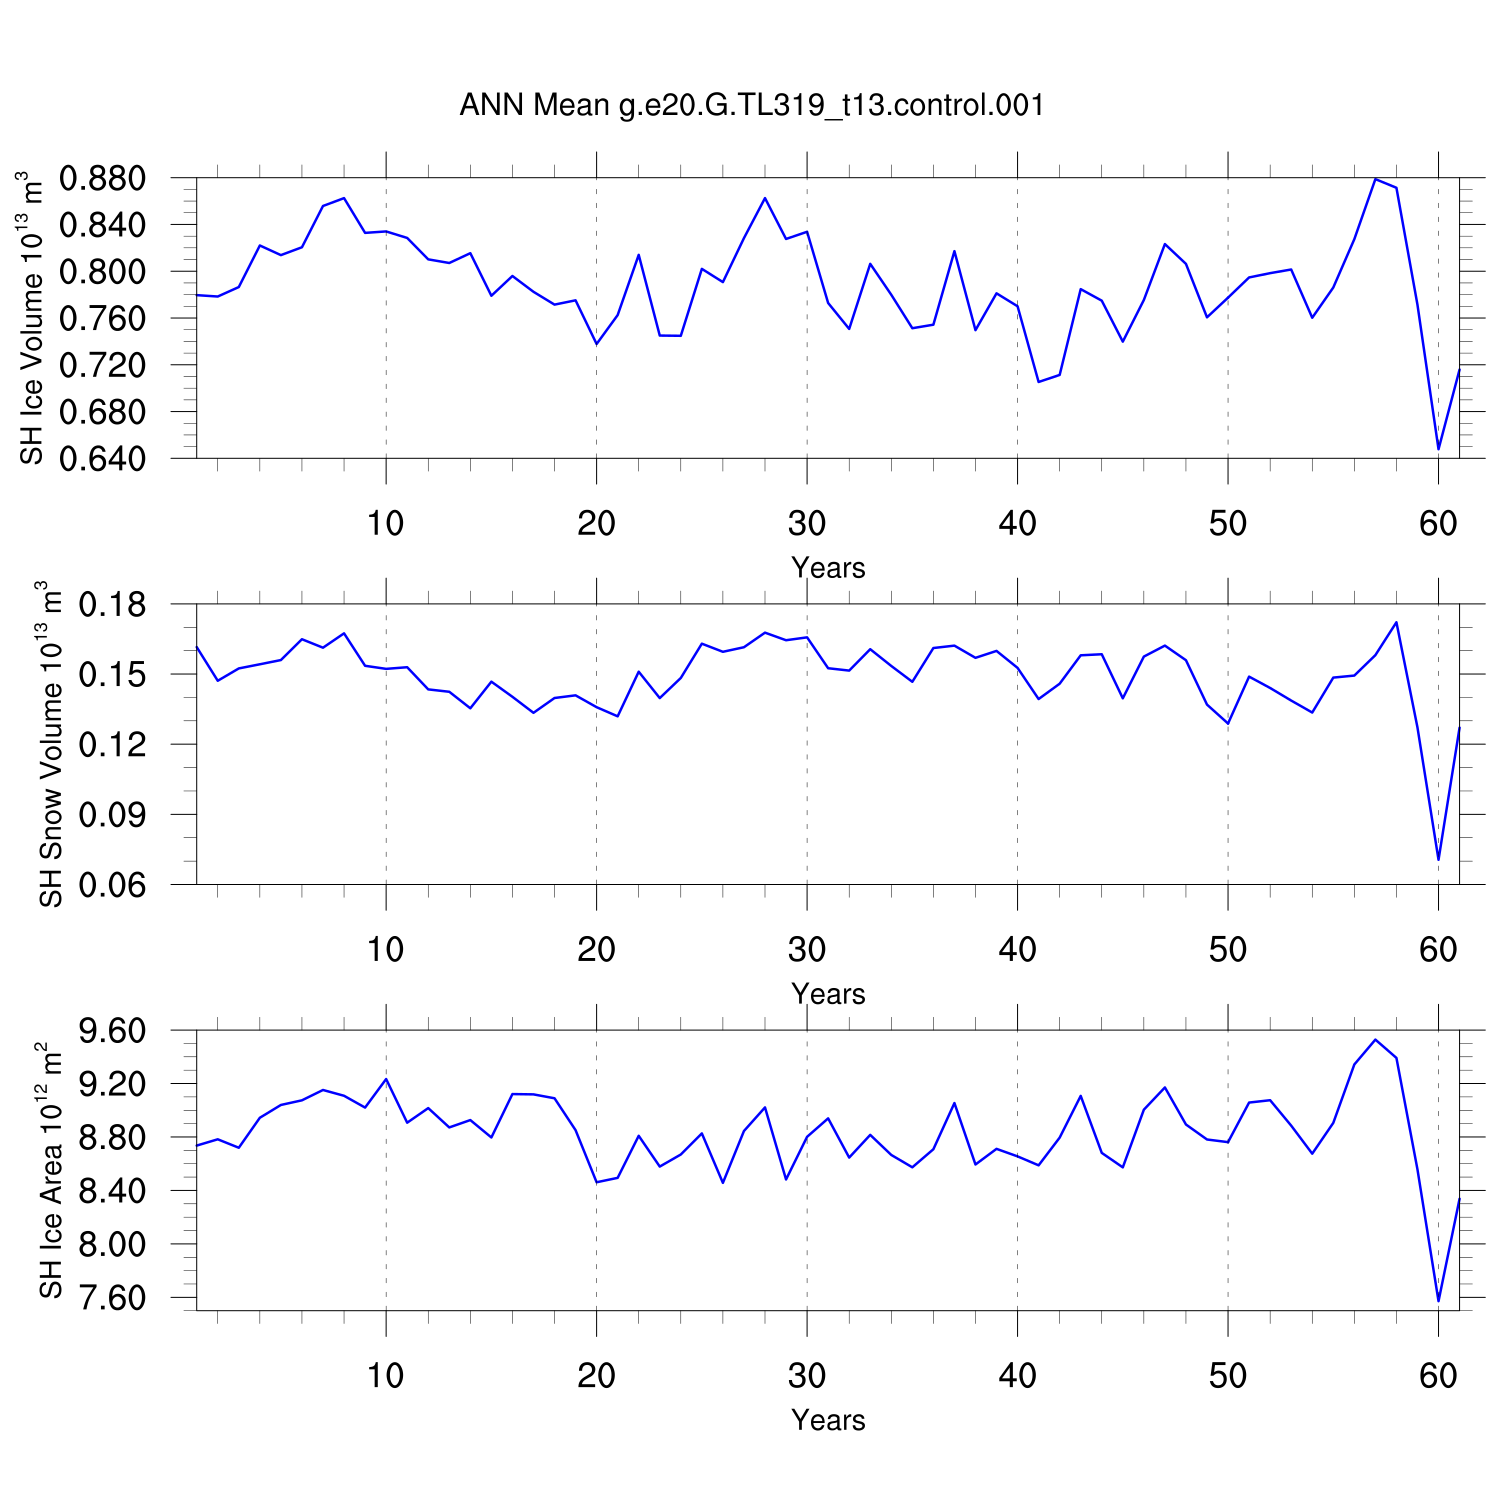
ANN
JFM
AMJ
JAS
OND
ANN
Annual and Seasonal Means vs. LENS members (20thC)
----
----
----
----
----
----
----
----
----
----
Annual and Seasonal Ice Volume vs. PIOMAS (20thC)
----
----
----
----
----
----
----
----
----
----
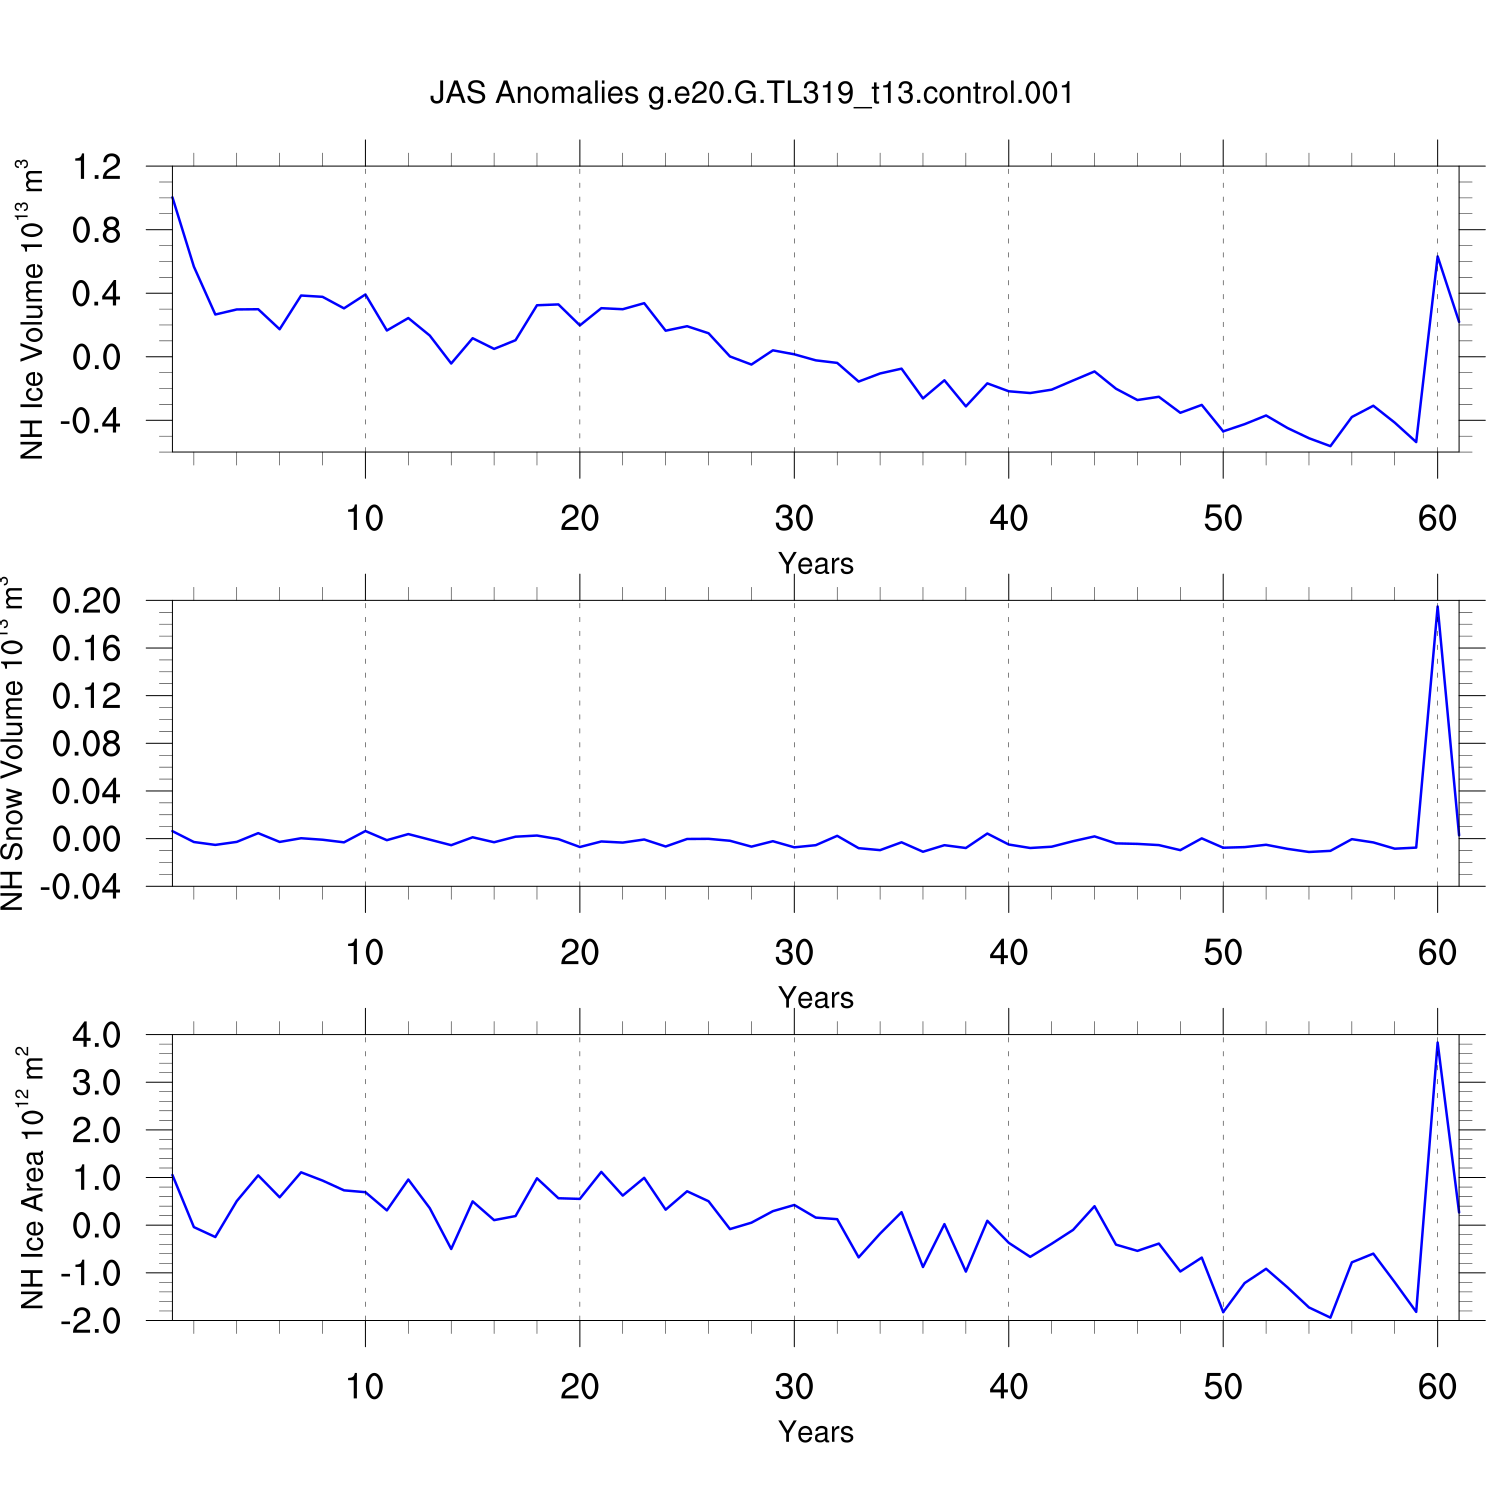
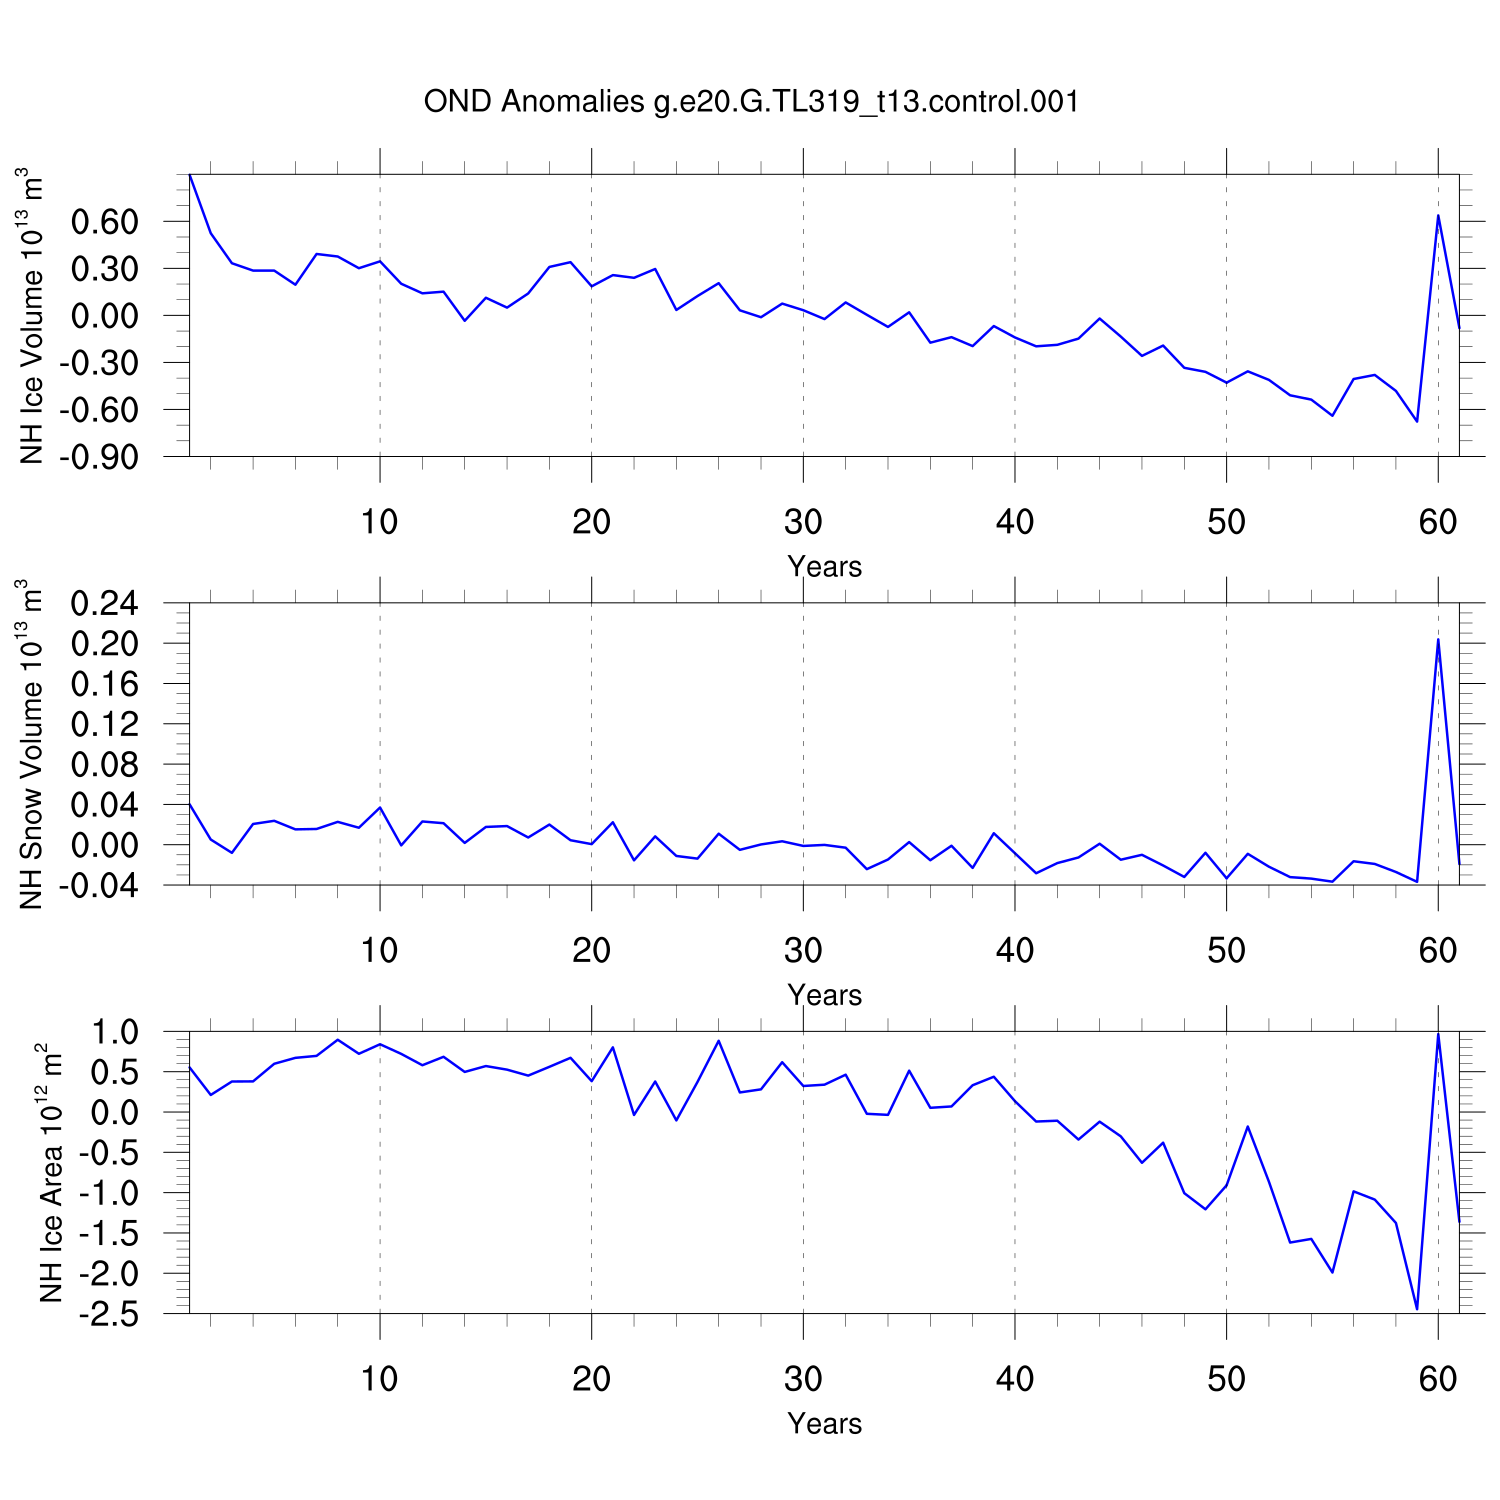
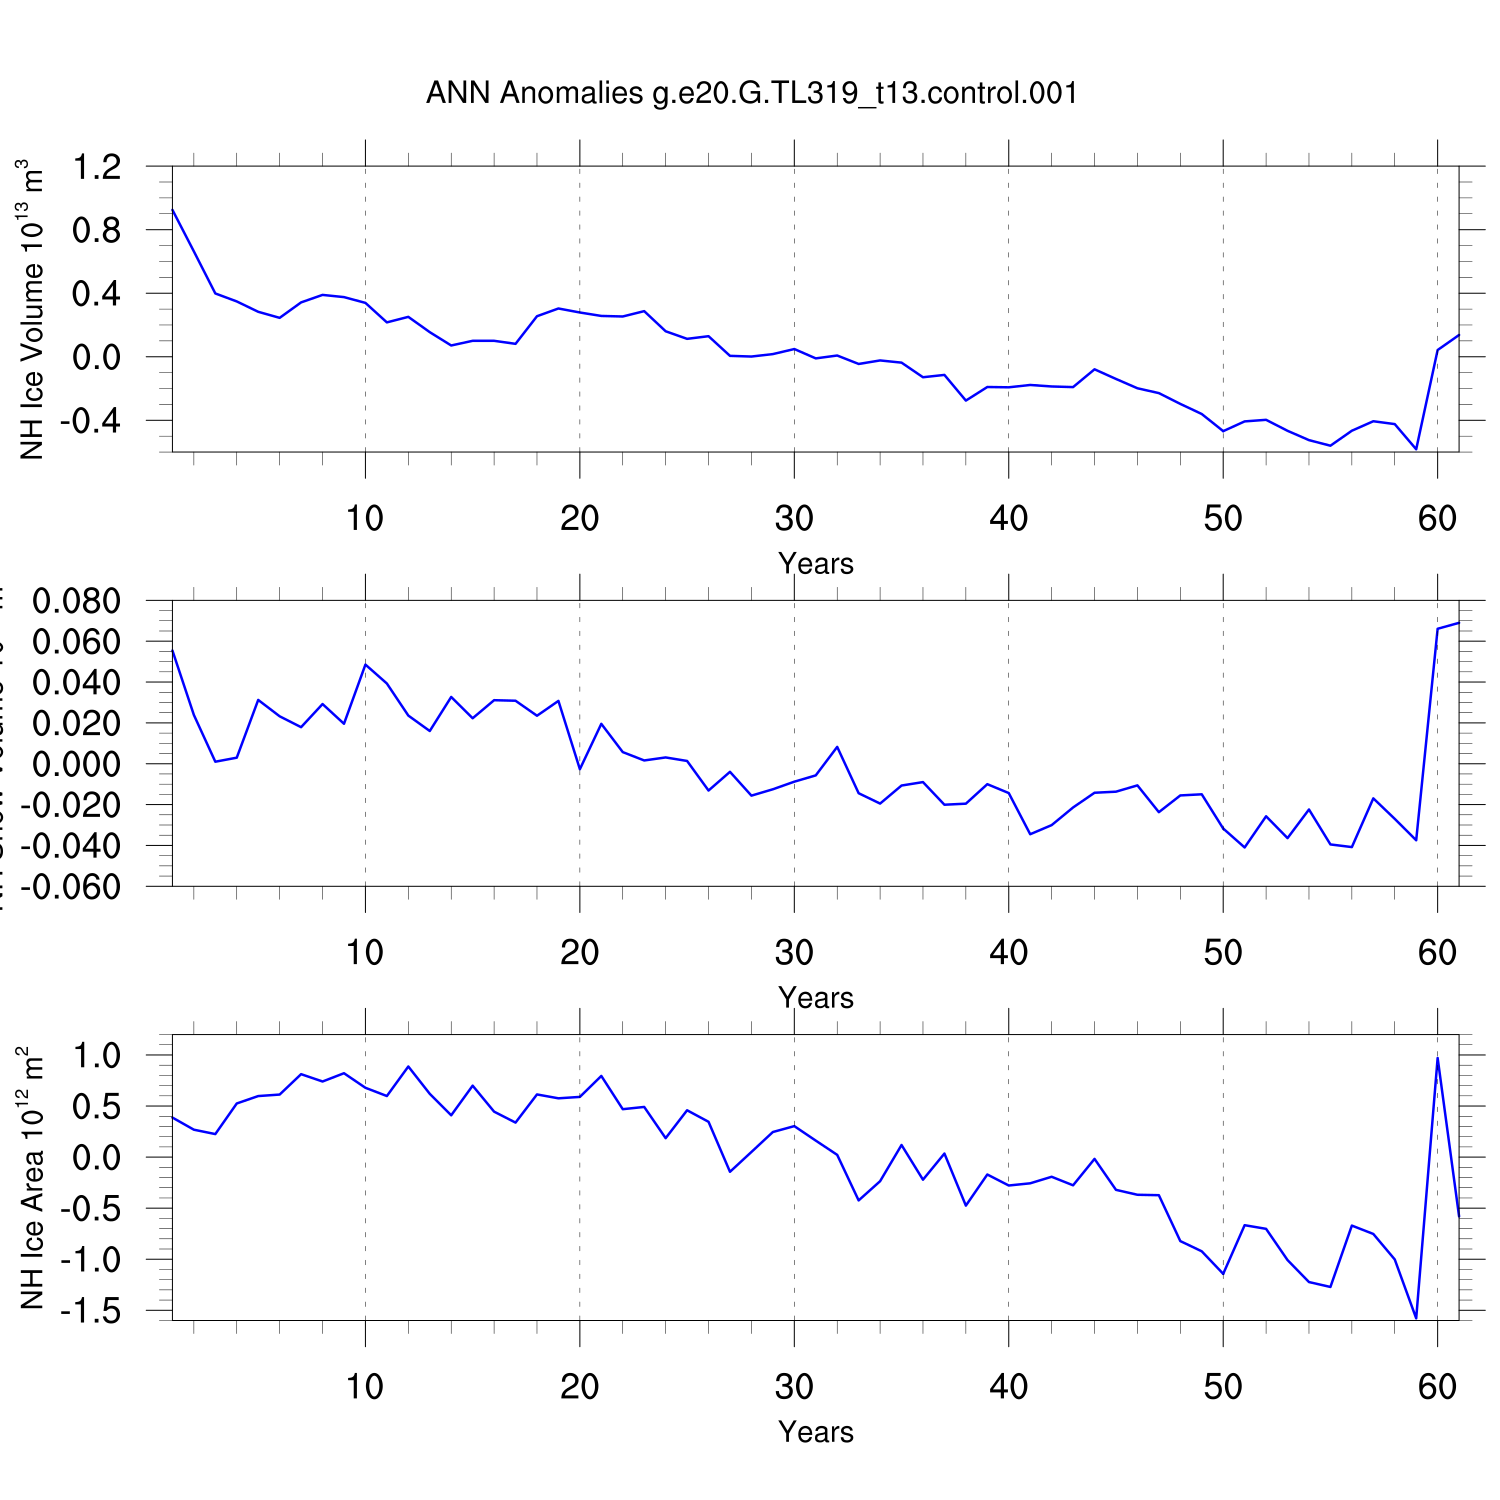
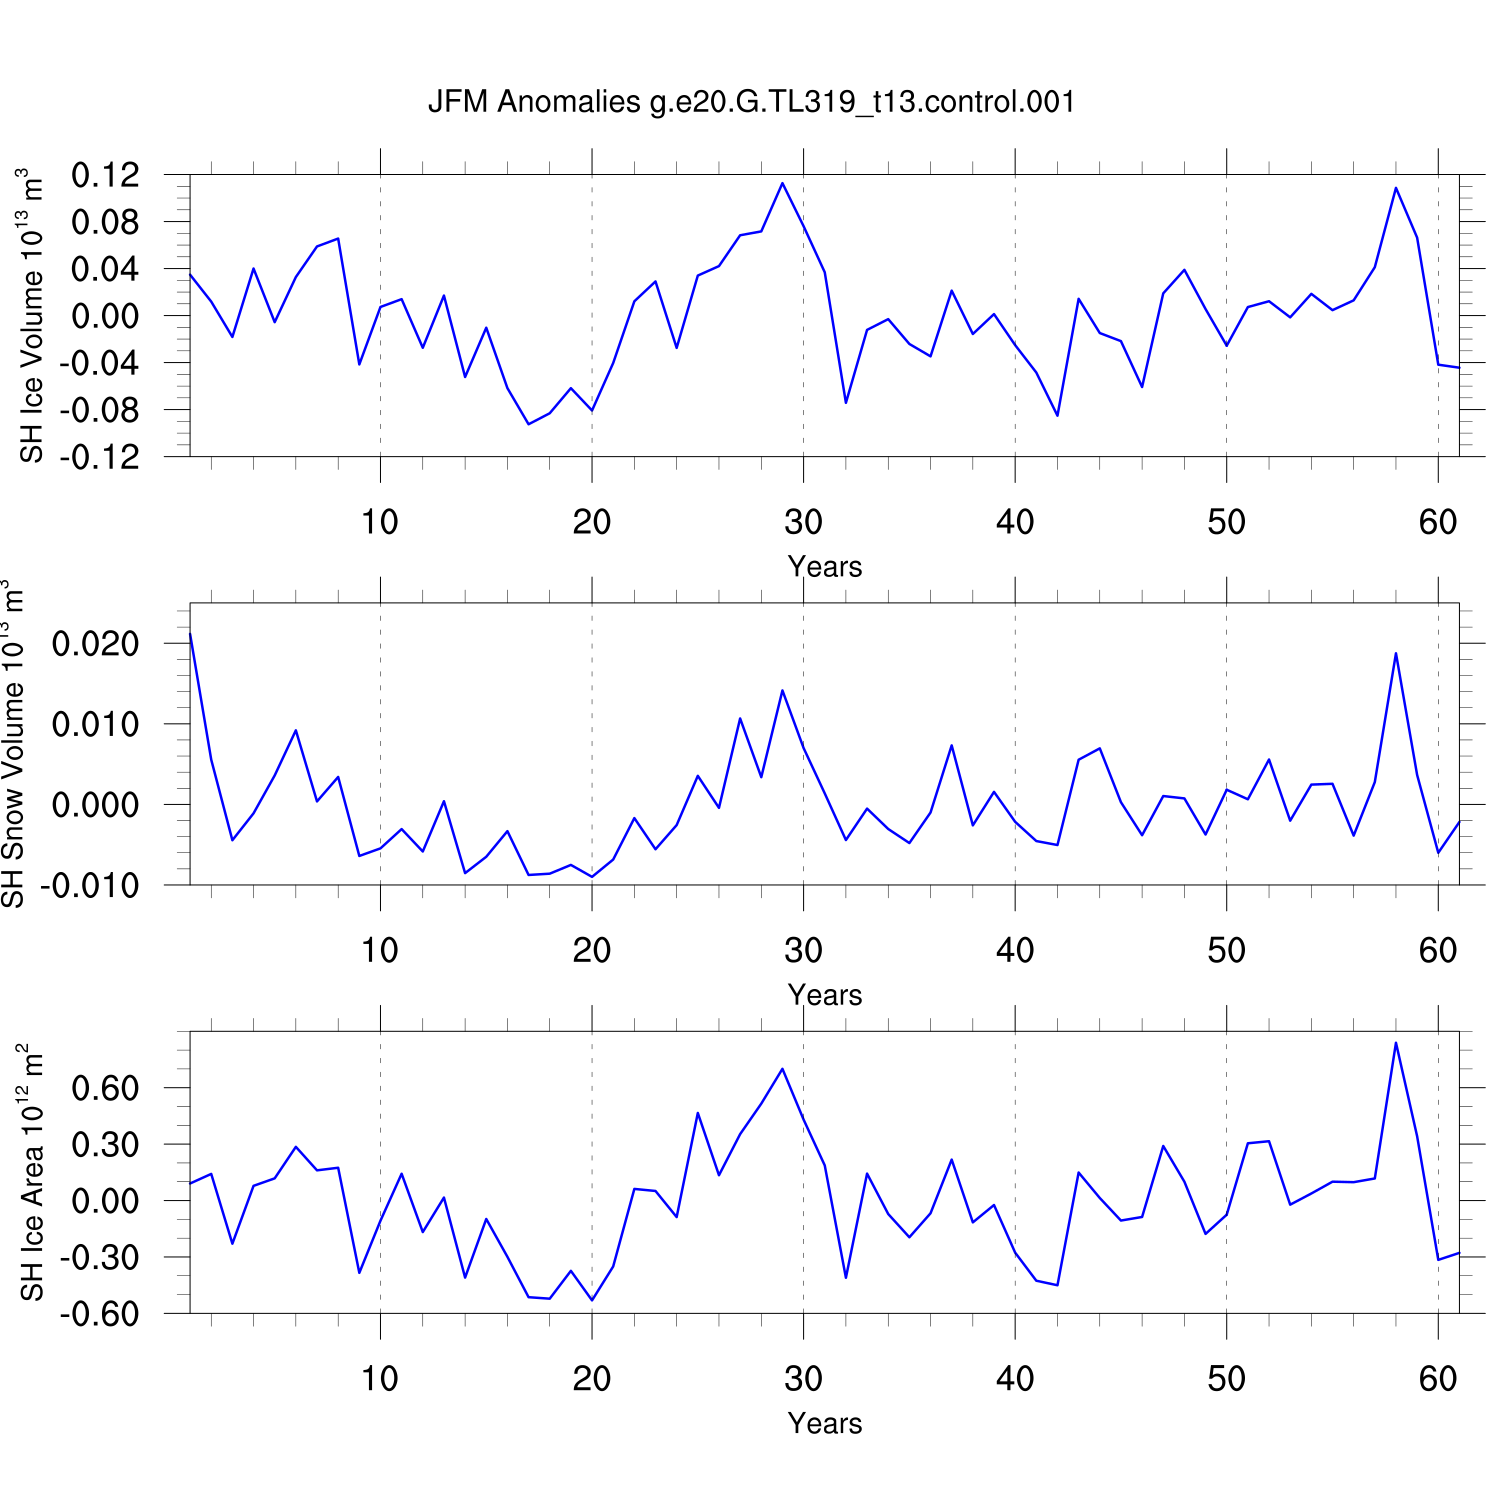
Annual and Seasonal Anomalies
JFM
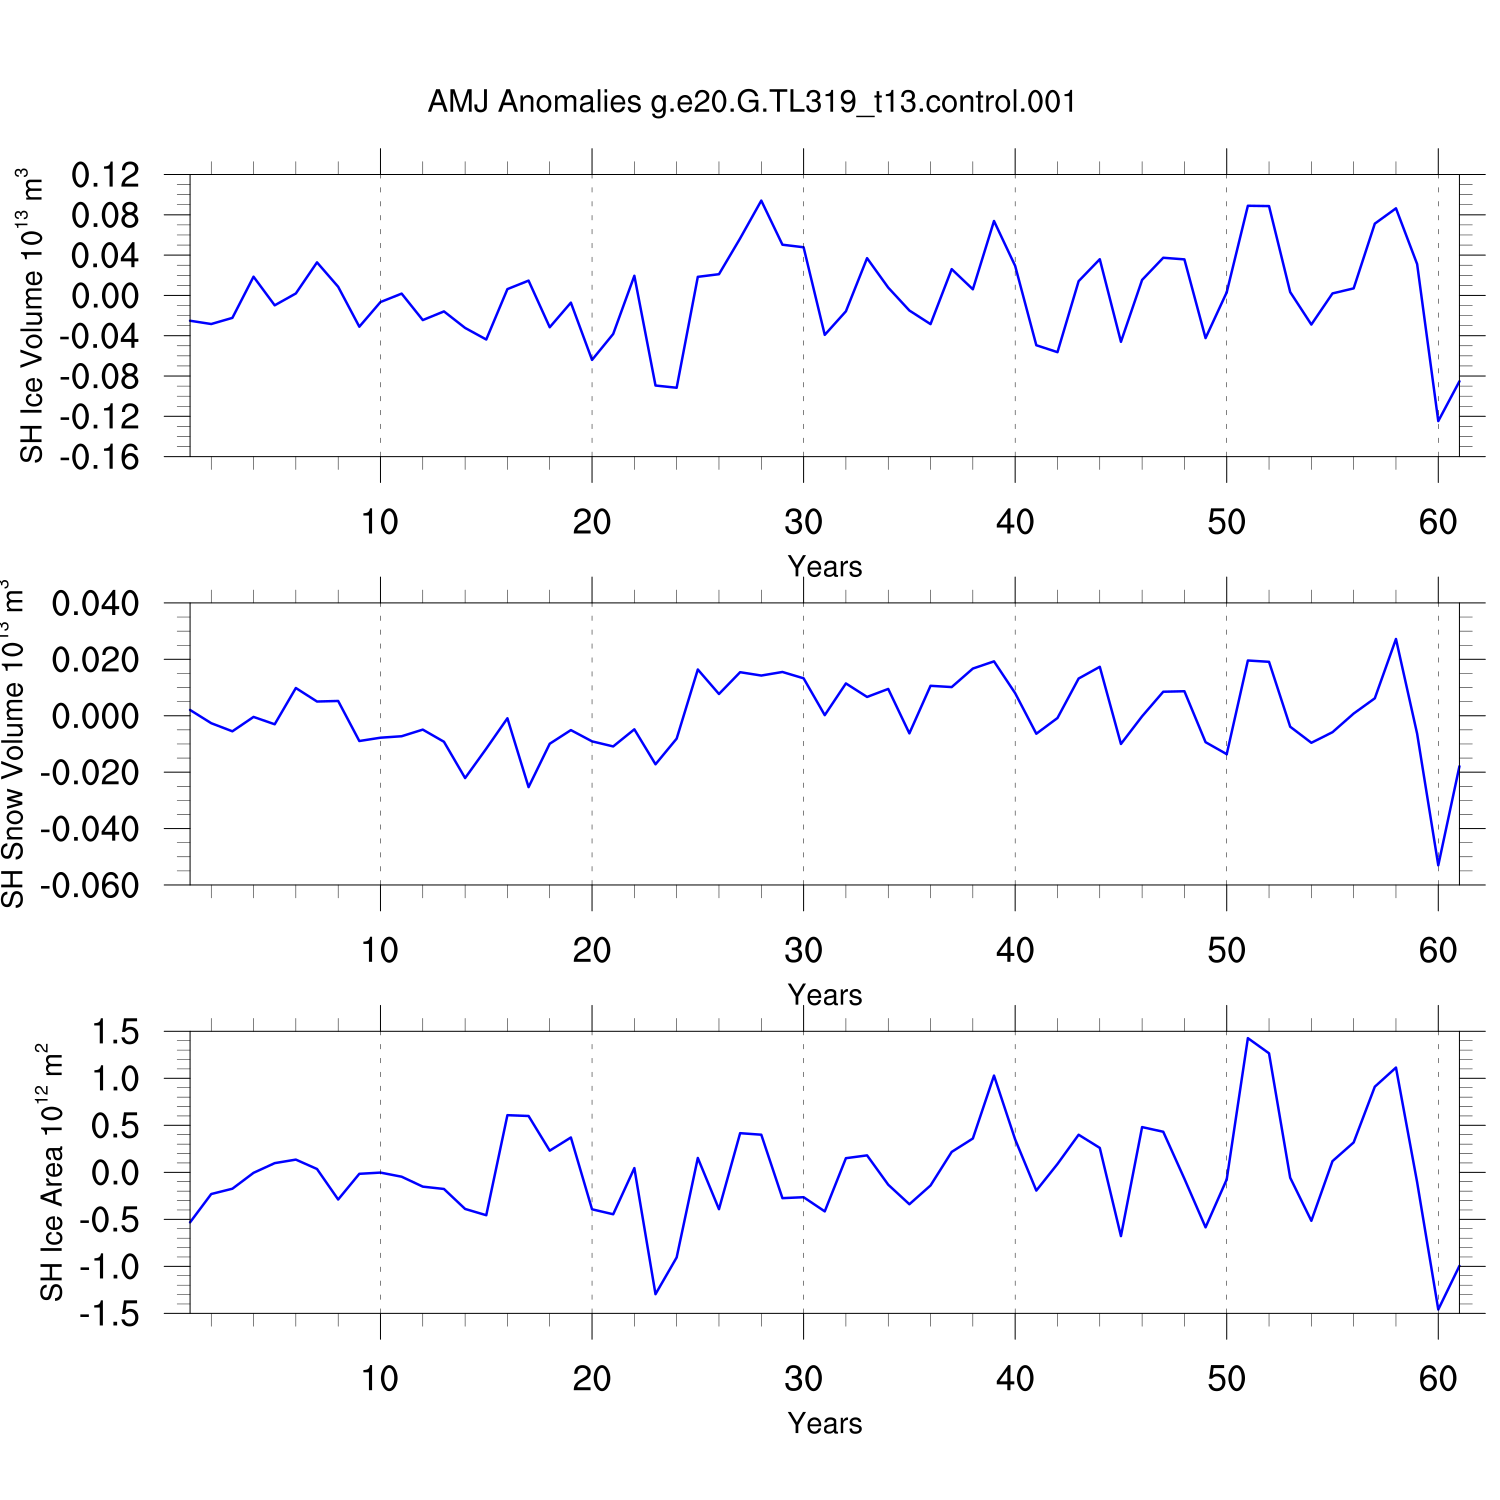
AMJ
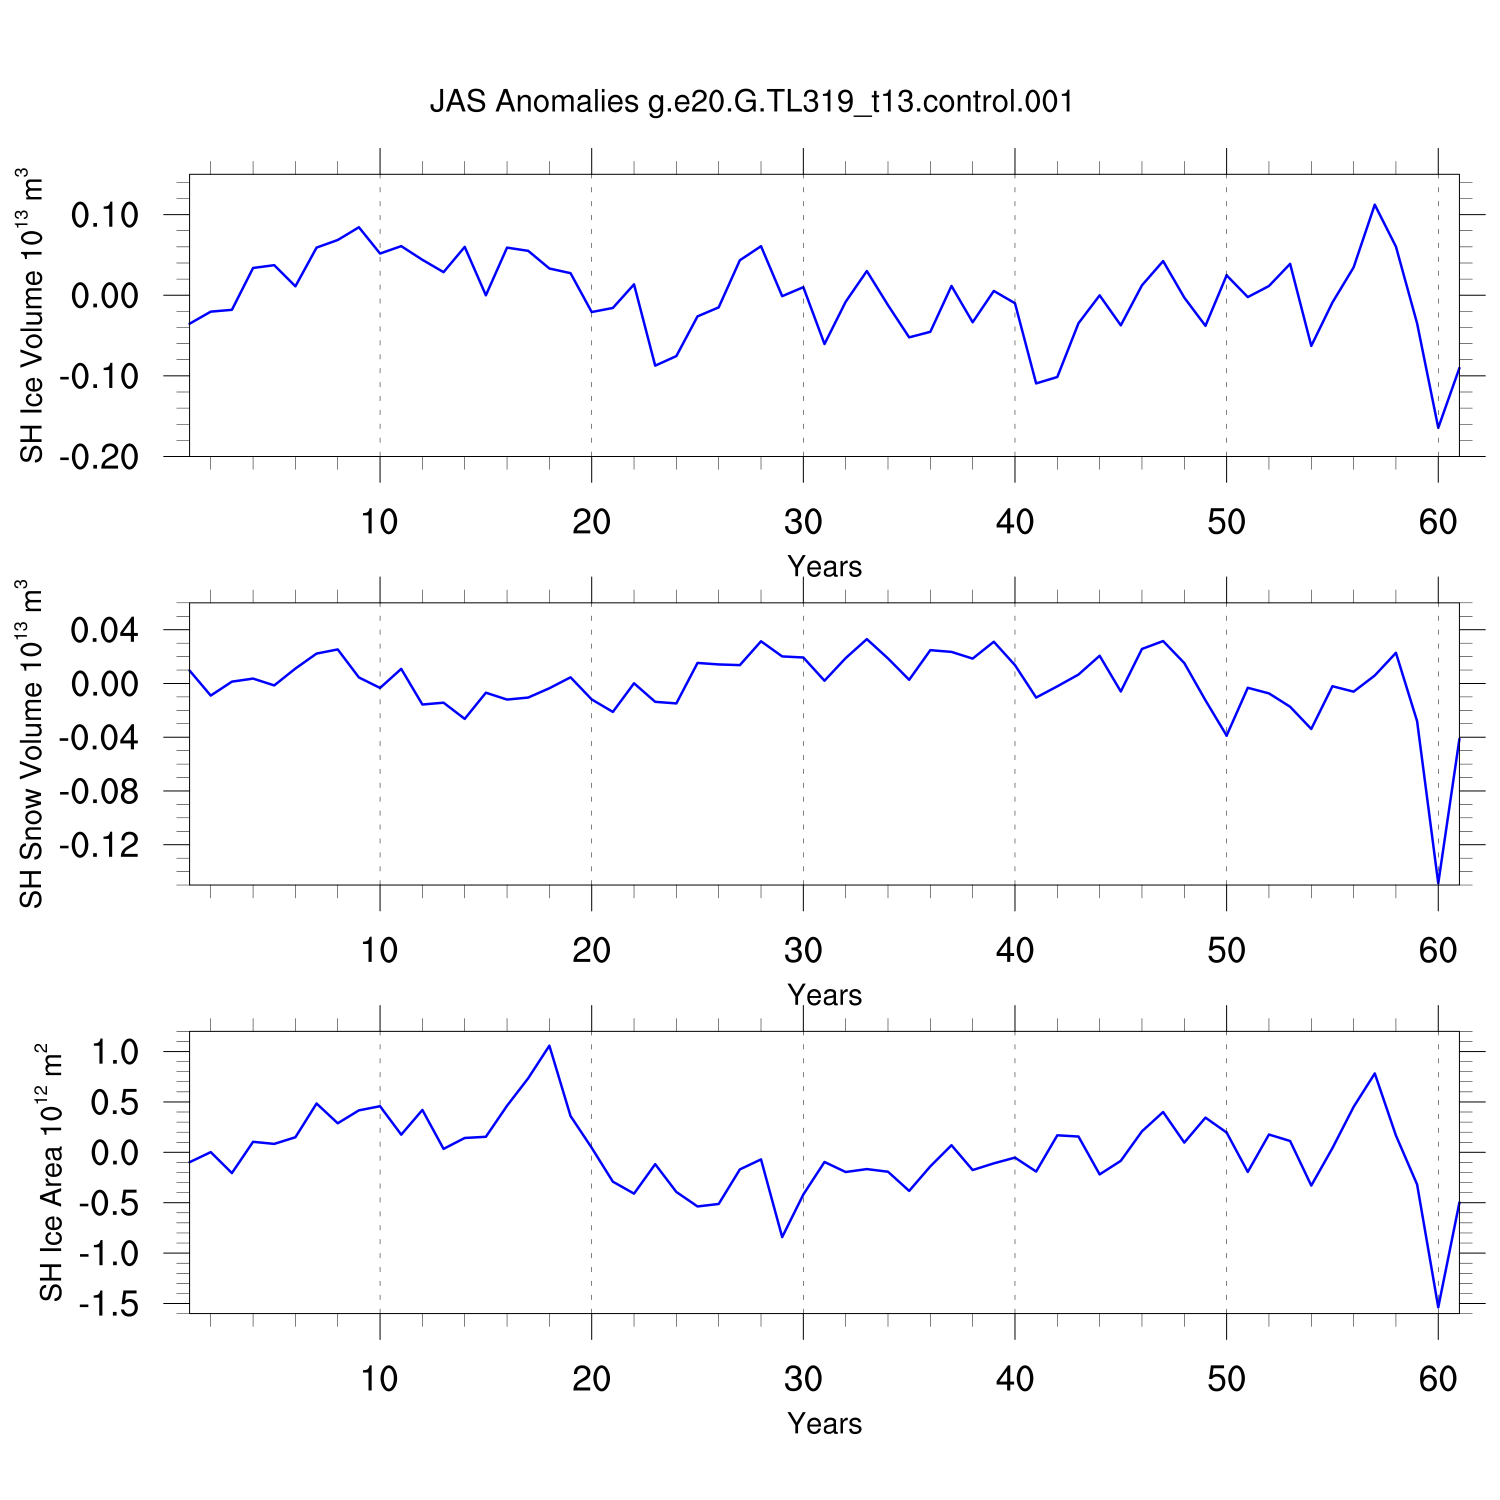
JAS
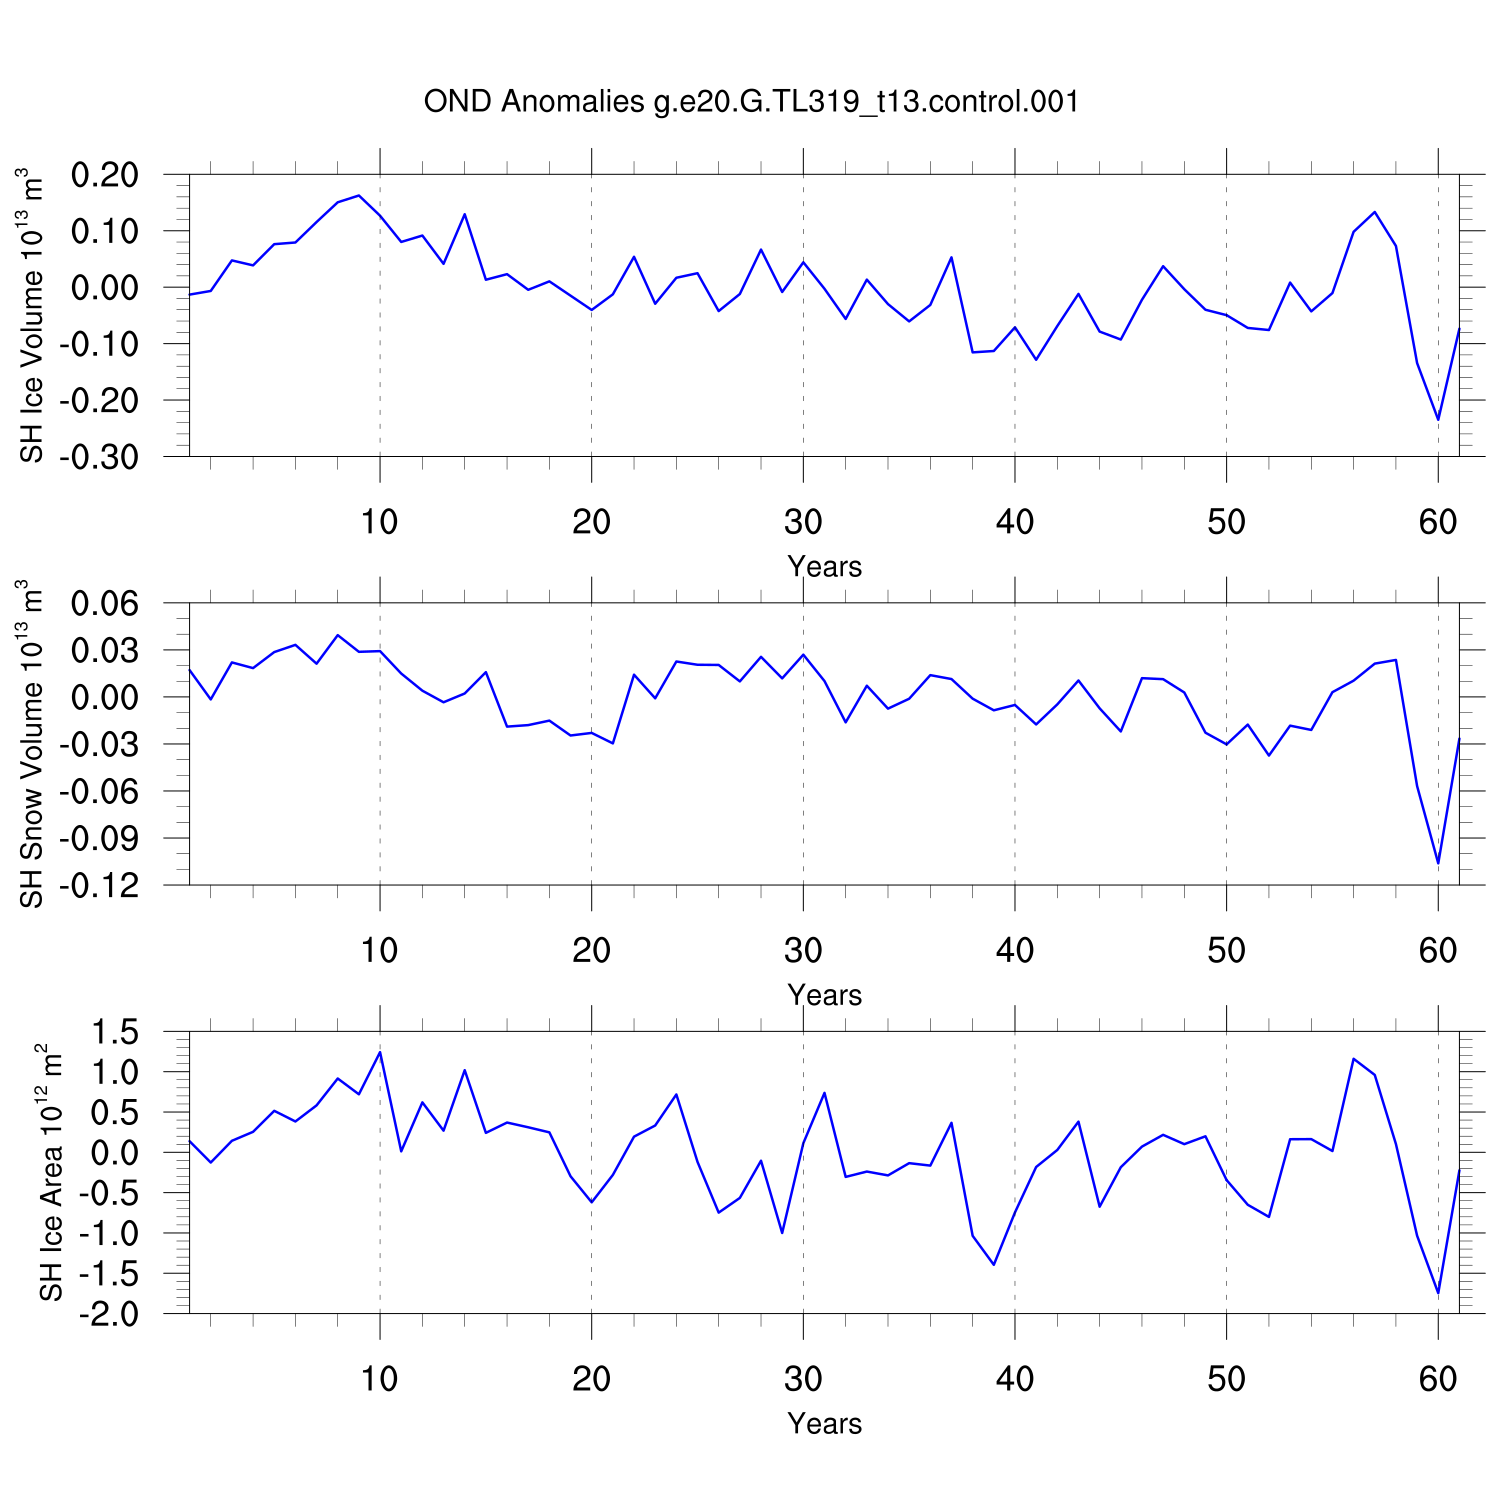
OND
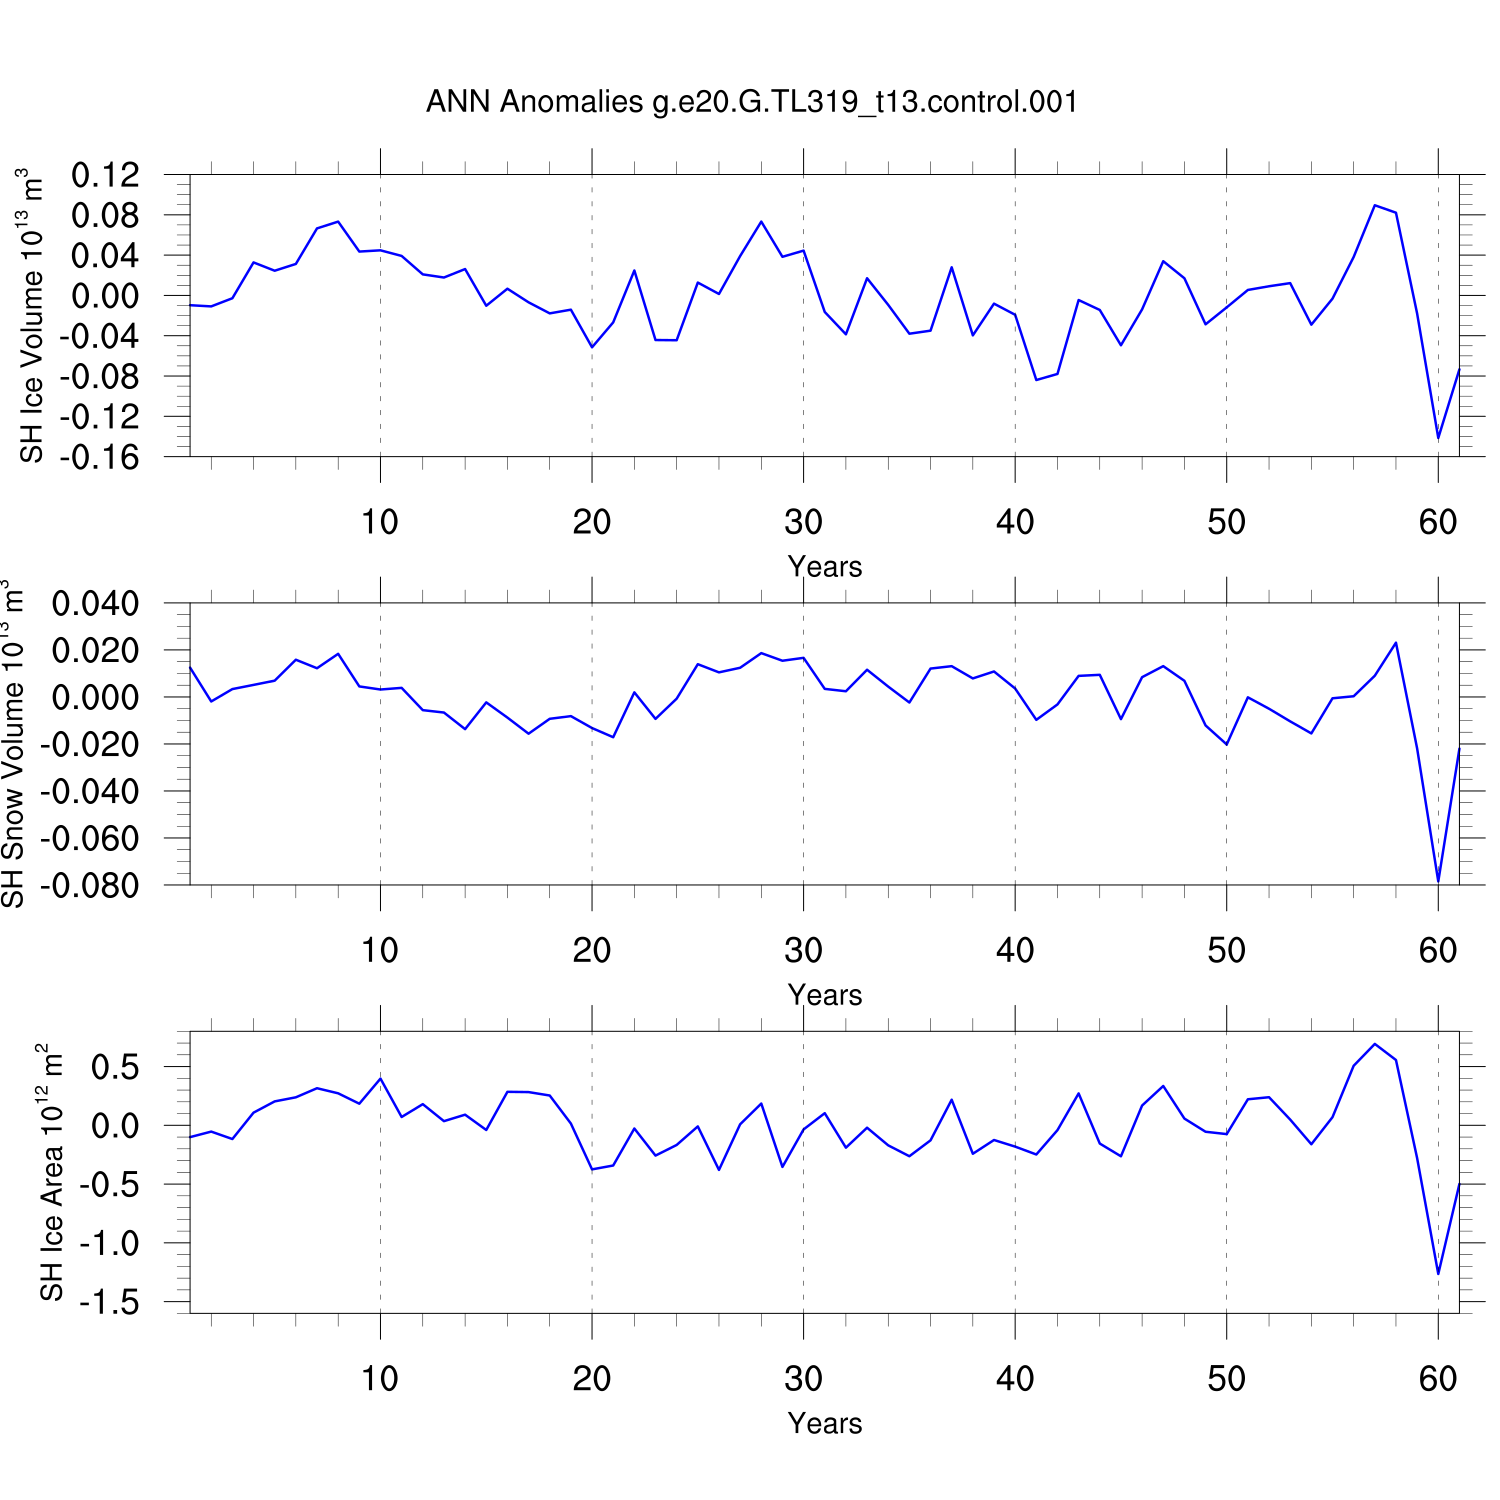
ANN
JFM
AMJ
JAS
OND
ANN