
ctsm51d130_ne30pg3_GSWP3V1_LMWG_dev8_1850
and
ctsm51_cesm23a16bctsm51d130_ne30pg3ne30pg3mg17_GSWP3V1_1850
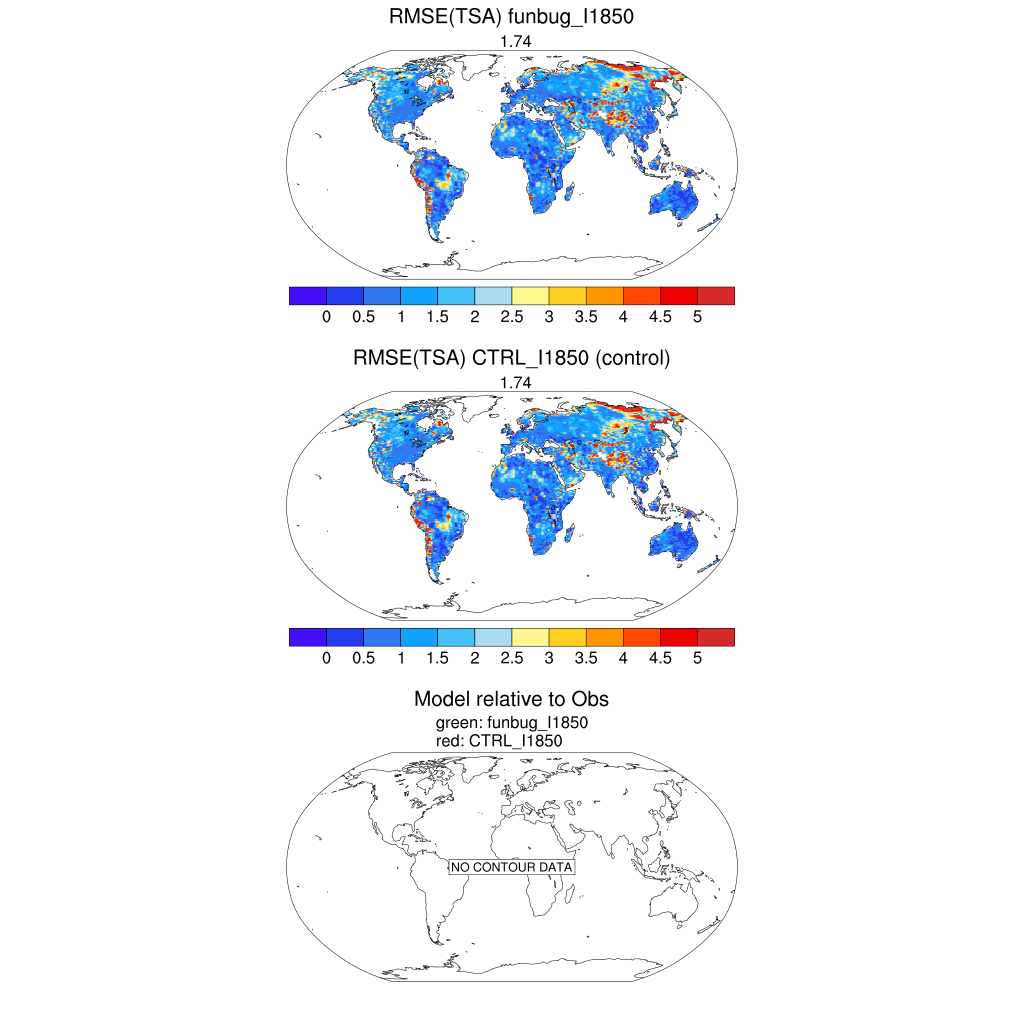
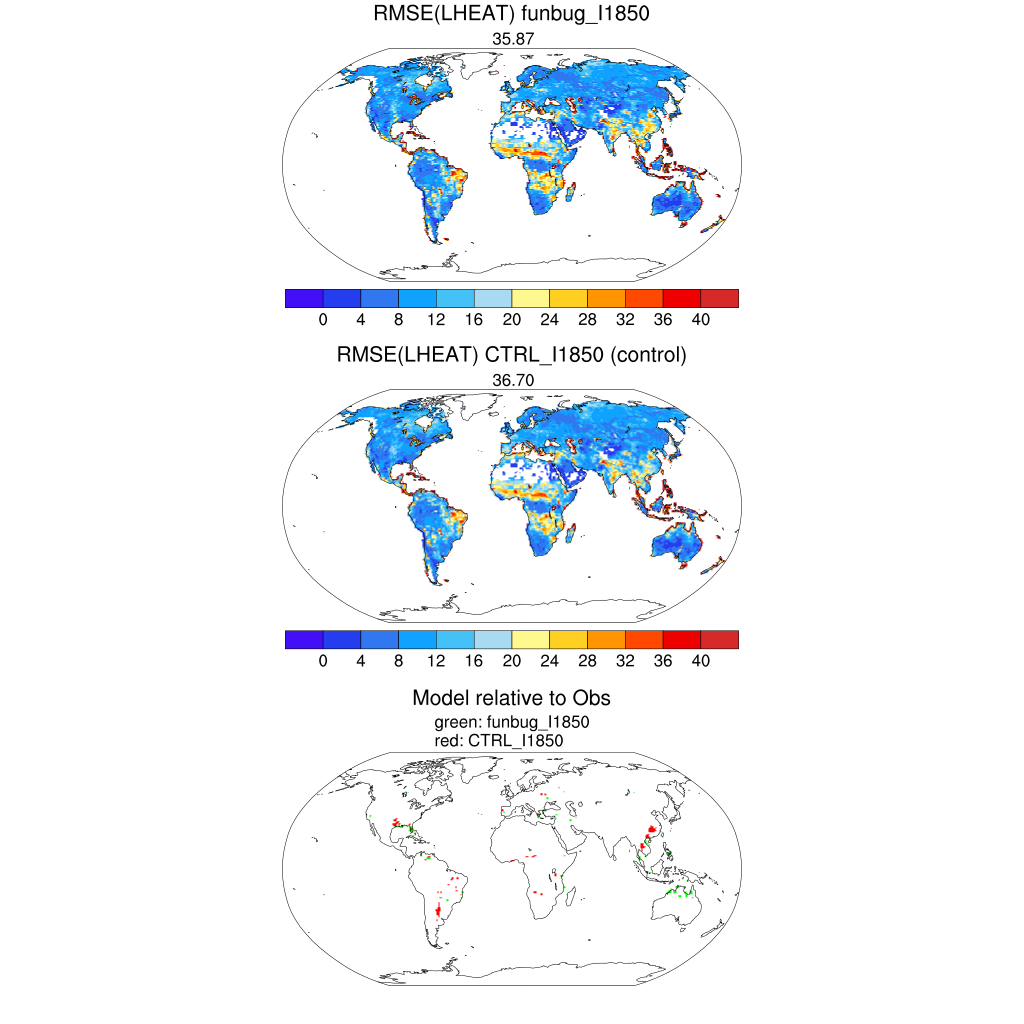
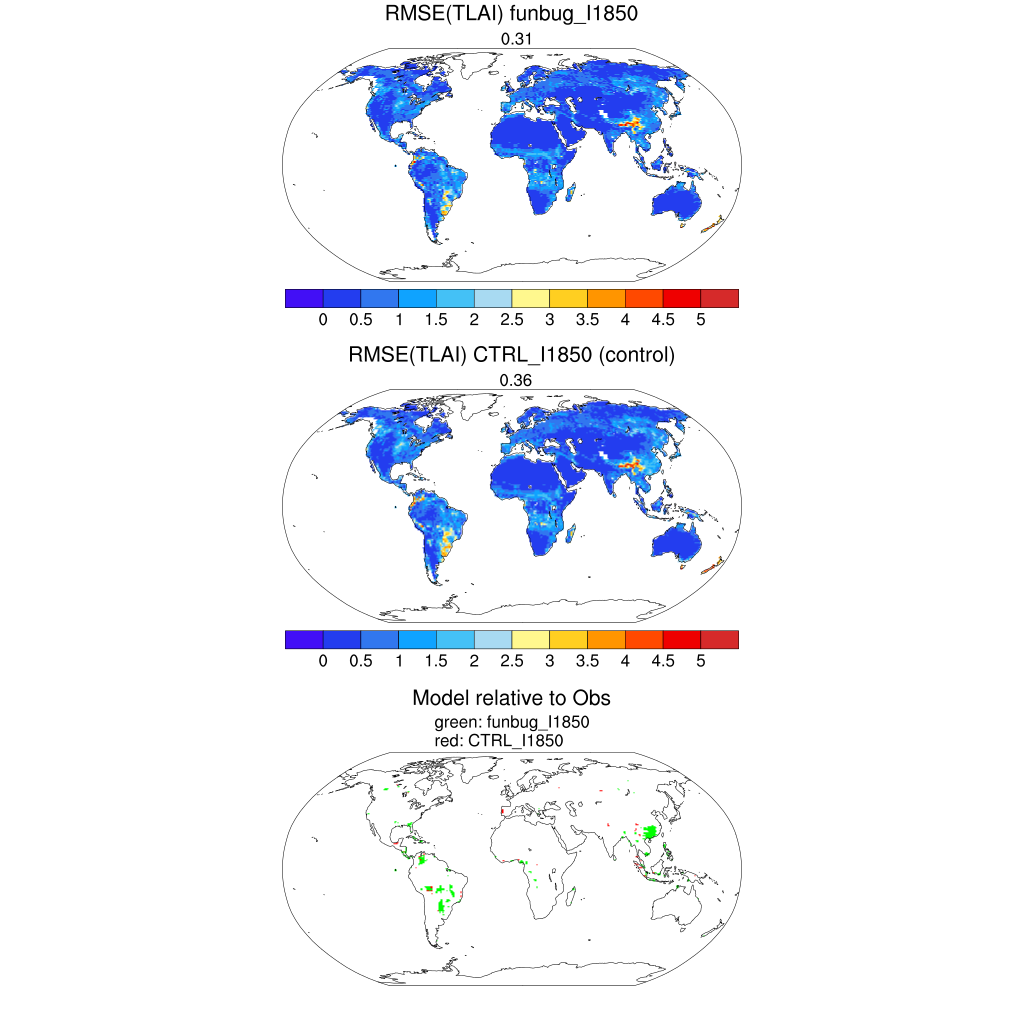
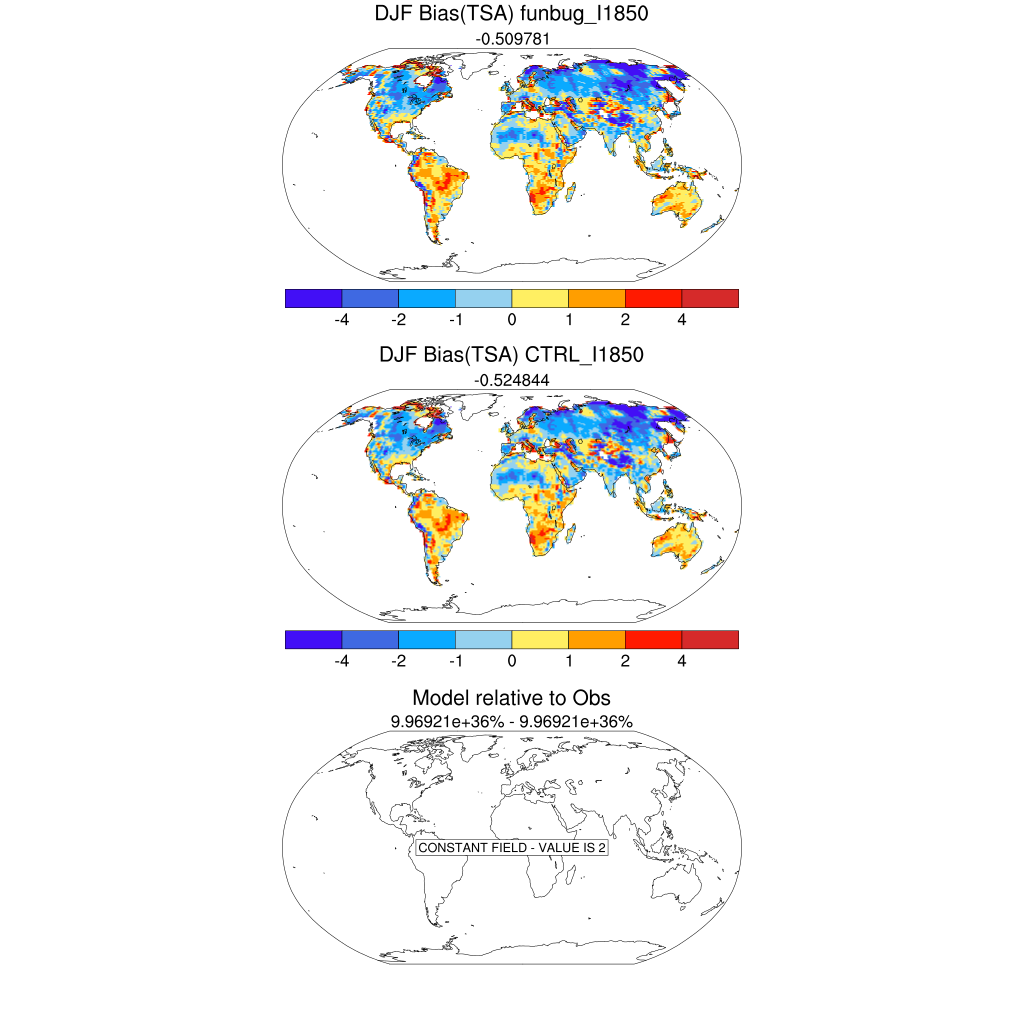
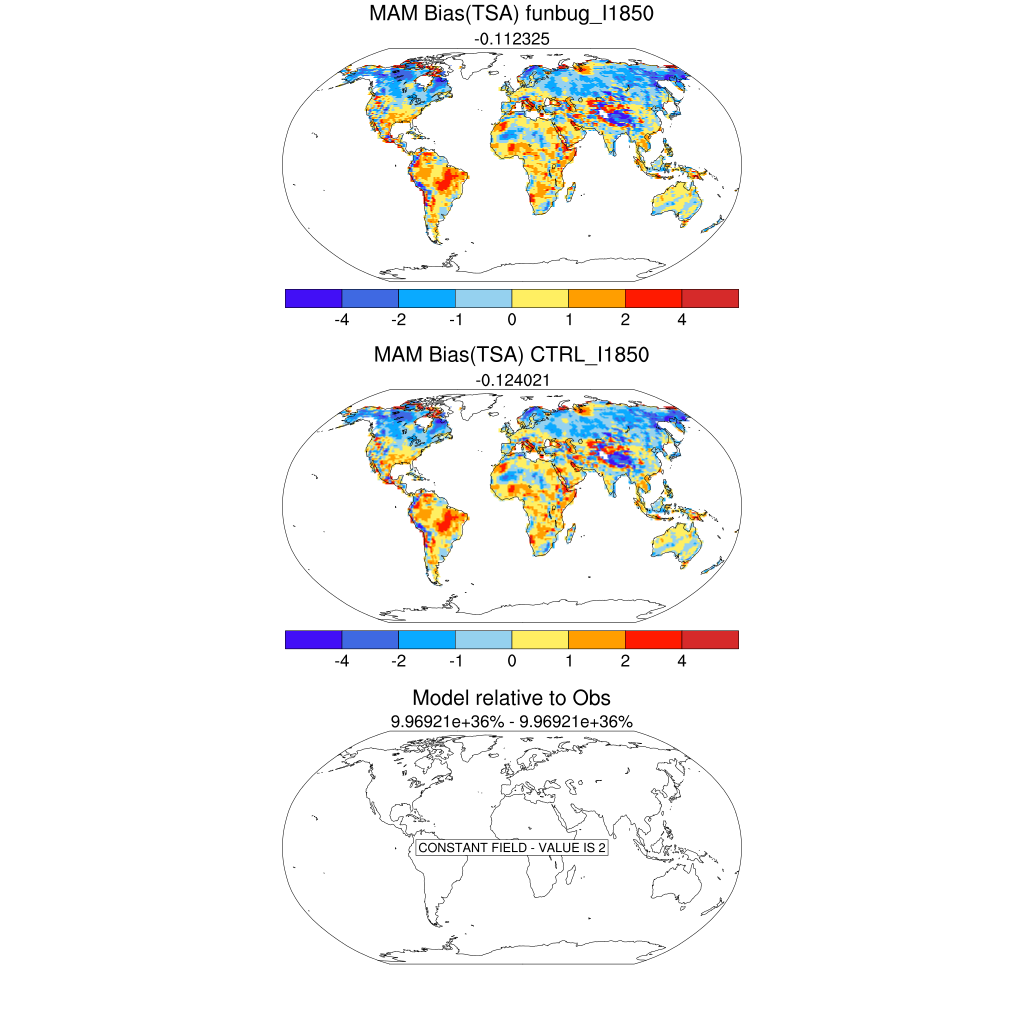
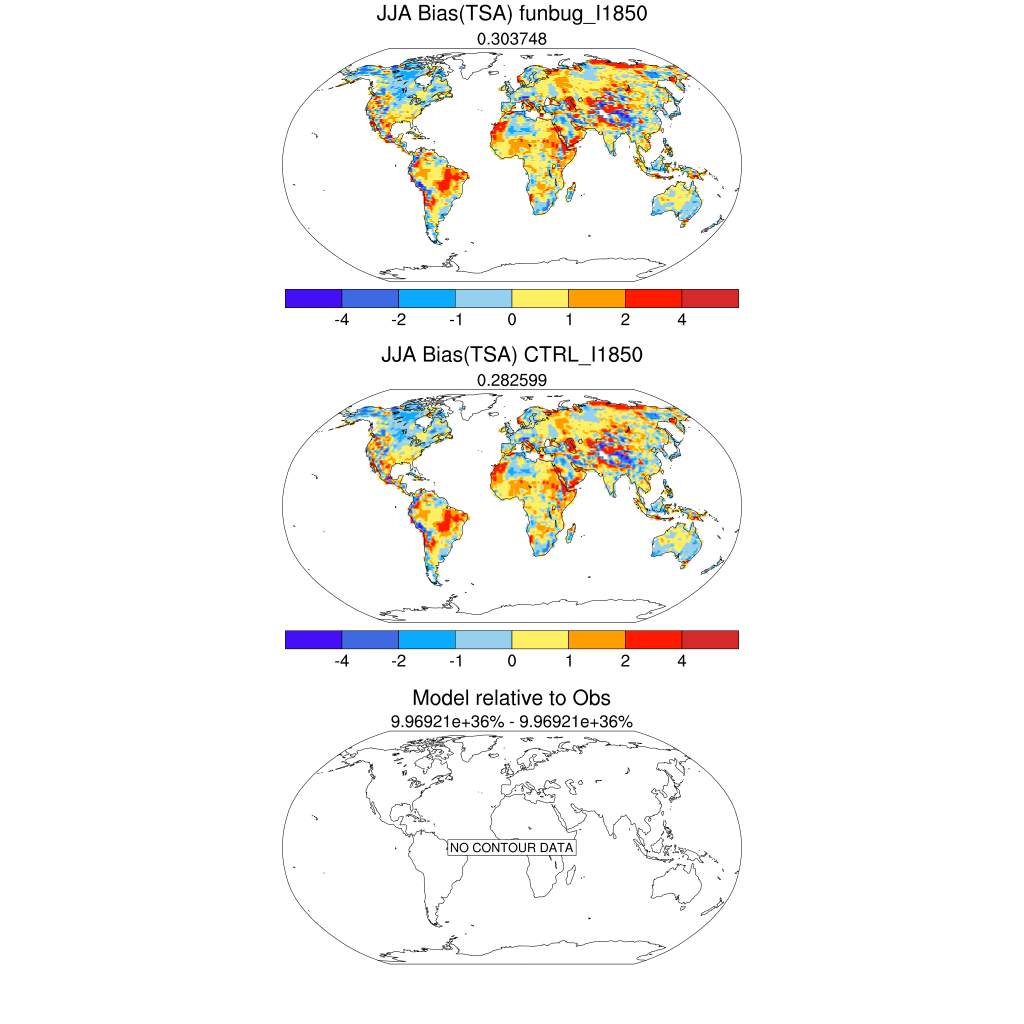
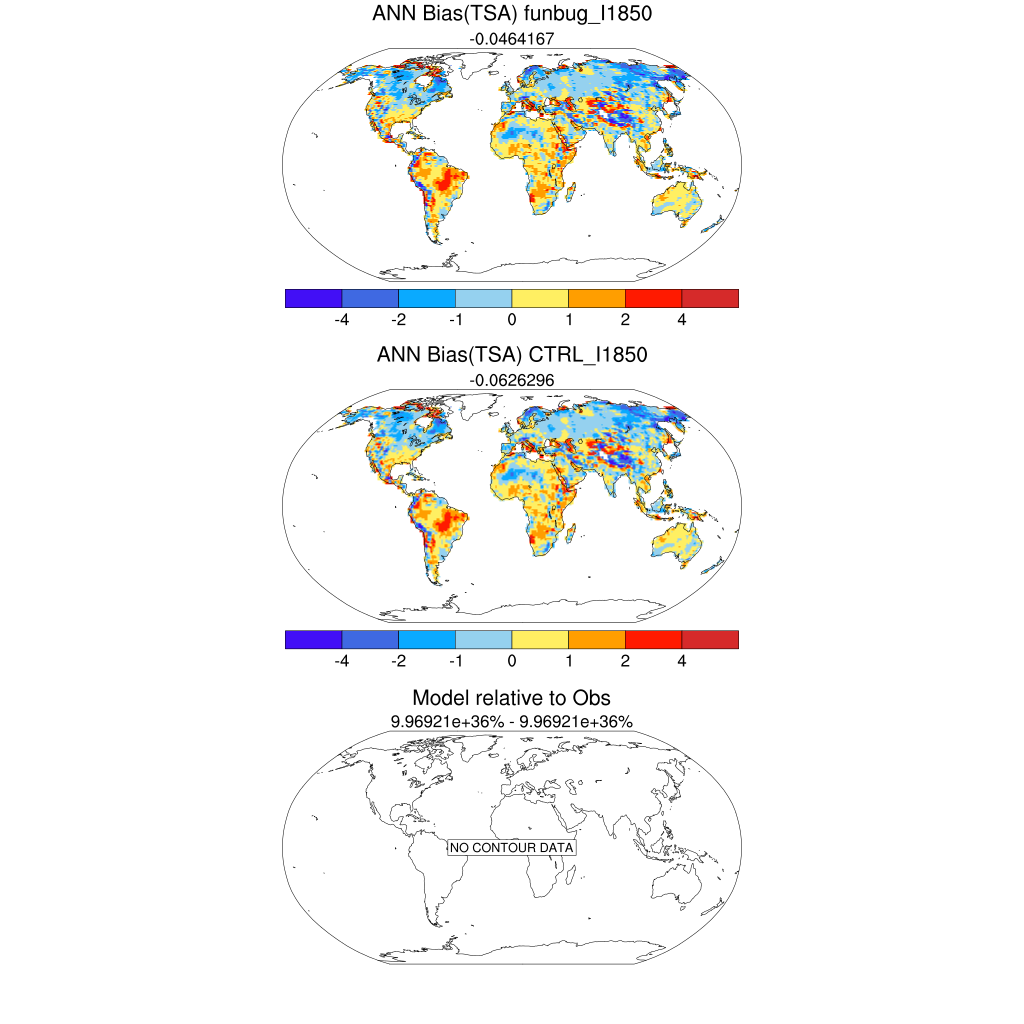
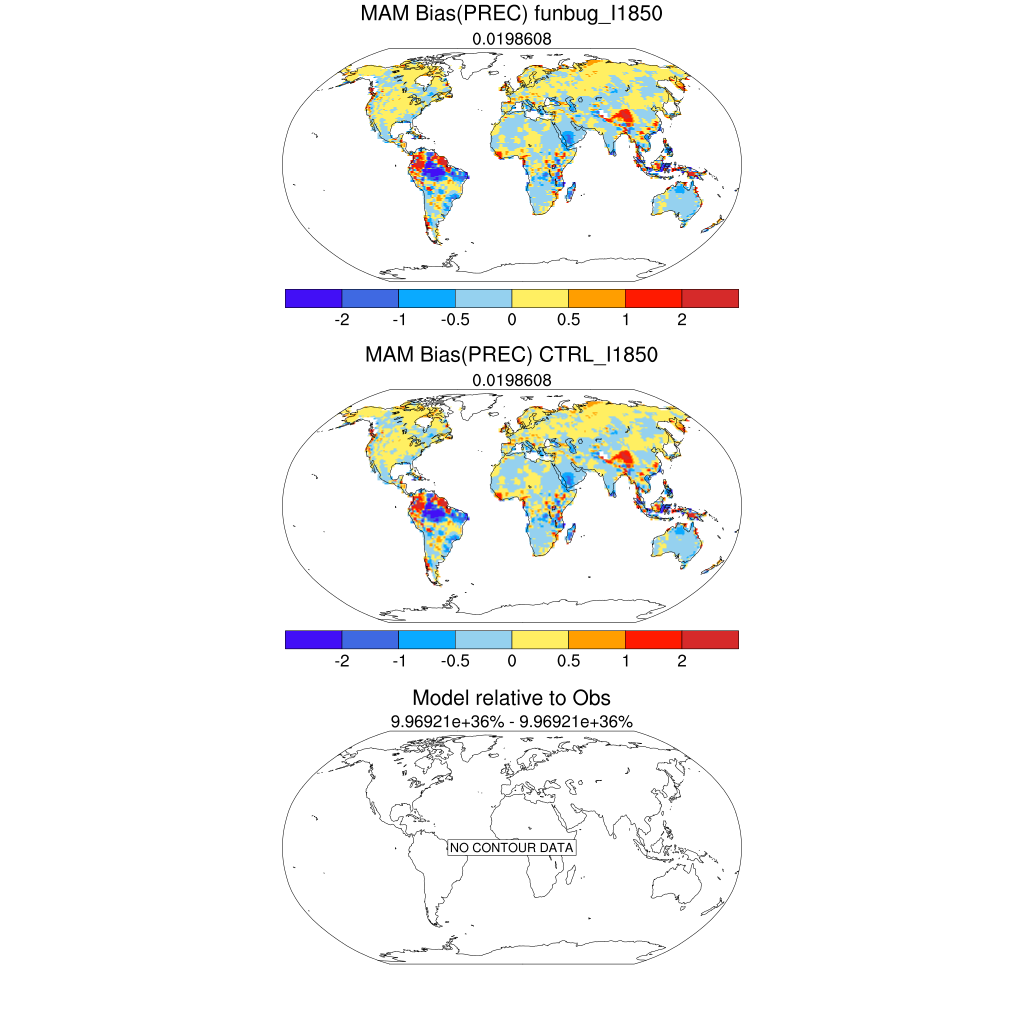
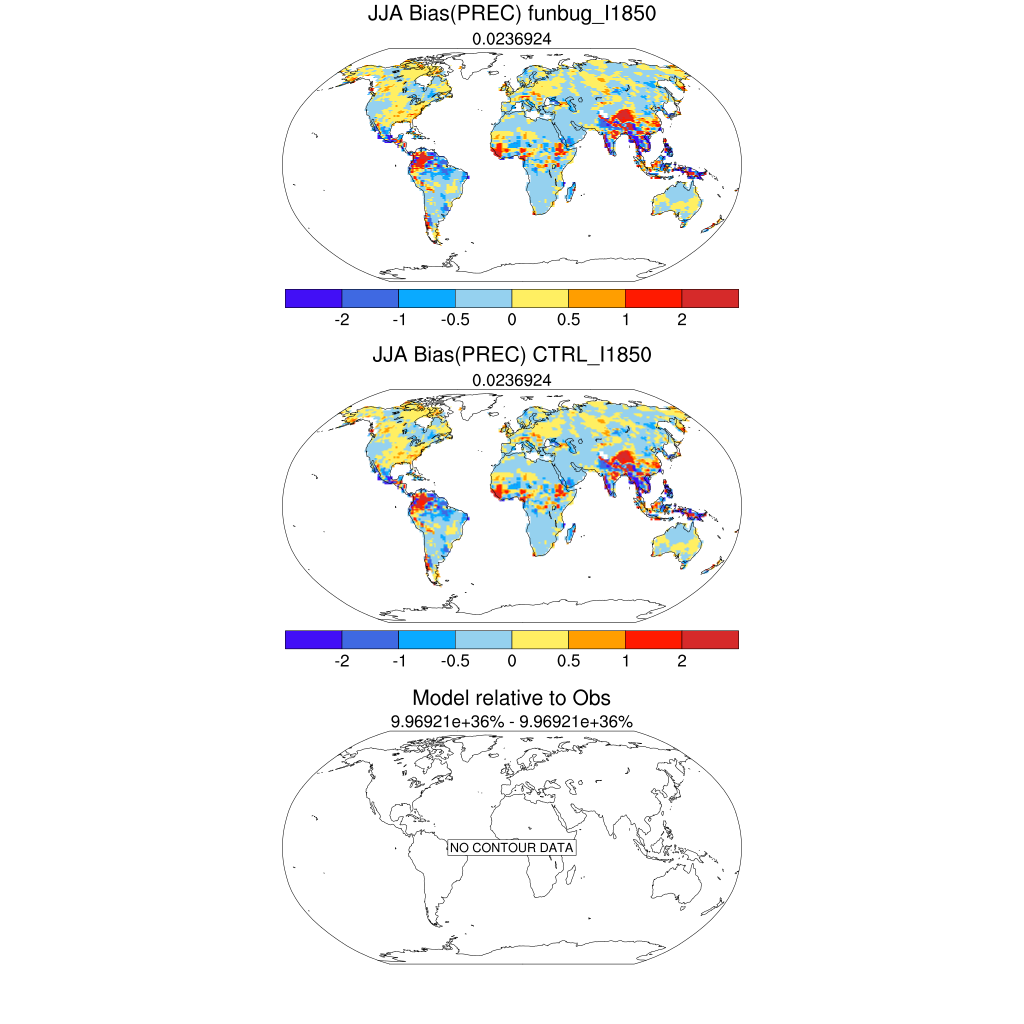
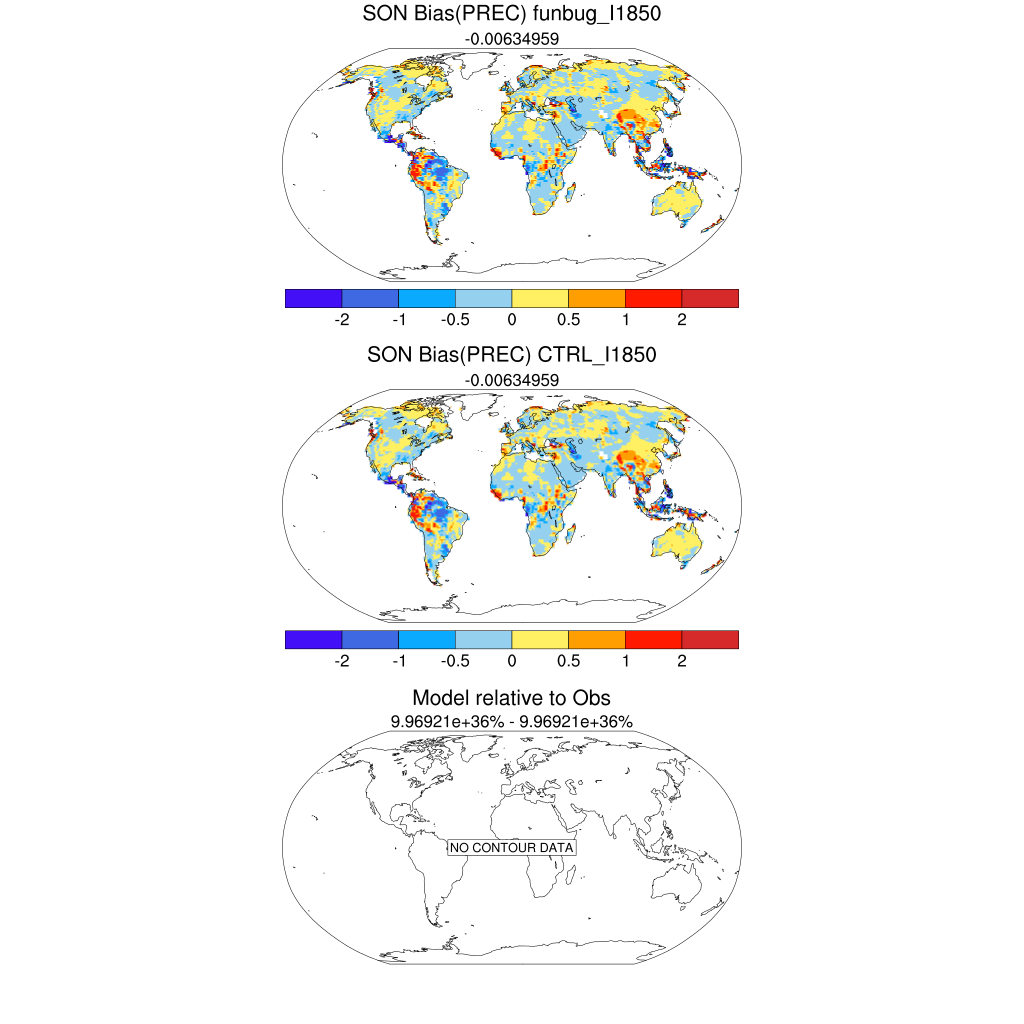
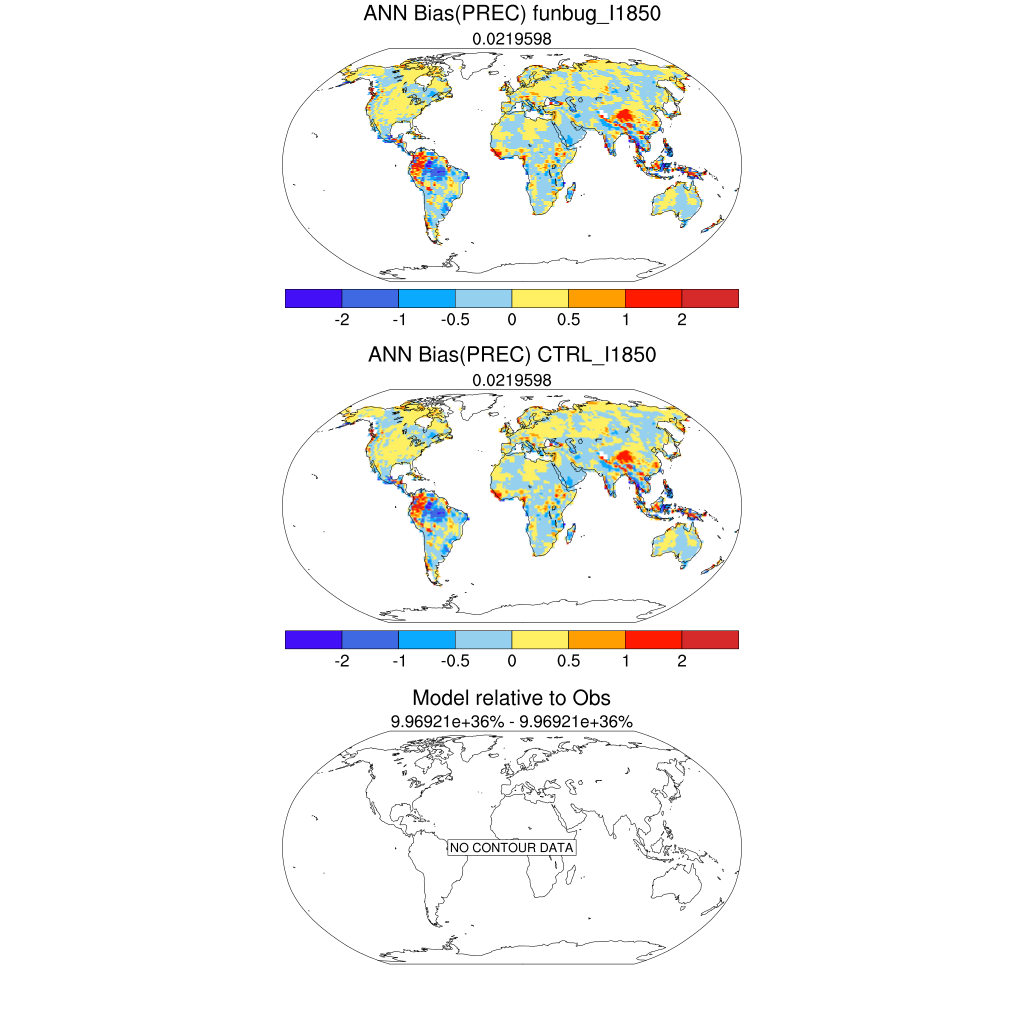
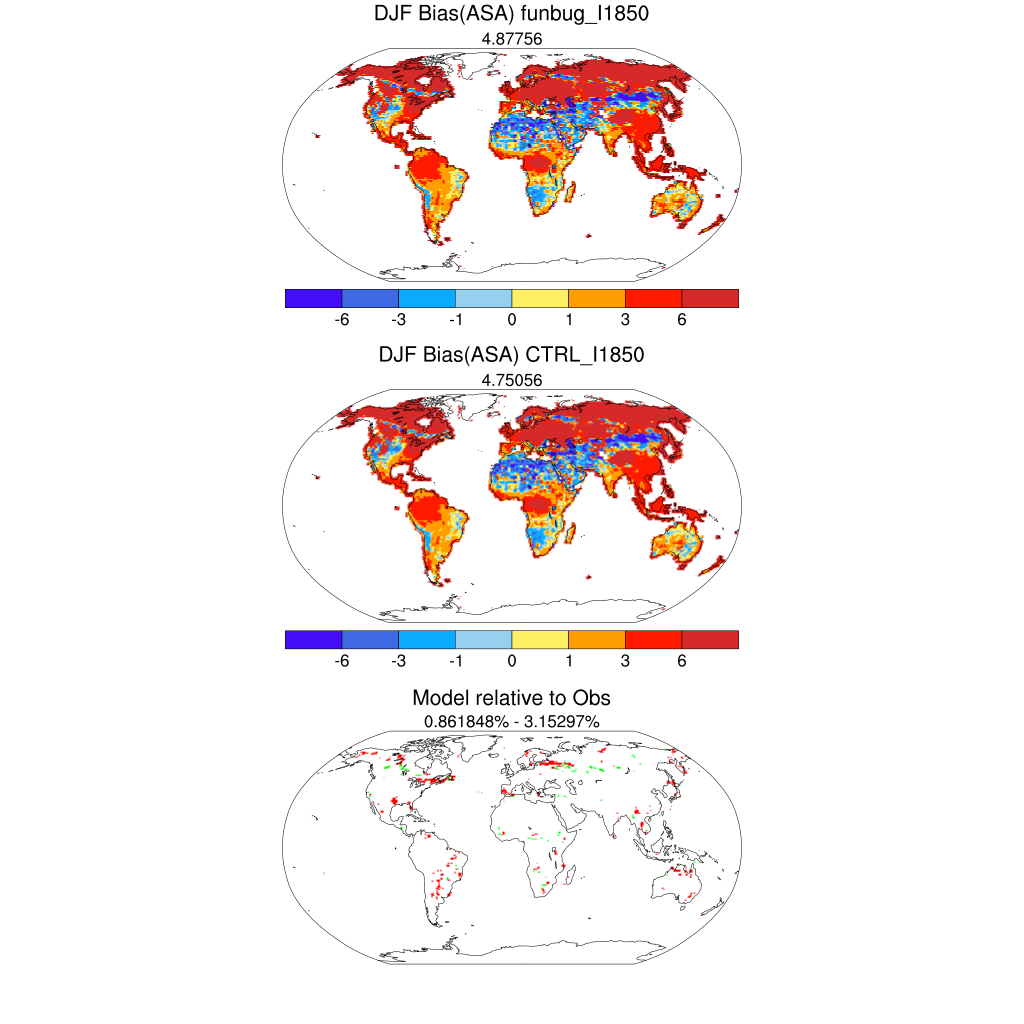
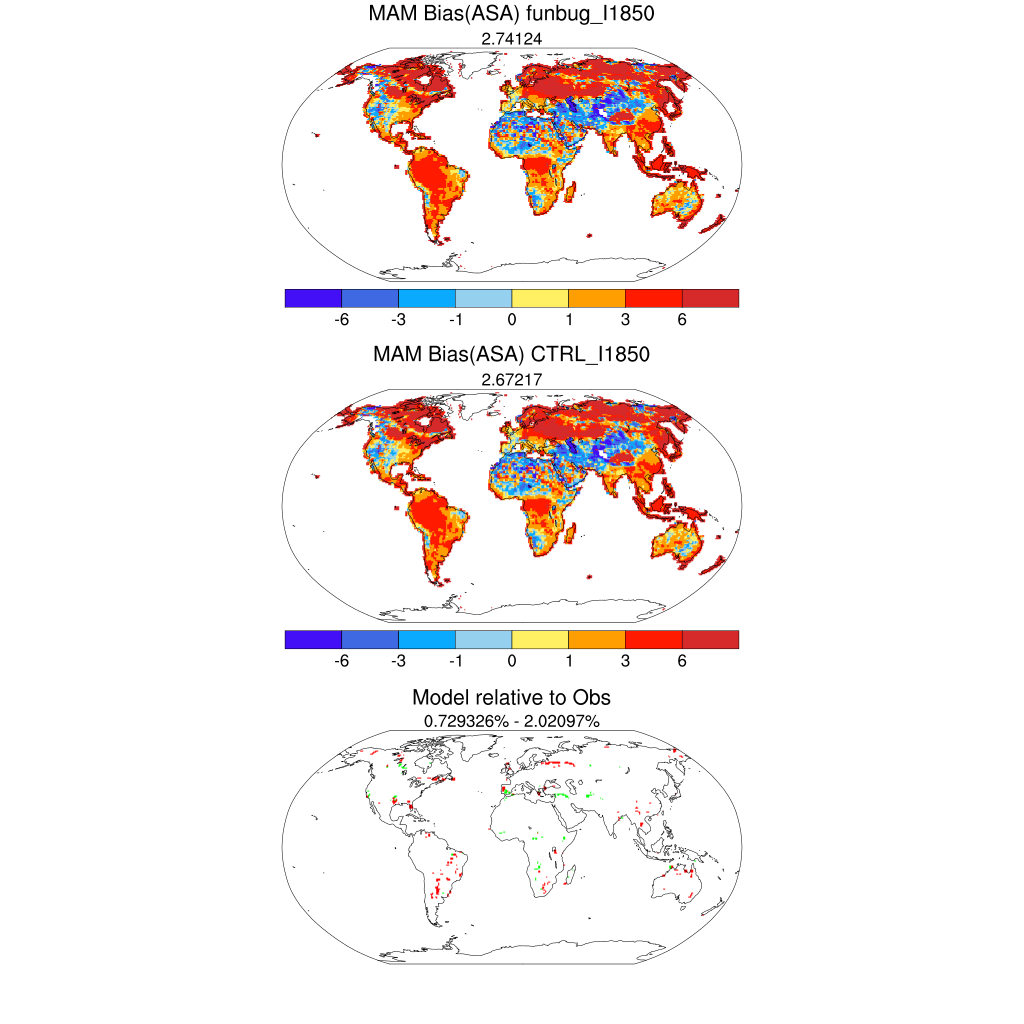
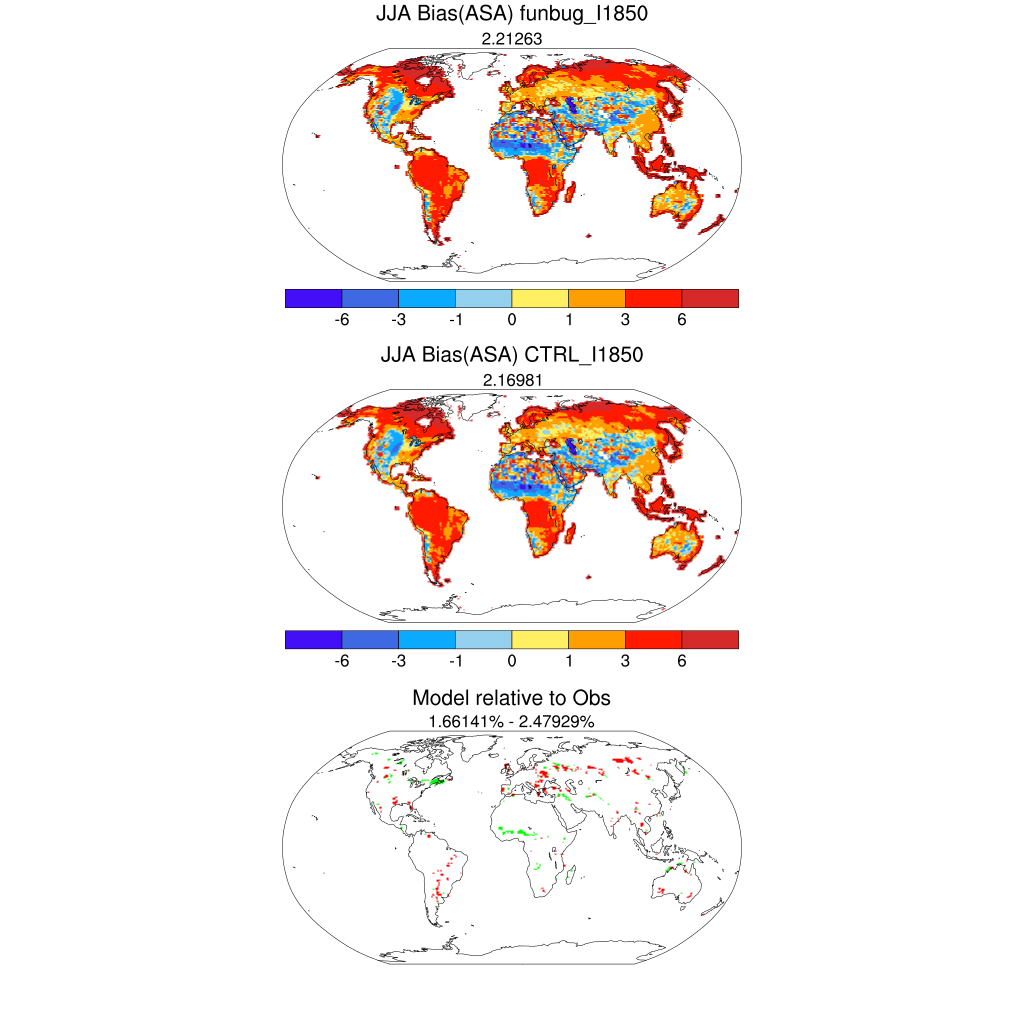
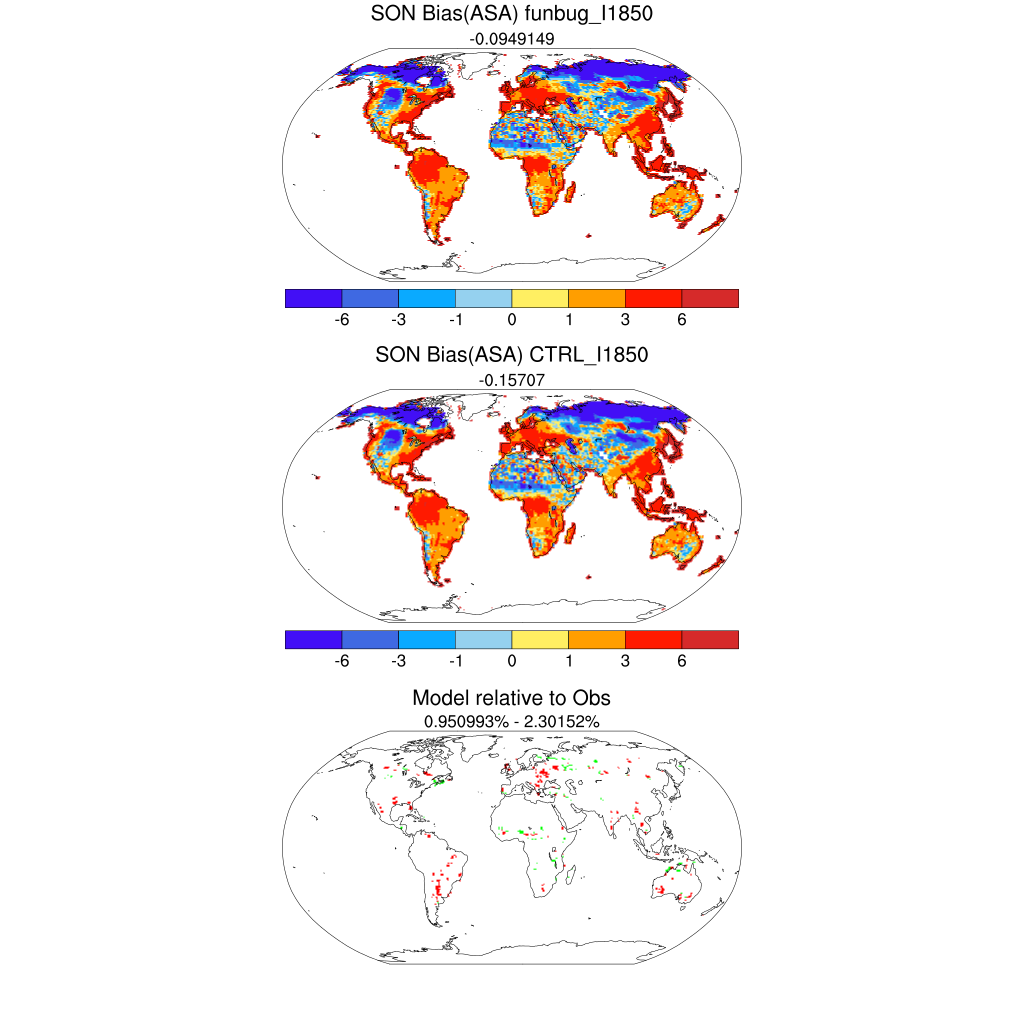
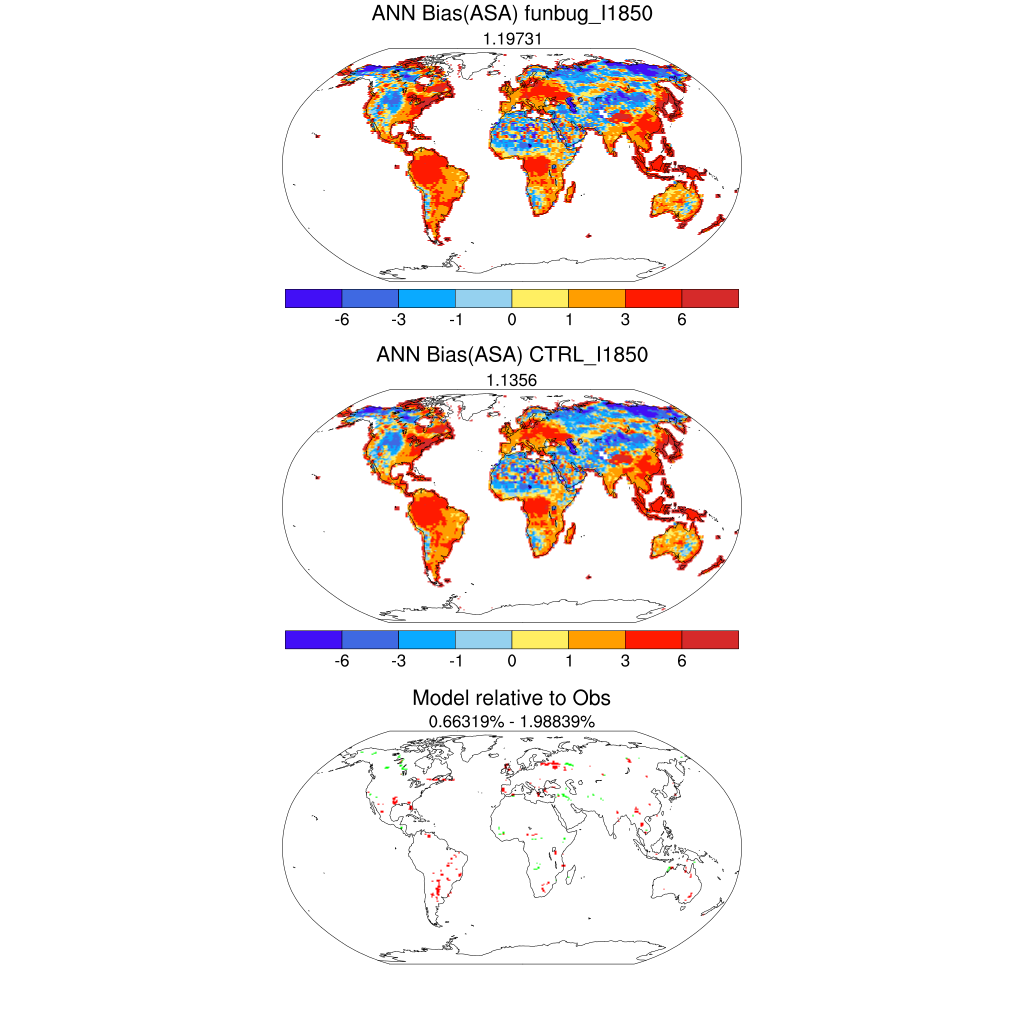
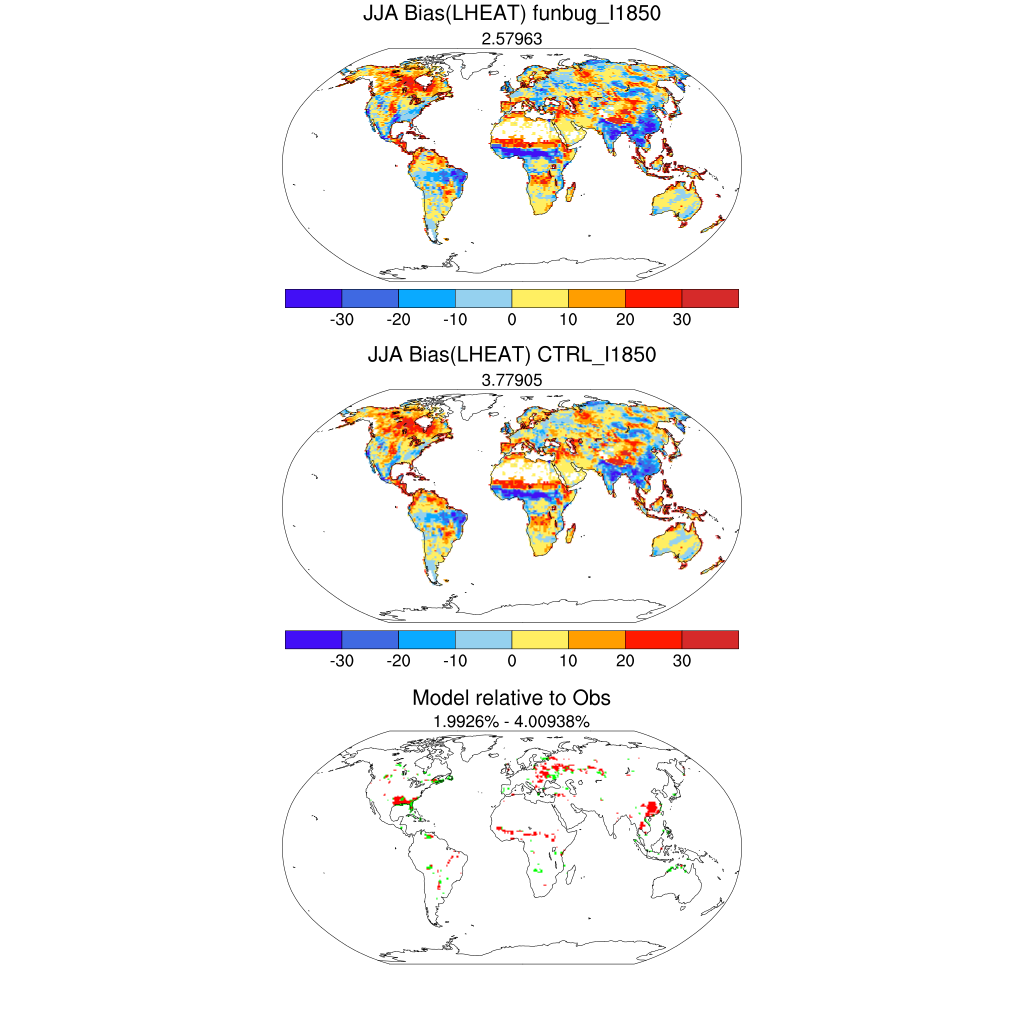
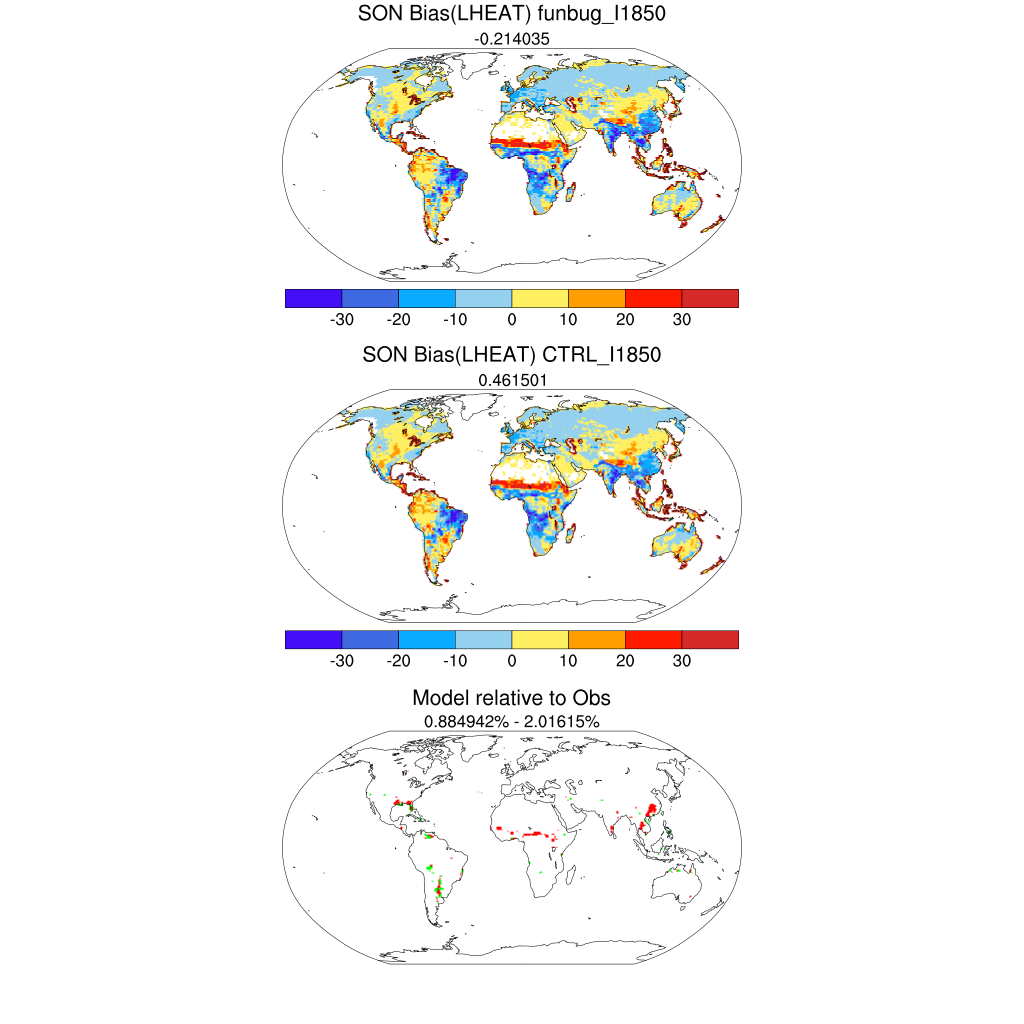
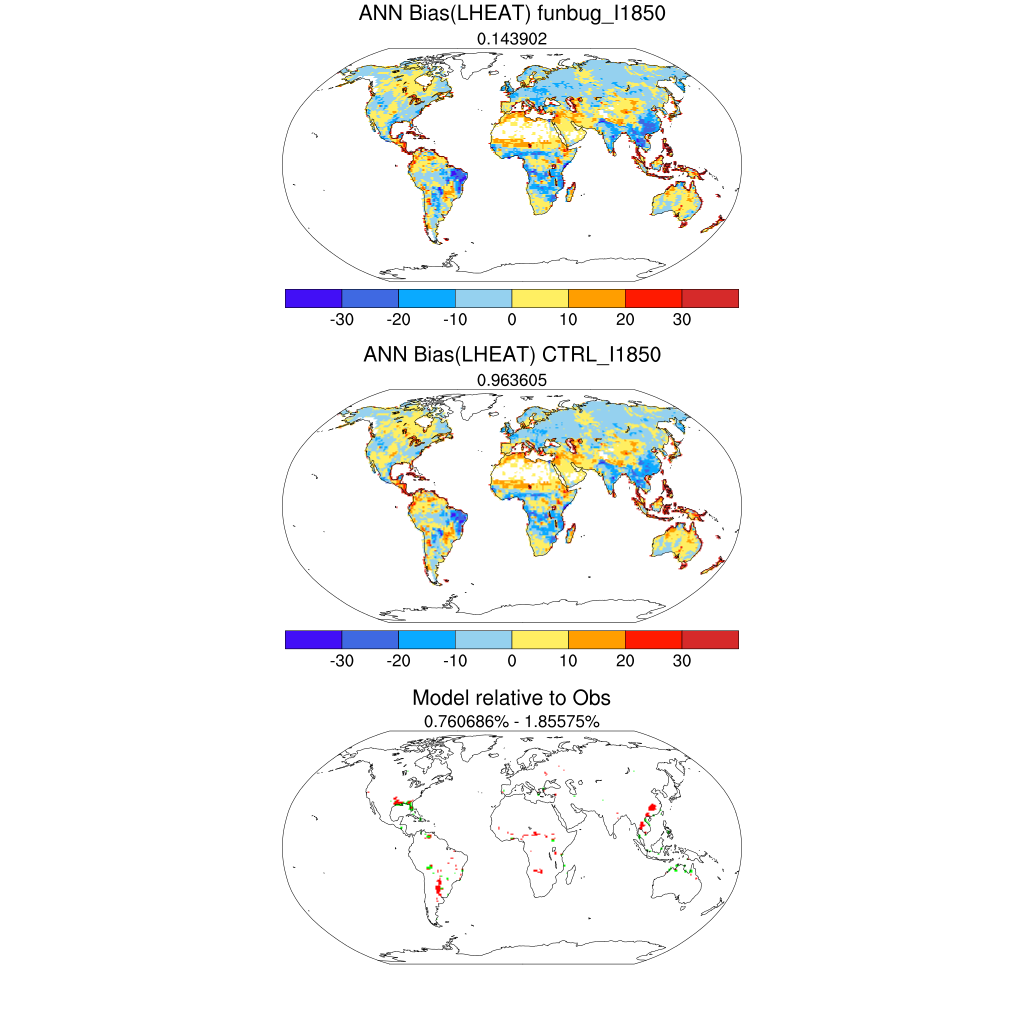
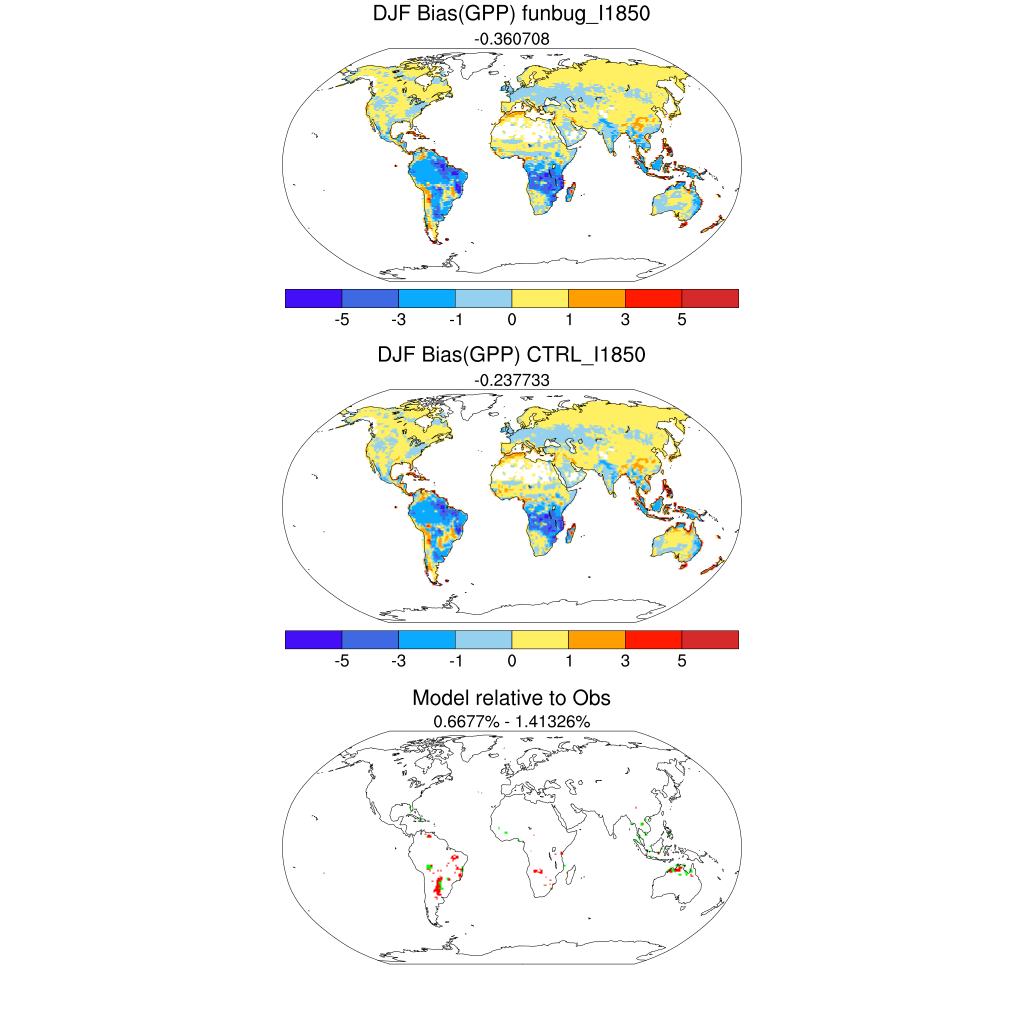
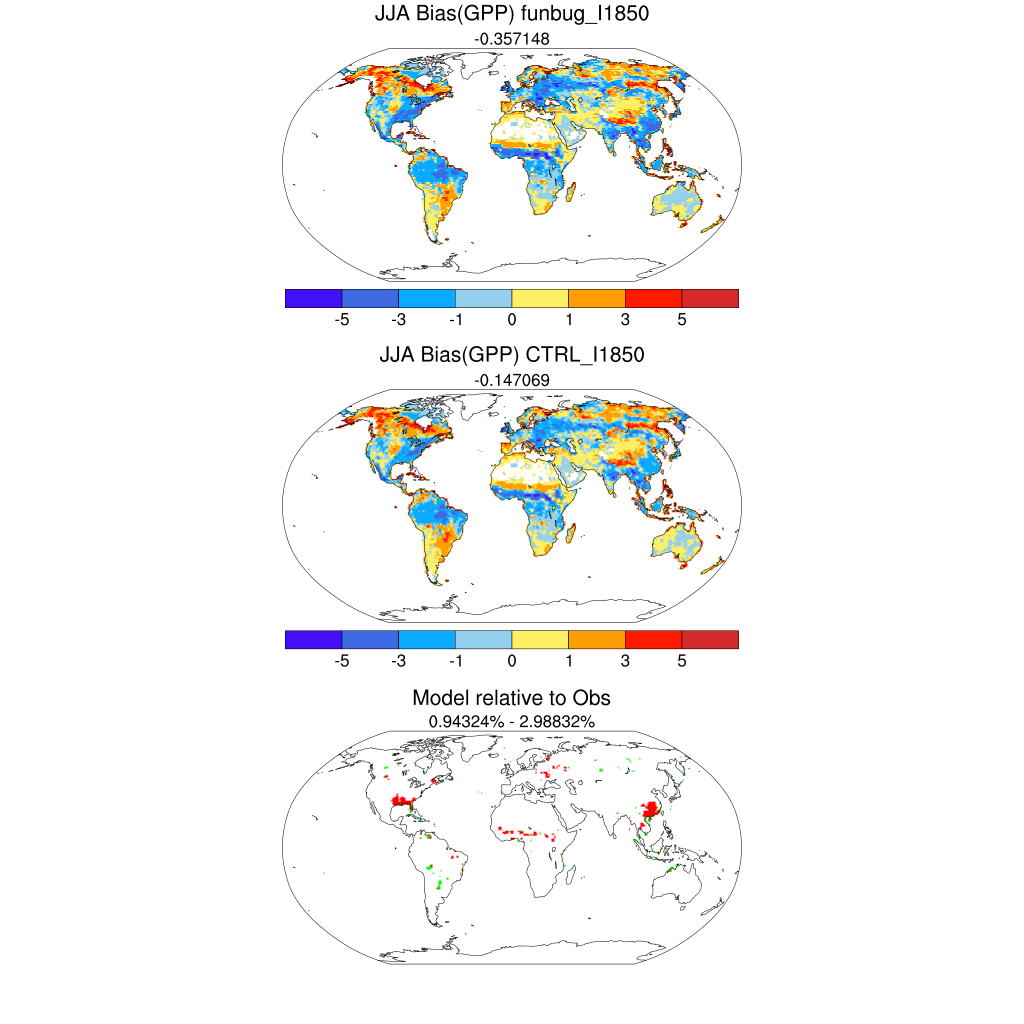
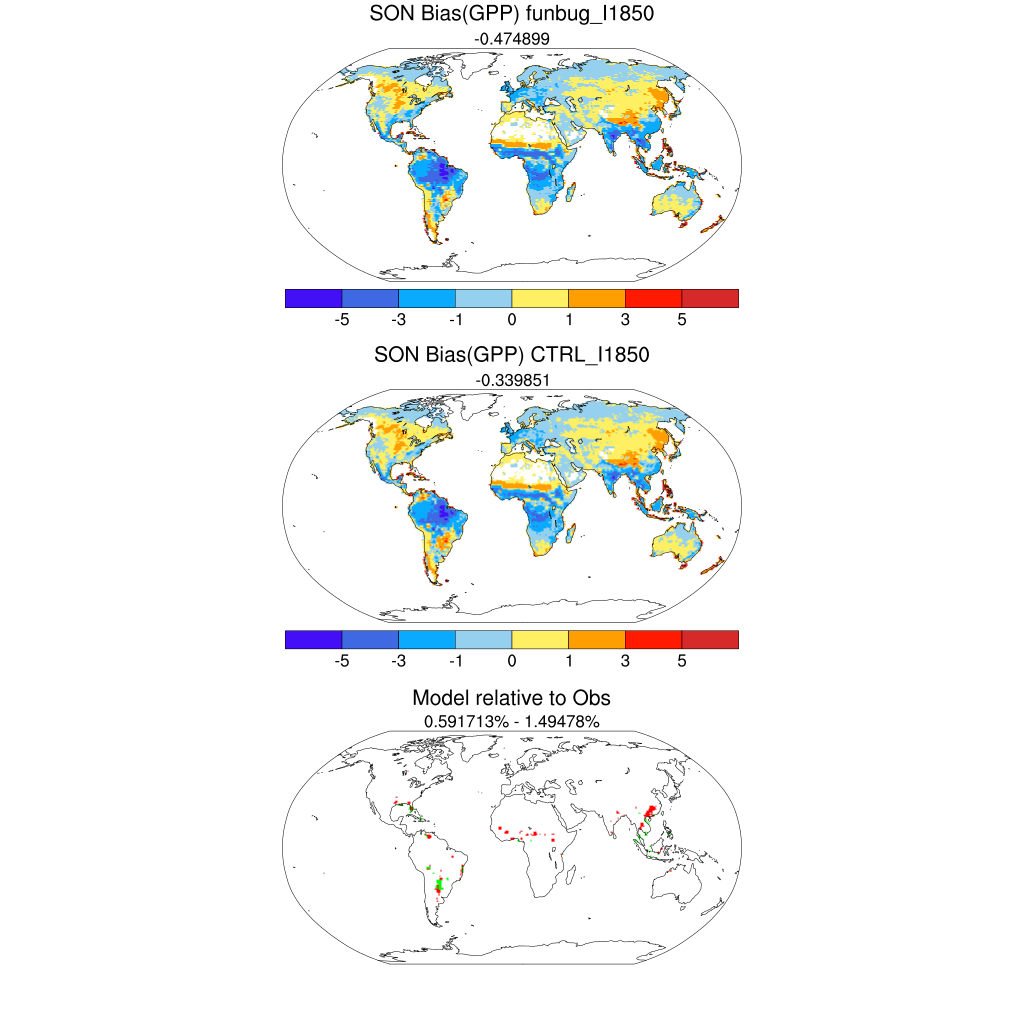
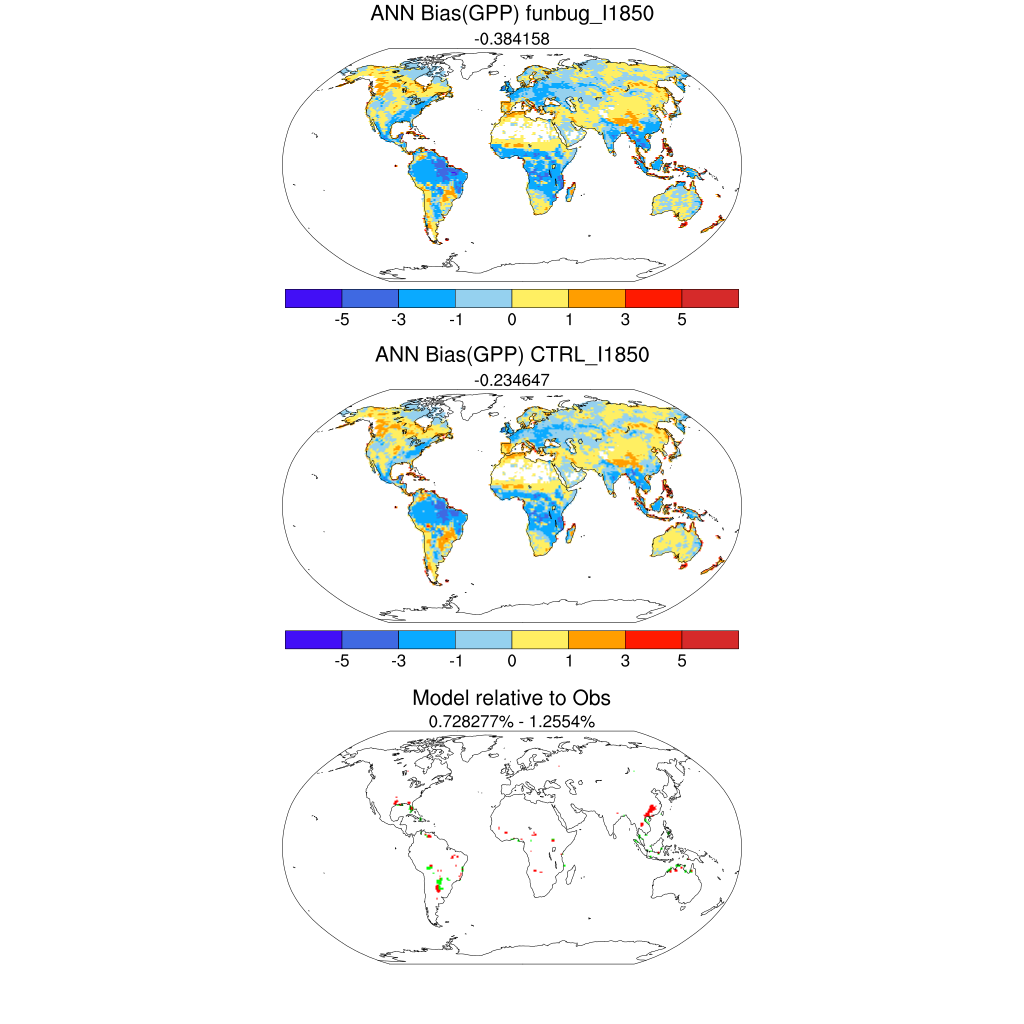
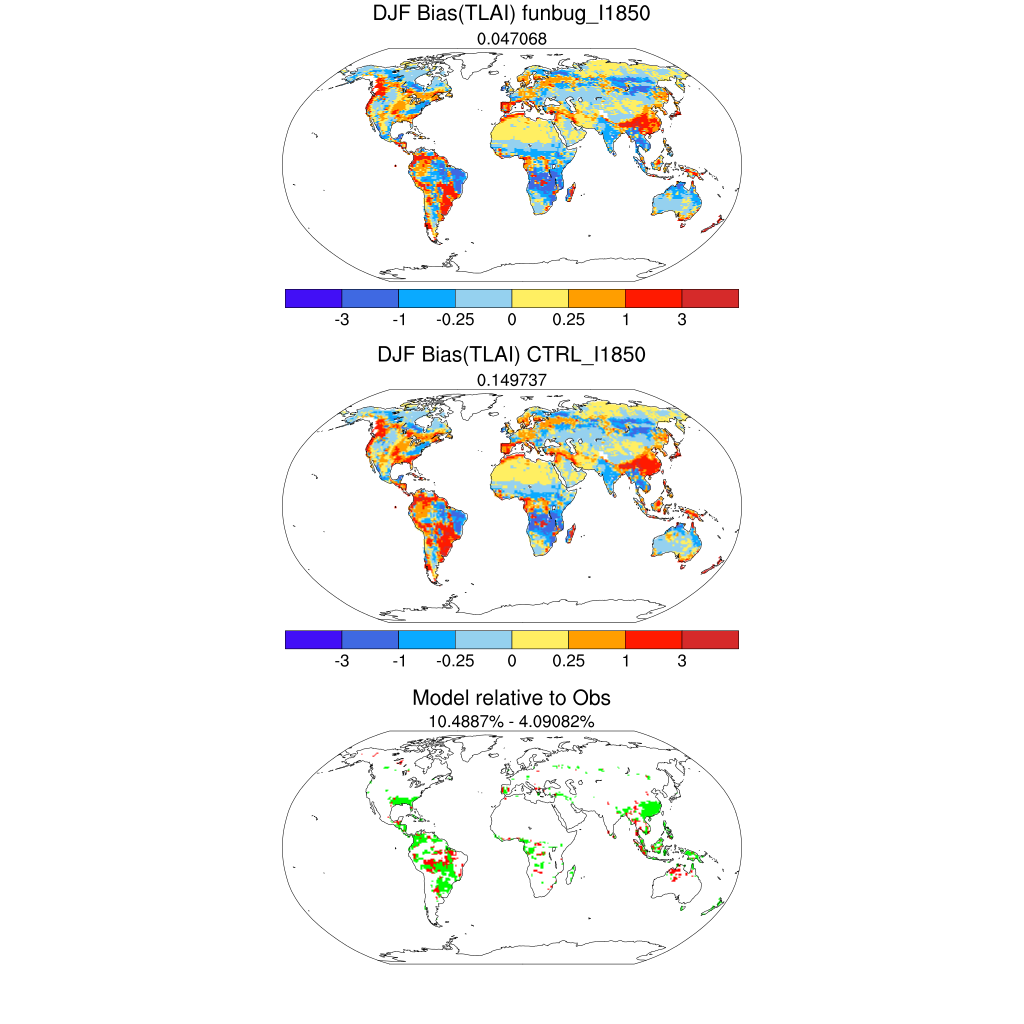
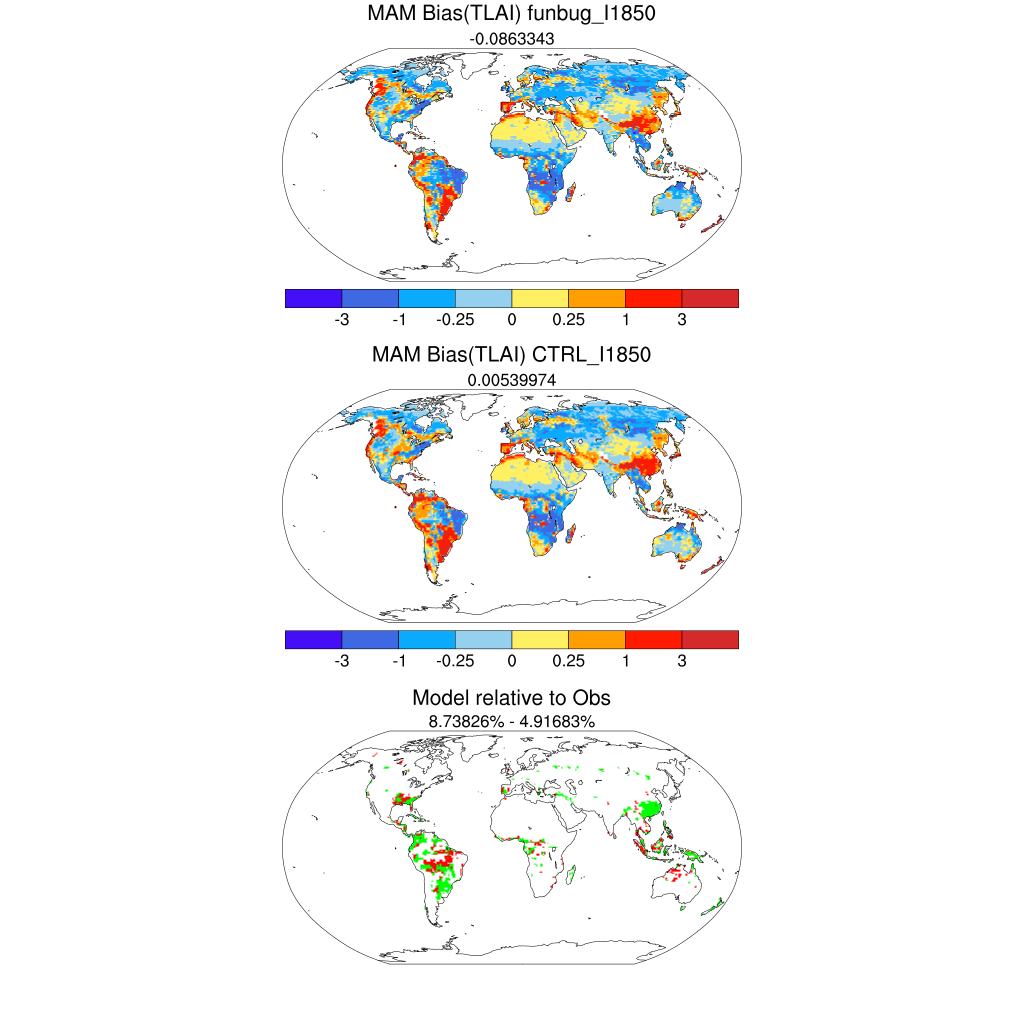
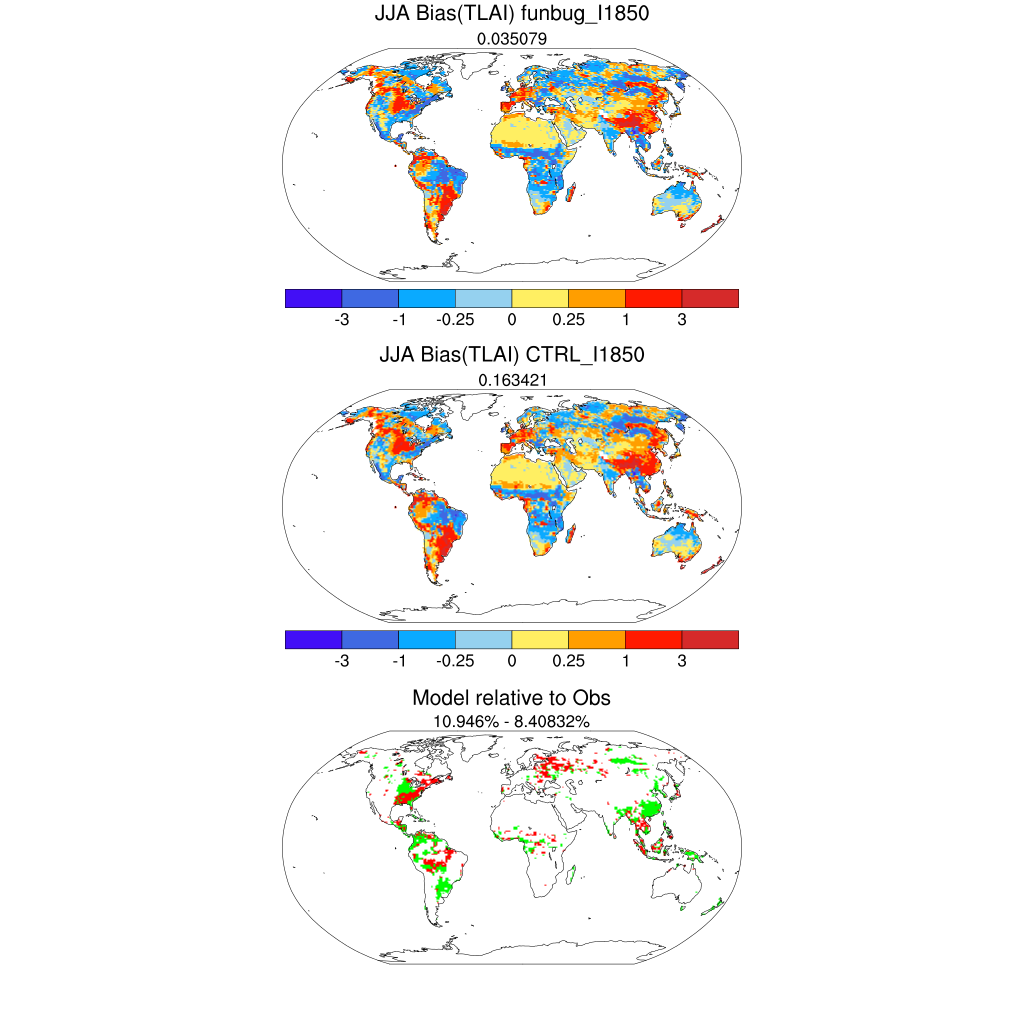
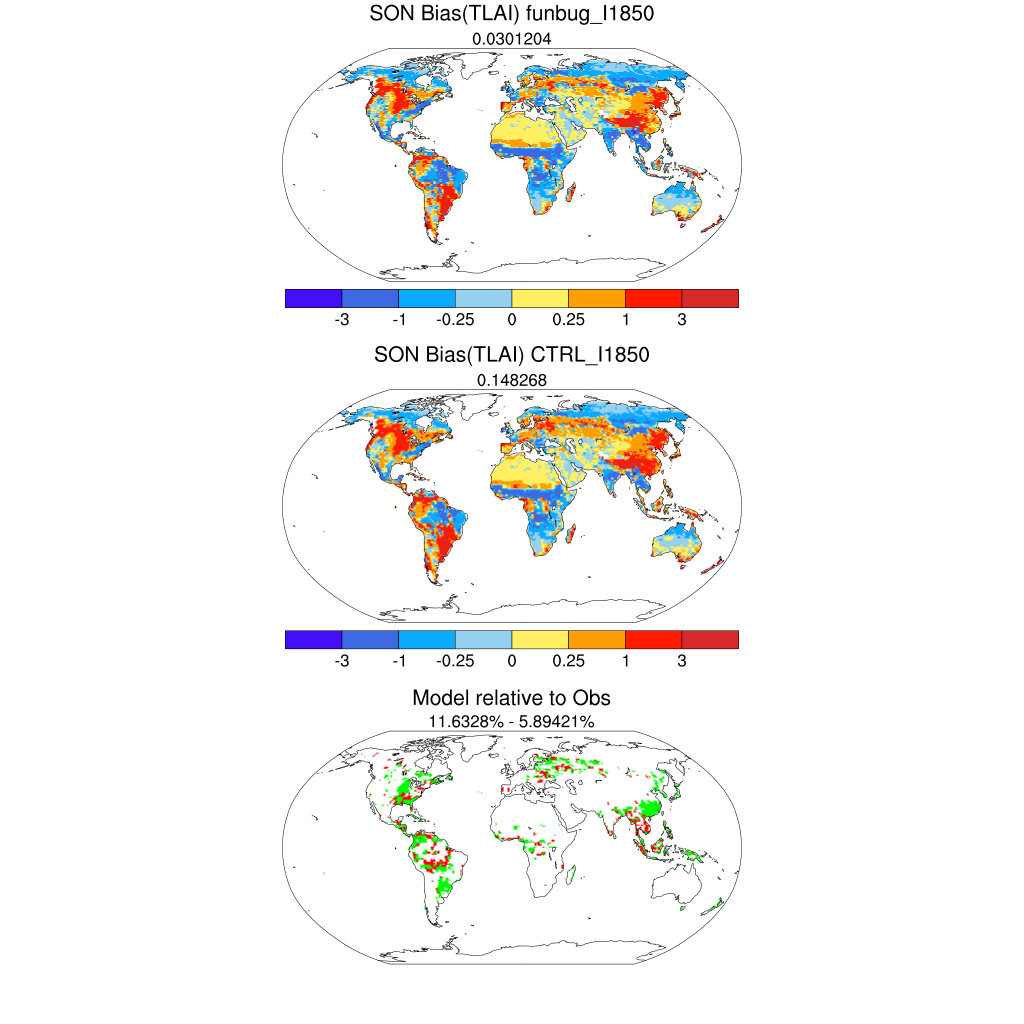
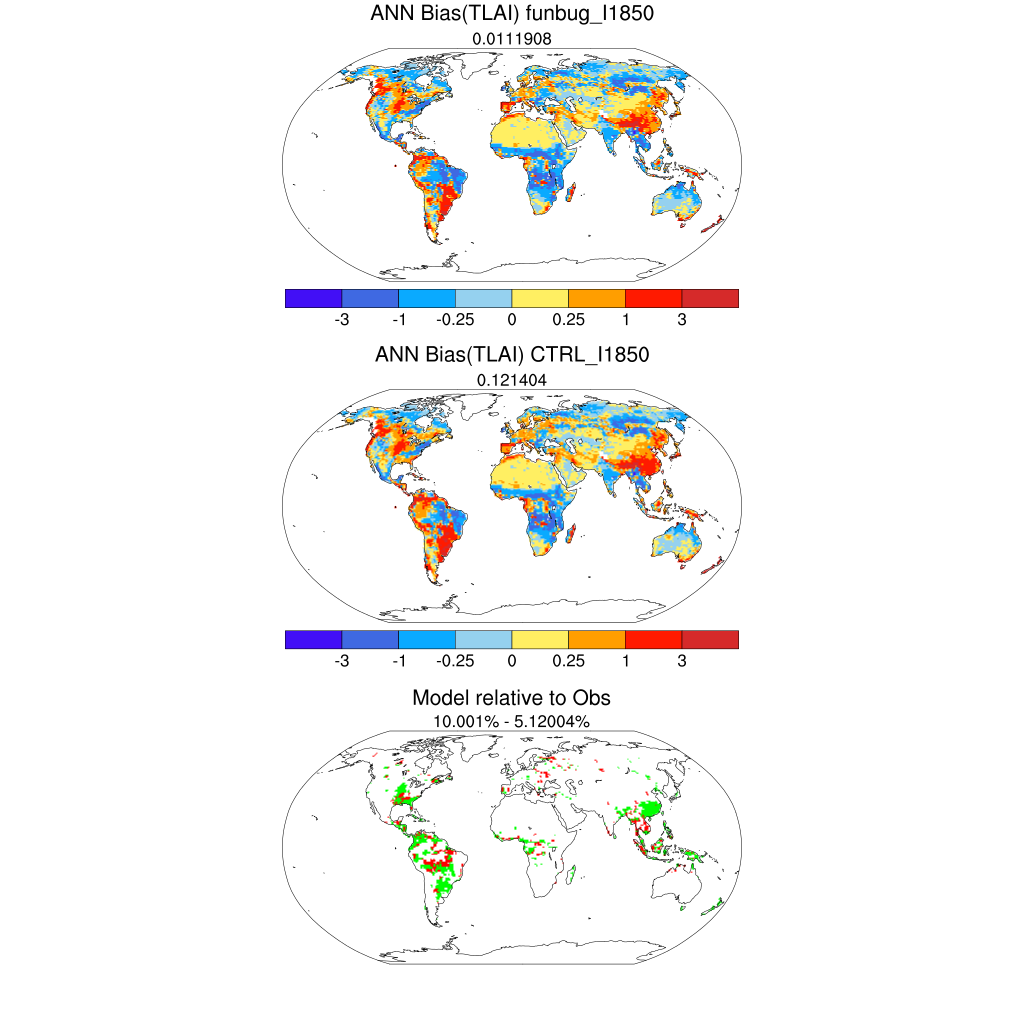
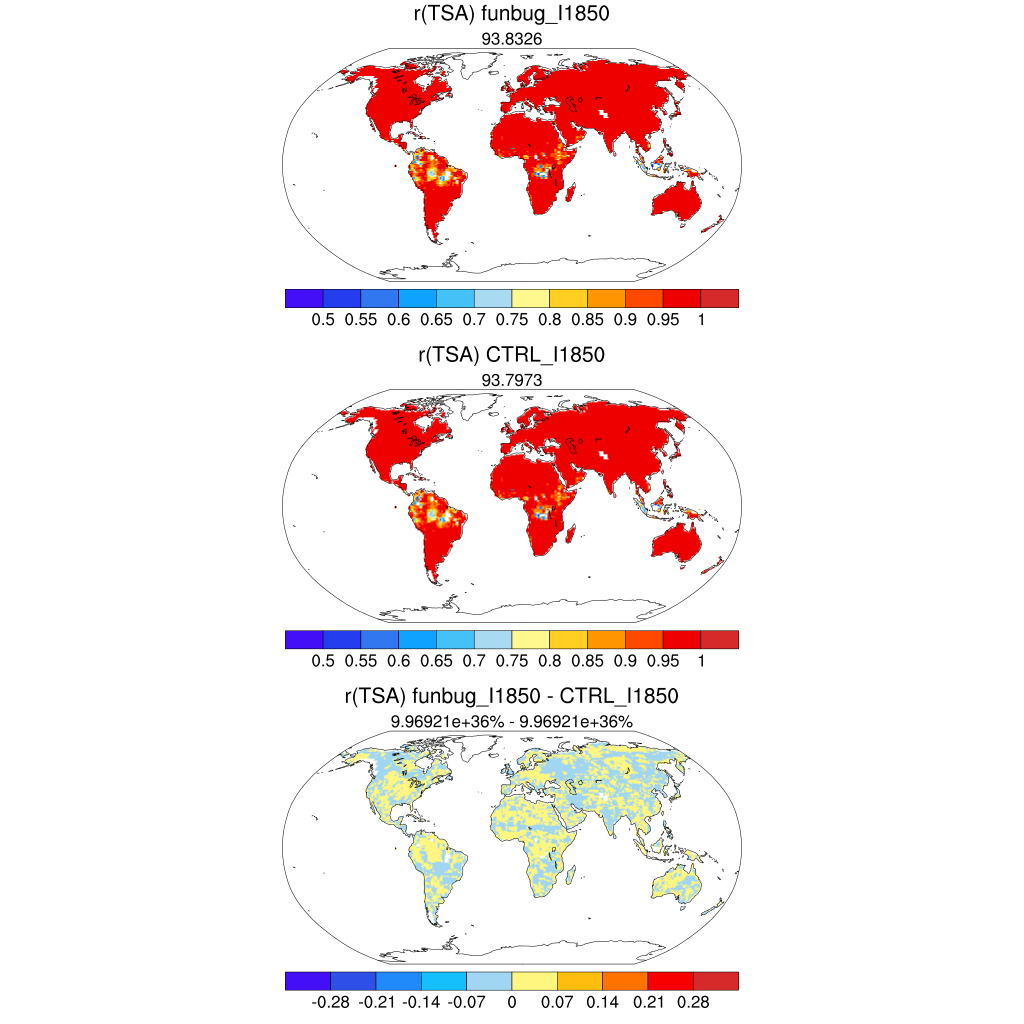
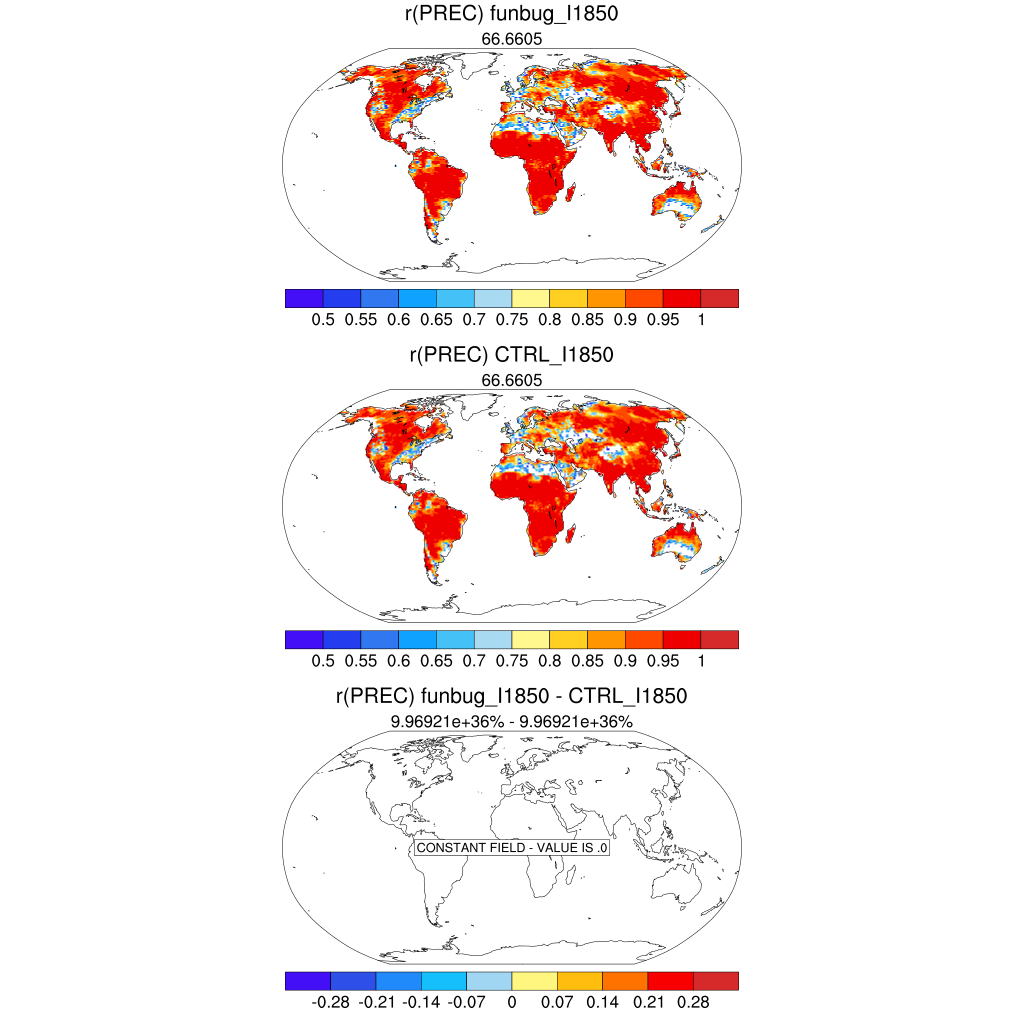
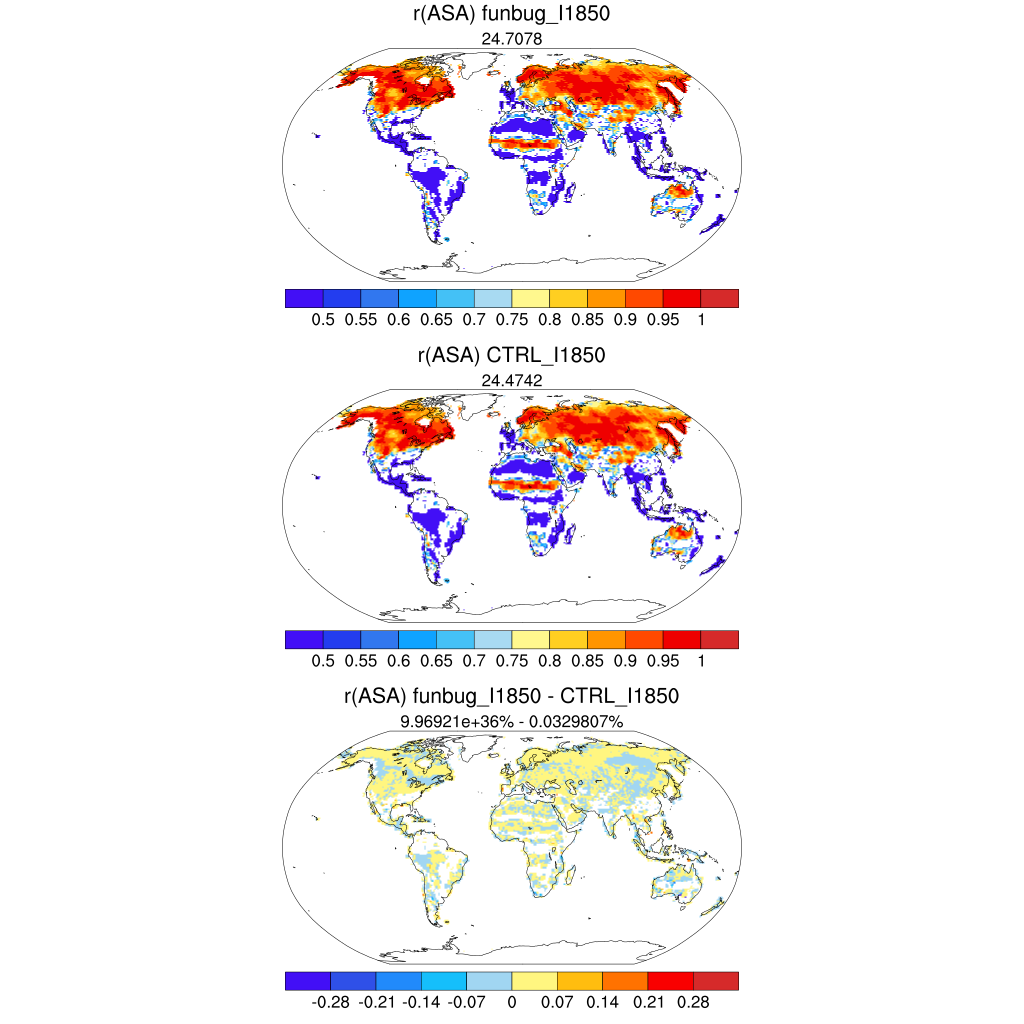
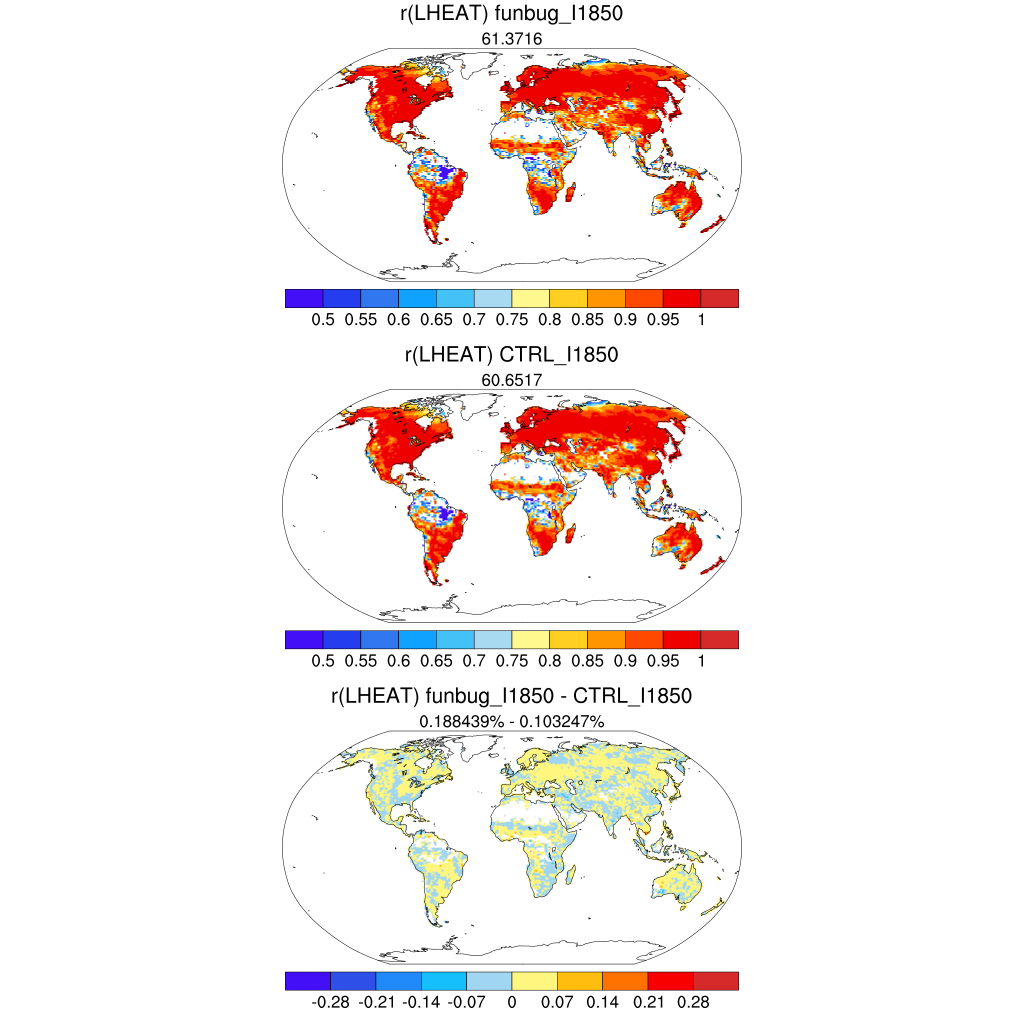
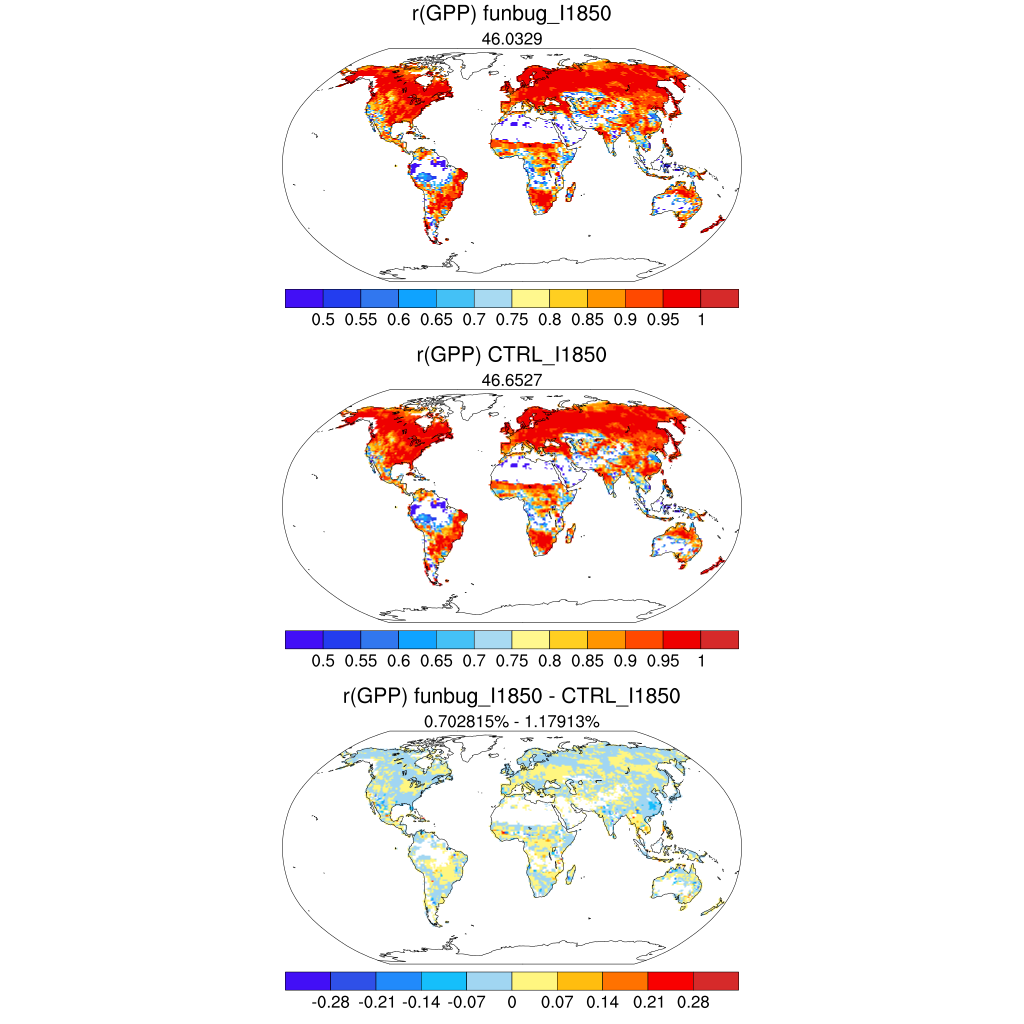
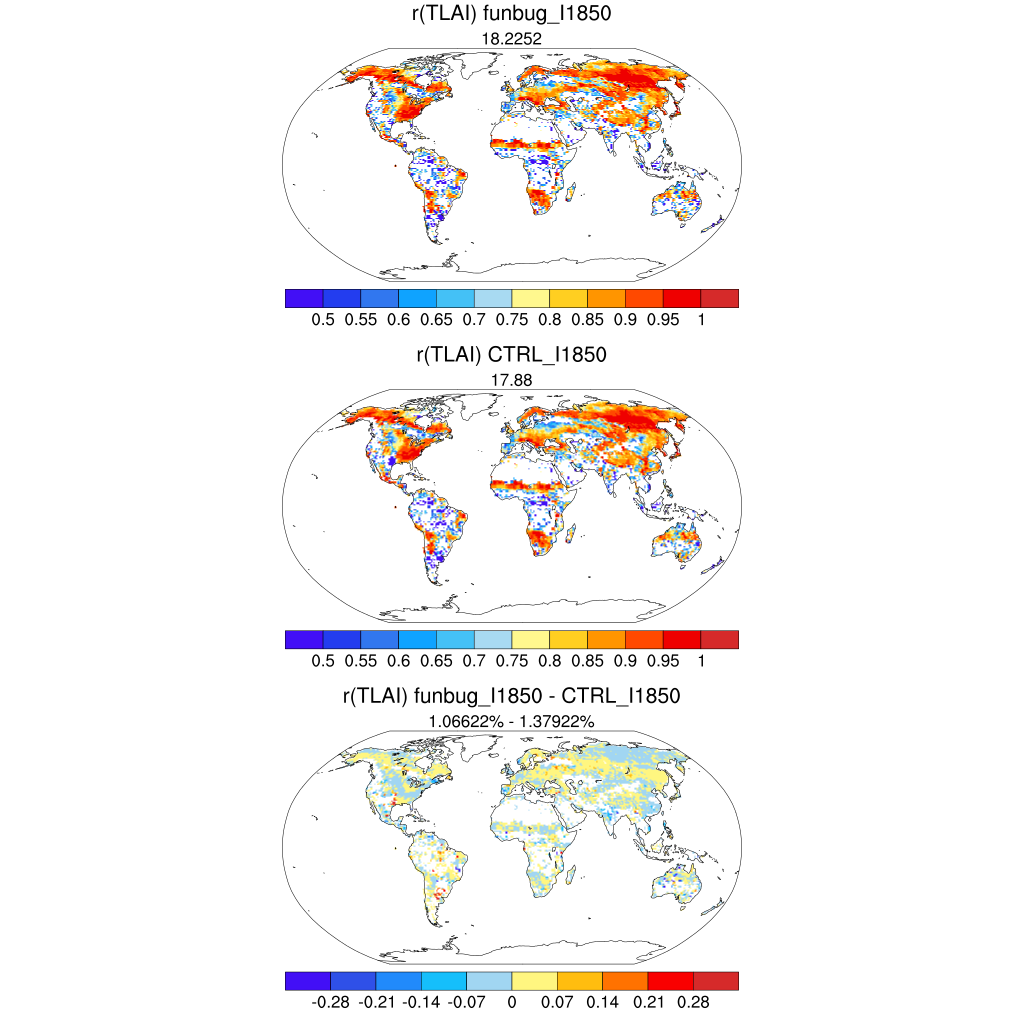
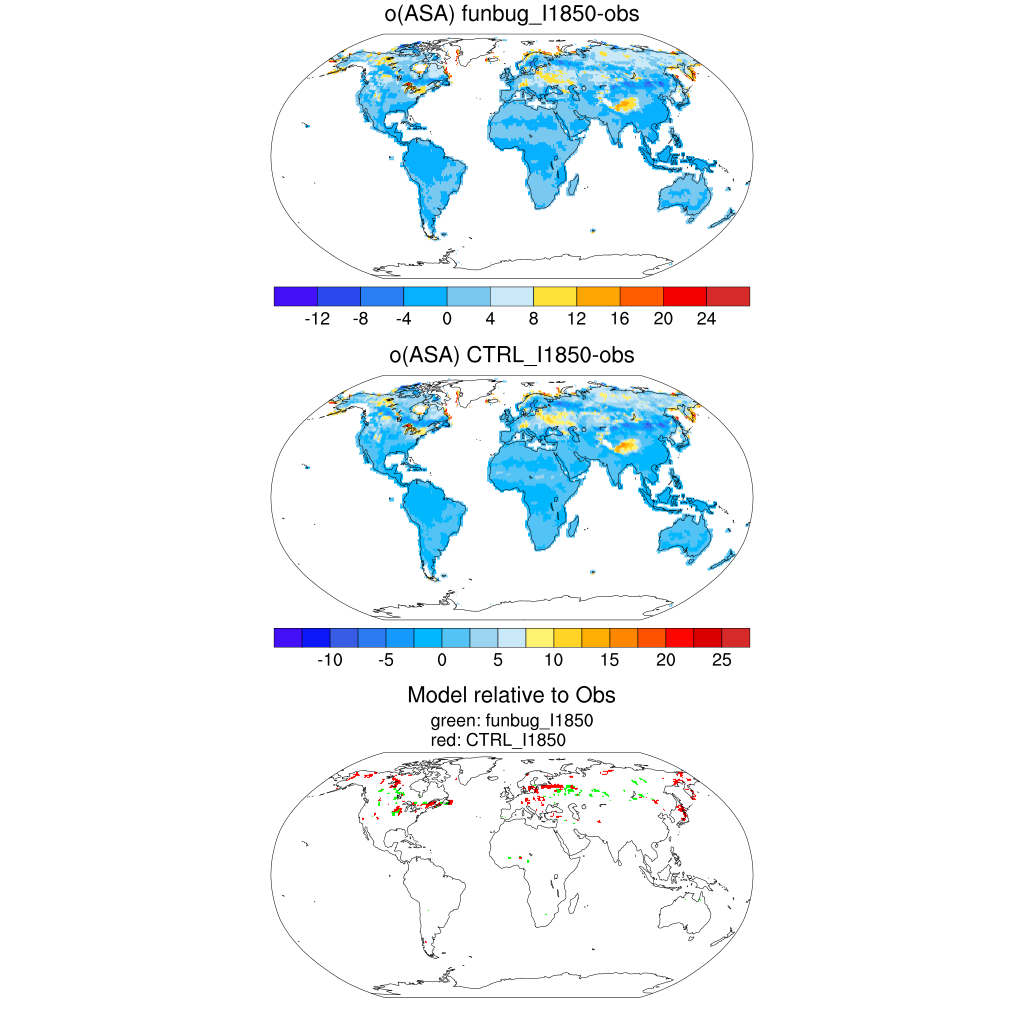
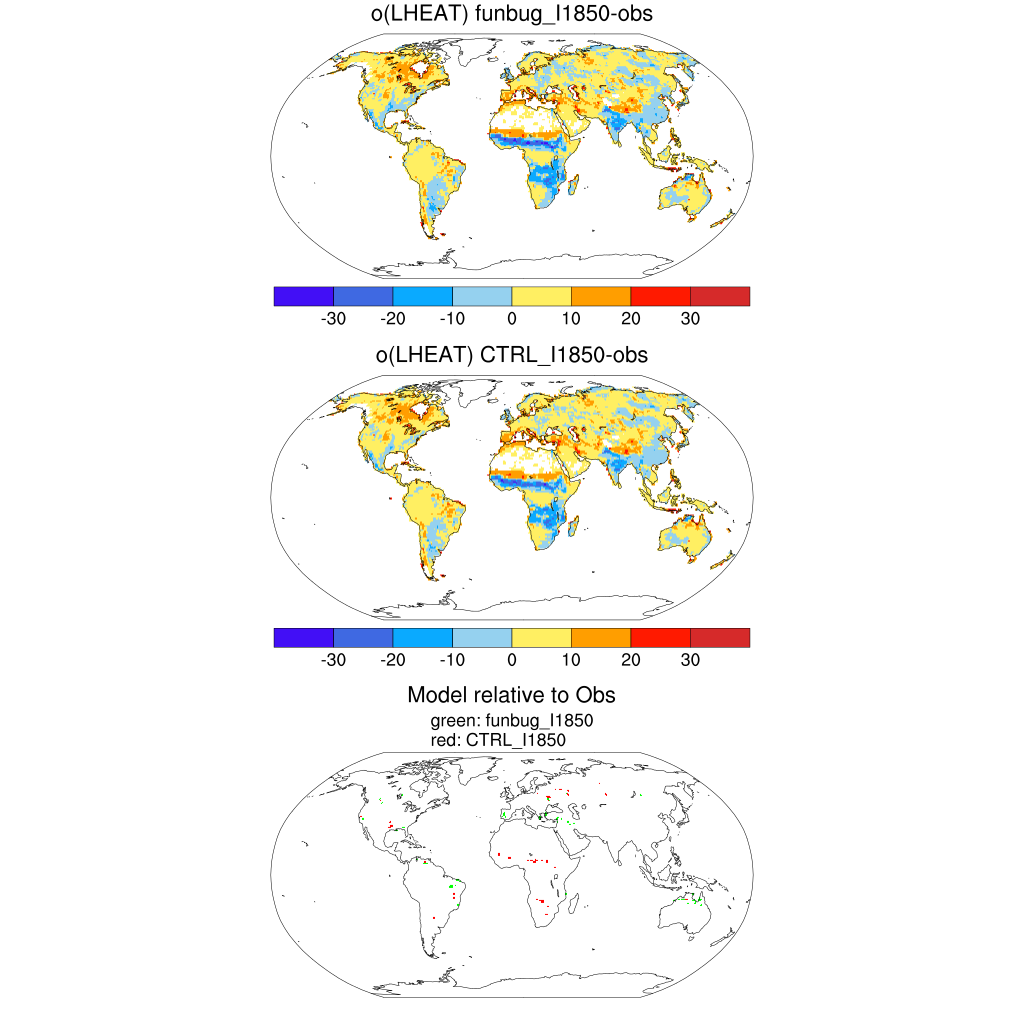
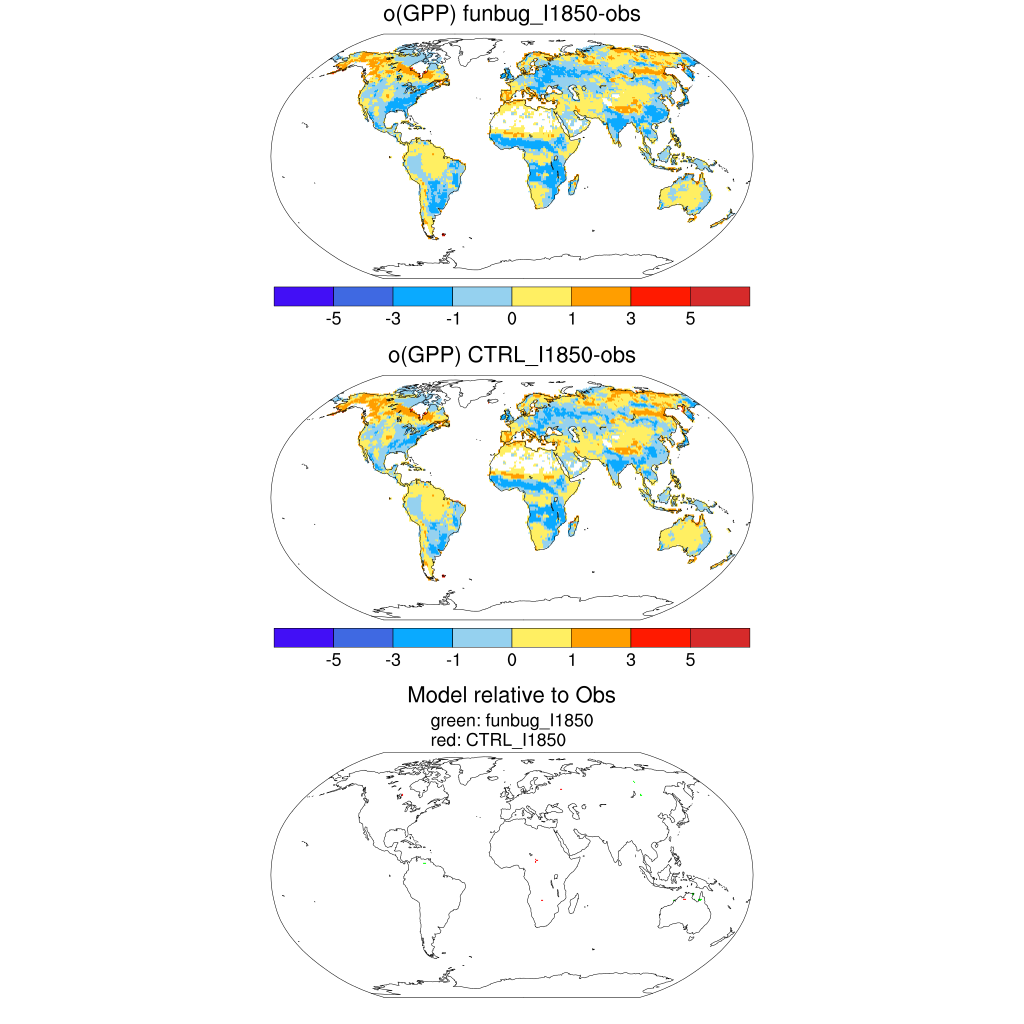
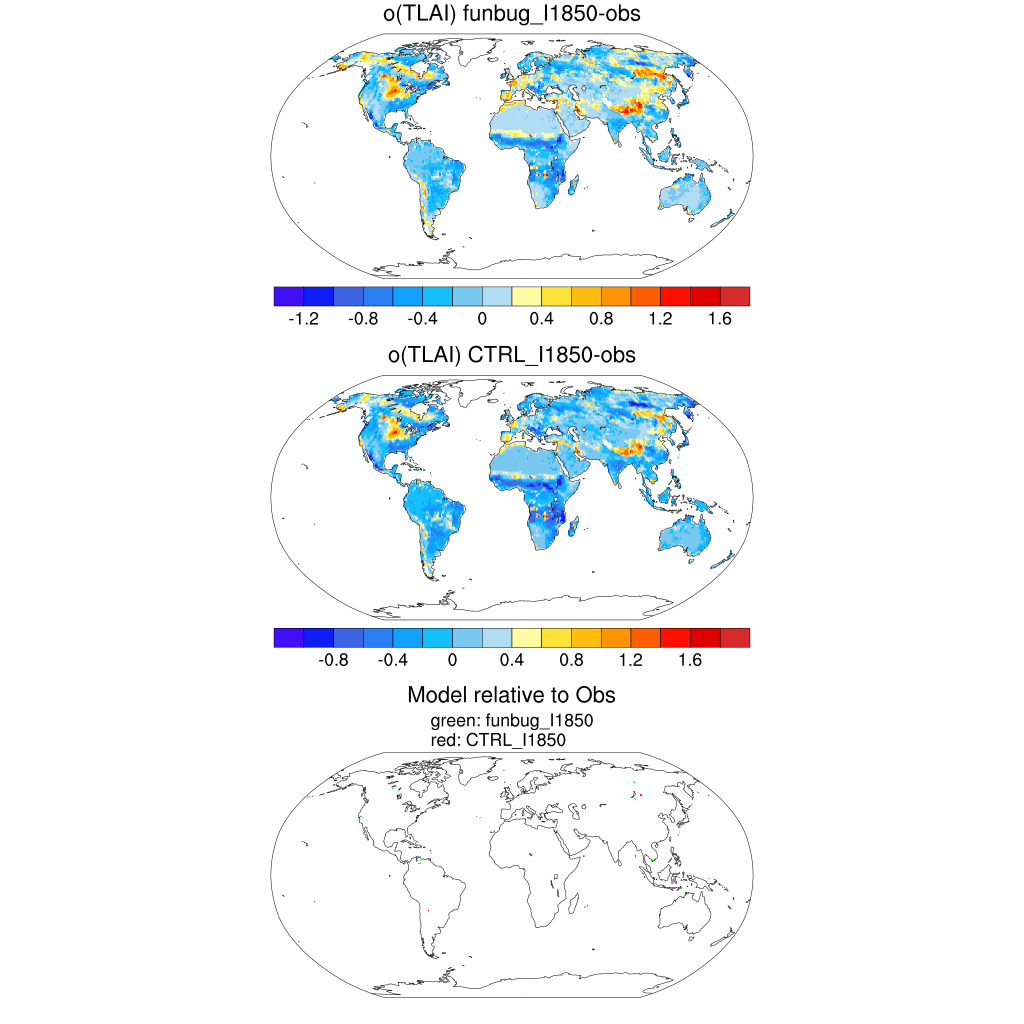
Set 9 Description: Contour plots and statistics for precipitation and temperature. Statistics include DJF, JJA, and ANN biases, and RMSE, correlation and standard deviation of the annual cycle relative to observations
| 1. RMSE | TSA | PREC | ASA | LHEAT | GPP | TLAI |
|---|---|---|---|---|---|---|
| 2. Seasonal bias | ||||||
| TSA | DJF | MAM | JJA | SON | ANN | |
| PREC | DJF | MAM | JJA | SON | ANN | |
| ASA | DJF | MAM | JJA | SON | ANN | |
| LHEAT | DJF | MAM | JJA | SON | ANN | |
| GPP | DJF | MAM | JJA | SON | ANN | |
| TLAI | DJF | MAM | JJA | SON | ANN | |
| 3. Correlation | TSA | PREC | ASA | LHEAT | GPP | TLAI |
| 4. Standard Deviation | TSA | PREC | ASA | LHEAT | GPP | TLAI |
| 5. Tables | --- | |||||