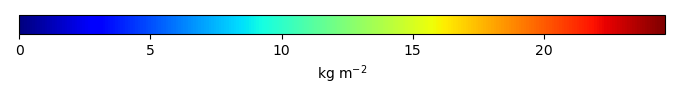
Mean State
Download Data |
Period Mean (original grids) [Pg] |
Model Period Mean (intersection) [Pg] |
Benchmark Period Mean (intersection) [Pg] |
Model Period Mean (complement) [Pg] |
Benchmark Period Mean (complement) [Pg] |
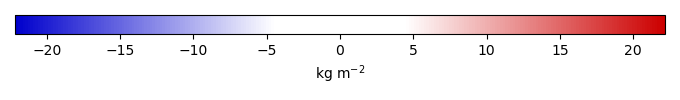
Bias [kg m-2] |
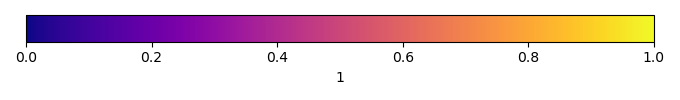
Bias Score [1] |
Spatial Distribution Score [1] |
Overall Score [1] |
|||
|---|---|---|---|---|---|---|---|---|---|---|---|---|
| Benchmark | [-] | 50.2 | ||||||||||
| h0 | [-] | 53.3 | 54.0 | 50.2 | 0.0201 | 1.48 | 0.630 | 0.953 | 0.791 | |||
| h0a | [-] | 53.3 | 54.0 | 50.2 | 0.0201 | 1.48 | 0.630 | 0.953 | 0.791 |
Download Data |
Period Mean (original grids) [Pg] |
Model Period Mean (intersection) [Pg] |
Benchmark Period Mean (intersection) [Pg] |
Model Period Mean (complement) [Pg] |
Benchmark Period Mean (complement) [Pg] |
Bias [kg m-2] |
Bias Score [1] |
Spatial Distribution Score [1] |
Overall Score [1] |
|||
|---|---|---|---|---|---|---|---|---|---|---|---|---|
| Benchmark | [-] | 10.5 | ||||||||||
| h0 | [-] | 4.64 | 4.10 | 10.5 | 0.00246 | -0.910 | 0.617 | 0.614 | 0.615 | |||
| h0a | [-] | 4.64 | 4.10 | 10.5 | 0.00246 | -0.910 | 0.617 | 0.614 | 0.615 |
Download Data |
Period Mean (original grids) [Pg] |
Model Period Mean (intersection) [Pg] |
Benchmark Period Mean (intersection) [Pg] |
Model Period Mean (complement) [Pg] |
Benchmark Period Mean (complement) [Pg] |
Bias [kg m-2] |
Bias Score [1] |
Spatial Distribution Score [1] |
Overall Score [1] |
|||
|---|---|---|---|---|---|---|---|---|---|---|---|---|
| Benchmark | [-] | 20.8 | ||||||||||
| h0 | [-] | 14.6 | 14.3 | 20.7 | 0.0159 | -0.253 | 0.496 | 0.616 | 0.556 | |||
| h0a | [-] | 14.6 | 14.3 | 20.7 | 0.0159 | -0.253 | 0.496 | 0.616 | 0.556 |
Download Data |
Period Mean (original grids) [Pg] |
Model Period Mean (intersection) [Pg] |
Benchmark Period Mean (intersection) [Pg] |
Model Period Mean (complement) [Pg] |
Benchmark Period Mean (complement) [Pg] |
Bias [kg m-2] |
Bias Score [1] |
Spatial Distribution Score [1] |
Overall Score [1] |
|||
|---|---|---|---|---|---|---|---|---|---|---|---|---|
| Benchmark | [-] | 3.92 | ||||||||||
| h0 | [-] | 3.04 | 3.07 | 3.96 | 0.00492 | -0.0468 | 0.533 | 0.818 | 0.676 | |||
| h0a | [-] | 3.04 | 3.07 | 3.96 | 0.00492 | -0.0468 | 0.533 | 0.818 | 0.676 |
Download Data |
Period Mean (original grids) [Pg] |
Model Period Mean (intersection) [Pg] |
Benchmark Period Mean (intersection) [Pg] |
Model Period Mean (complement) [Pg] |
Benchmark Period Mean (complement) [Pg] |
Bias [kg m-2] |
Bias Score [1] |
Spatial Distribution Score [1] |
Overall Score [1] |
|||
|---|---|---|---|---|---|---|---|---|---|---|---|---|
| Benchmark | [-] | 32.7 | ||||||||||
| h0 | [-] | 64.0 | 64.0 | 32.4 | 0.254 | 16.0 | 0.207 | 0.827 | 0.517 | |||
| h0a | [-] | 64.0 | 64.0 | 32.4 | 0.254 | 16.0 | 0.207 | 0.827 | 0.517 |
Download Data |
Period Mean (original grids) [Pg] |
Model Period Mean (intersection) [Pg] |
Benchmark Period Mean (intersection) [Pg] |
Model Period Mean (complement) [Pg] |
Benchmark Period Mean (complement) [Pg] |
Bias [kg m-2] |
Bias Score [1] |
Spatial Distribution Score [1] |
Overall Score [1] |
|||
|---|---|---|---|---|---|---|---|---|---|---|---|---|
| Benchmark | [-] | 52.3 | ||||||||||
| h0 | [-] | 66.0 | 64.9 | 52.3 | 0.0154 | 1.66 | 0.604 | 0.947 | 0.775 | |||
| h0a | [-] | 66.0 | 64.9 | 52.3 | 0.0154 | 1.66 | 0.604 | 0.947 | 0.775 |
Download Data |
Period Mean (original grids) [Pg] |
Model Period Mean (intersection) [Pg] |
Benchmark Period Mean (intersection) [Pg] |
Model Period Mean (complement) [Pg] |
Benchmark Period Mean (complement) [Pg] |
Bias [kg m-2] |
Bias Score [1] |
Spatial Distribution Score [1] |
Overall Score [1] |
|||
|---|---|---|---|---|---|---|---|---|---|---|---|---|
| Benchmark | [-] | 17.4 | ||||||||||
| h0 | [-] | 44.6 | 45.8 | 17.2 | 0.0202 | 1.90 | 0.521 | 0.399 | 0.460 | |||
| h0a | [-] | 44.6 | 45.8 | 17.2 | 0.0202 | 1.90 | 0.521 | 0.399 | 0.460 |
Download Data |
Period Mean (original grids) [Pg] |
Model Period Mean (intersection) [Pg] |
Benchmark Period Mean (intersection) [Pg] |
Model Period Mean (complement) [Pg] |
Benchmark Period Mean (complement) [Pg] |
Bias [kg m-2] |
Bias Score [1] |
Spatial Distribution Score [1] |
Overall Score [1] |
|||
|---|---|---|---|---|---|---|---|---|---|---|---|---|
| Benchmark | [-] | 11.4 | ||||||||||
| h0 | [-] | 36.0 | 35.2 | 11.4 | 0.0688 | 4.77 | 0.364 | 0.254 | 0.309 | |||
| h0a | [-] | 36.0 | 35.2 | 11.4 | 0.0688 | 4.77 | 0.364 | 0.254 | 0.309 |
Download Data |
Period Mean (original grids) [Pg] |
Model Period Mean (intersection) [Pg] |
Benchmark Period Mean (intersection) [Pg] |
Model Period Mean (complement) [Pg] |
Benchmark Period Mean (complement) [Pg] |
Bias [kg m-2] |
Bias Score [1] |
Spatial Distribution Score [1] |
Overall Score [1] |
|||
|---|---|---|---|---|---|---|---|---|---|---|---|---|
| Benchmark | [-] | 4.25 | ||||||||||
| h0 | [-] | 5.25 | 5.53 | 4.21 | 0.000863 | 0.446 | 0.526 | 0.904 | 0.715 | |||
| h0a | [-] | 5.25 | 5.53 | 4.21 | 0.000863 | 0.446 | 0.526 | 0.904 | 0.715 |
Download Data |
Period Mean (original grids) [Pg] |
Model Period Mean (intersection) [Pg] |
Benchmark Period Mean (intersection) [Pg] |
Model Period Mean (complement) [Pg] |
Benchmark Period Mean (complement) [Pg] |
Bias [kg m-2] |
Bias Score [1] |
Spatial Distribution Score [1] |
Overall Score [1] |
|||
|---|---|---|---|---|---|---|---|---|---|---|---|---|
| Benchmark | [-] | 7.97 | ||||||||||
| h0 | [-] | 14.6 | 14.5 | 7.91 | 0.0652 | 1.84 | 0.547 | 0.502 | 0.524 | |||
| h0a | [-] | 14.6 | 14.5 | 7.91 | 0.0652 | 1.84 | 0.547 | 0.502 | 0.524 |
Download Data |
Period Mean (original grids) [Pg] |
Model Period Mean (intersection) [Pg] |
Benchmark Period Mean (intersection) [Pg] |
Model Period Mean (complement) [Pg] |
Benchmark Period Mean (complement) [Pg] |
Bias [kg m-2] |
Bias Score [1] |
Spatial Distribution Score [1] |
Overall Score [1] |
|||
|---|---|---|---|---|---|---|---|---|---|---|---|---|
| Benchmark | [-] | 19.2 | ||||||||||
| h0 | [-] | 20.5 | 20.2 | 19.3 | 0.0173 | 1.14 | 0.460 | 0.863 | 0.662 | |||
| h0a | [-] | 20.5 | 20.2 | 19.3 | 0.0173 | 1.14 | 0.460 | 0.863 | 0.662 |
Download Data |
Period Mean (original grids) [Pg] |
Model Period Mean (intersection) [Pg] |
Benchmark Period Mean (intersection) [Pg] |
Model Period Mean (complement) [Pg] |
Benchmark Period Mean (complement) [Pg] |
Bias [kg m-2] |
Bias Score [1] |
Spatial Distribution Score [1] |
Overall Score [1] |
|||
|---|---|---|---|---|---|---|---|---|---|---|---|---|
| Benchmark | [-] | 447. | ||||||||||
| h0 | [-] | 672. | 670. | 447. | 0.00392 | 0.663 | 2.30 | 0.534 | 0.774 | 0.654 | ||
| h0a | [-] | 672. | 670. | 447. | 0.00392 | 0.663 | 2.30 | 0.534 | 0.774 | 0.654 |
Download Data |
Period Mean (original grids) [Pg] |
Model Period Mean (intersection) [Pg] |
Benchmark Period Mean (intersection) [Pg] |
Model Period Mean (complement) [Pg] |
Benchmark Period Mean (complement) [Pg] |
Bias [kg m-2] |
Bias Score [1] |
Spatial Distribution Score [1] |
Overall Score [1] |
|||
|---|---|---|---|---|---|---|---|---|---|---|---|---|
| Benchmark | [-] | 1.25 | ||||||||||
| h0 | [-] | 3.31 | 3.32 | 1.25 | 0.00663 | 0.178 | 0.856 | 0.553 | 0.704 | |||
| h0a | [-] | 3.31 | 3.32 | 1.25 | 0.00663 | 0.178 | 0.856 | 0.553 | 0.704 |
Download Data |
Period Mean (original grids) [Pg] |
Model Period Mean (intersection) [Pg] |
Benchmark Period Mean (intersection) [Pg] |
Model Period Mean (complement) [Pg] |
Benchmark Period Mean (complement) [Pg] |
Bias [kg m-2] |
Bias Score [1] |
Spatial Distribution Score [1] |
Overall Score [1] |
|||
|---|---|---|---|---|---|---|---|---|---|---|---|---|
| Benchmark | [-] | 7.25 | ||||||||||
| h0 | [-] | 10.6 | 10.3 | 7.25 | 0.00342 | 0.657 | 0.495 | 0.599 | 0.547 | |||
| h0a | [-] | 10.6 | 10.3 | 7.25 | 0.00342 | 0.657 | 0.495 | 0.599 | 0.547 |
Download Data |
Period Mean (original grids) [Pg] |
Model Period Mean (intersection) [Pg] |
Benchmark Period Mean (intersection) [Pg] |
Model Period Mean (complement) [Pg] |
Benchmark Period Mean (complement) [Pg] |
Bias [kg m-2] |
Bias Score [1] |
Spatial Distribution Score [1] |
Overall Score [1] |
|||
|---|---|---|---|---|---|---|---|---|---|---|---|---|
| Benchmark | [-] | 7.19 | ||||||||||
| h0 | [-] | 17.9 | 17.4 | 7.13 | 0.0581 | 5.26 | 0.300 | 0.273 | 0.287 | |||
| h0a | [-] | 17.9 | 17.4 | 7.13 | 0.0581 | 5.26 | 0.300 | 0.273 | 0.287 |
Download Data |
Period Mean (original grids) [Pg] |
Model Period Mean (intersection) [Pg] |
Benchmark Period Mean (intersection) [Pg] |
Model Period Mean (complement) [Pg] |
Benchmark Period Mean (complement) [Pg] |
Bias [kg m-2] |
Bias Score [1] |
Spatial Distribution Score [1] |
Overall Score [1] |
|||
|---|---|---|---|---|---|---|---|---|---|---|---|---|
| Benchmark | [-] | 16.1 | ||||||||||
| h0 | [-] | 29.2 | 29.1 | 16.1 | 0.0151 | 3.62 | 0.370 | 0.840 | 0.605 | |||
| h0a | [-] | 29.2 | 29.1 | 16.1 | 0.0151 | 3.62 | 0.370 | 0.840 | 0.605 |
Download Data |
Period Mean (original grids) [Pg] |
Model Period Mean (intersection) [Pg] |
Benchmark Period Mean (intersection) [Pg] |
Model Period Mean (complement) [Pg] |
Benchmark Period Mean (complement) [Pg] |
Bias [kg m-2] |
Bias Score [1] |
Spatial Distribution Score [1] |
Overall Score [1] |
|||
|---|---|---|---|---|---|---|---|---|---|---|---|---|
| Benchmark | [-] | 25.1 | ||||||||||
| h0 | [-] | 45.8 | 45.9 | 25.1 | 0.0279 | 4.42 | 0.374 | 0.891 | 0.633 | |||
| h0a | [-] | 45.8 | 45.9 | 25.1 | 0.0279 | 4.42 | 0.374 | 0.891 | 0.633 |
Download Data |
Period Mean (original grids) [Pg] |
Model Period Mean (intersection) [Pg] |
Benchmark Period Mean (intersection) [Pg] |
Model Period Mean (complement) [Pg] |
Benchmark Period Mean (complement) [Pg] |
Bias [kg m-2] |
Bias Score [1] |
Spatial Distribution Score [1] |
Overall Score [1] |
|||
|---|---|---|---|---|---|---|---|---|---|---|---|---|
| Benchmark | [-] | 7.38 | ||||||||||
| h0 | [-] | 5.65 | 5.70 | 7.33 | 0.0338 | -0.203 | 0.537 | 0.847 | 0.692 | |||
| h0a | [-] | 5.65 | 5.70 | 7.33 | 0.0338 | -0.203 | 0.537 | 0.847 | 0.692 |
Download Data |
Period Mean (original grids) [Pg] |
Model Period Mean (intersection) [Pg] |
Benchmark Period Mean (intersection) [Pg] |
Model Period Mean (complement) [Pg] |
Benchmark Period Mean (complement) [Pg] |
Bias [kg m-2] |
Bias Score [1] |
Spatial Distribution Score [1] |
Overall Score [1] |
|||
|---|---|---|---|---|---|---|---|---|---|---|---|---|
| Benchmark | [-] | 132. | ||||||||||
| h0 | [-] | 180. | 179. | 132. | 0.0213 | 5.98 | 0.582 | 0.940 | 0.761 | |||
| h0a | [-] | 180. | 179. | 132. | 0.0213 | 5.98 | 0.582 | 0.940 | 0.761 |
Download Data |
Period Mean (original grids) [Pg] |
Model Period Mean (intersection) [Pg] |
Benchmark Period Mean (intersection) [Pg] |
Model Period Mean (complement) [Pg] |
Benchmark Period Mean (complement) [Pg] |
Bias [kg m-2] |
Bias Score [1] |
Spatial Distribution Score [1] |
Overall Score [1] |
|||
|---|---|---|---|---|---|---|---|---|---|---|---|---|
| Benchmark | [-] | 15.4 | ||||||||||
| h0 | [-] | 42.9 | 43.9 | 15.3 | 0.00392 | 0.00314 | 4.58 | 0.279 | 0.315 | 0.297 | ||
| h0a | [-] | 42.9 | 43.9 | 15.3 | 0.00392 | 0.00314 | 4.58 | 0.279 | 0.315 | 0.297 |
Download Data |
Period Mean (original grids) [Pg] |
Model Period Mean (intersection) [Pg] |
Benchmark Period Mean (intersection) [Pg] |
Model Period Mean (complement) [Pg] |
Benchmark Period Mean (complement) [Pg] |
Bias [kg m-2] |
Bias Score [1] |
Spatial Distribution Score [1] |
Overall Score [1] |
|||
|---|---|---|---|---|---|---|---|---|---|---|---|---|
| Benchmark | [-] | 4.33 | ||||||||||
| h0 | [-] | 10.1 | 10.0 | 4.26 | 0.00857 | 2.47 | 0.443 | 0.447 | 0.445 | |||
| h0a | [-] | 10.1 | 10.0 | 4.26 | 0.00857 | 2.47 | 0.443 | 0.447 | 0.445 |
Temporally integrated period mean