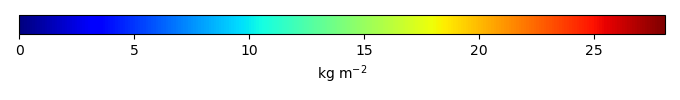
Mean State
Download Data |
Period Mean (original grids) [Pg] |
Model Period Mean (intersection) [Pg] |
Benchmark Period Mean (intersection) [Pg] |
Model Period Mean (complement) [Pg] |
Benchmark Period Mean (complement) [Pg] |
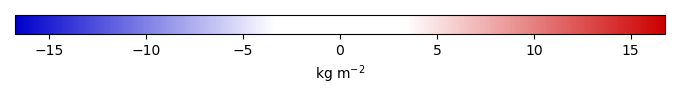
Bias [kg m-2] |
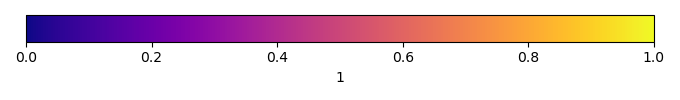
Bias Score [1] |
Spatial Distribution Score [1] |
Overall Score [1] |
|||
|---|---|---|---|---|---|---|---|---|---|---|---|---|
| Benchmark | [-] | 55.9 | ||||||||||
| h0 | [-] | 54.9 | 54.7 | 55.7 | 0.799 | 0.123 | 0.279 | 0.662 | 0.957 | 0.809 | ||
| h0a | [-] | 54.9 | 54.7 | 55.7 | 0.799 | 0.123 | 0.279 | 0.662 | 0.957 | 0.809 |
Download Data |
Period Mean (original grids) [Pg] |
Model Period Mean (intersection) [Pg] |
Benchmark Period Mean (intersection) [Pg] |
Model Period Mean (complement) [Pg] |
Benchmark Period Mean (complement) [Pg] |
Bias [kg m-2] |
Bias Score [1] |
Spatial Distribution Score [1] |
Overall Score [1] |
|||
|---|---|---|---|---|---|---|---|---|---|---|---|---|
| Benchmark | [-] | 4.32 | ||||||||||
| h0 | [-] | 4.98 | 3.59 | 4.31 | 0.989 | 0.0145 | -0.187 | 0.623 | 0.745 | 0.684 | ||
| h0a | [-] | 4.98 | 3.59 | 4.31 | 0.989 | 0.0145 | -0.187 | 0.623 | 0.745 | 0.684 |
Download Data |
Period Mean (original grids) [Pg] |
Model Period Mean (intersection) [Pg] |
Benchmark Period Mean (intersection) [Pg] |
Model Period Mean (complement) [Pg] |
Benchmark Period Mean (complement) [Pg] |
Bias [kg m-2] |
Bias Score [1] |
Spatial Distribution Score [1] |
Overall Score [1] |
|||
|---|---|---|---|---|---|---|---|---|---|---|---|---|
| Benchmark | [-] | 17.1 | ||||||||||
| h0 | [-] | 15.5 | 13.5 | 17.0 | 1.52 | 0.0744 | -0.166 | 0.590 | 0.700 | 0.645 | ||
| h0a | [-] | 15.5 | 13.5 | 17.0 | 1.52 | 0.0744 | -0.166 | 0.590 | 0.700 | 0.645 |
Download Data |
Period Mean (original grids) [Pg] |
Model Period Mean (intersection) [Pg] |
Benchmark Period Mean (intersection) [Pg] |
Model Period Mean (complement) [Pg] |
Benchmark Period Mean (complement) [Pg] |
Bias [kg m-2] |
Bias Score [1] |
Spatial Distribution Score [1] |
Overall Score [1] |
|||
|---|---|---|---|---|---|---|---|---|---|---|---|---|
| Benchmark | [-] | 2.87 | ||||||||||
| h0 | [-] | 3.09 | 2.82 | 2.85 | 0.324 | 0.0147 | 0.148 | 0.515 | 0.763 | 0.639 | ||
| h0a | [-] | 3.09 | 2.82 | 2.85 | 0.324 | 0.0147 | 0.148 | 0.515 | 0.763 | 0.639 |
Download Data |
Period Mean (original grids) [Pg] |
Model Period Mean (intersection) [Pg] |
Benchmark Period Mean (intersection) [Pg] |
Model Period Mean (complement) [Pg] |
Benchmark Period Mean (complement) [Pg] |
Bias [kg m-2] |
Bias Score [1] |
Spatial Distribution Score [1] |
Overall Score [1] |
|||
|---|---|---|---|---|---|---|---|---|---|---|---|---|
| Benchmark | [-] | 63.4 | ||||||||||
| h0 | [-] | 65.6 | 61.8 | 61.0 | 3.37 | 2.46 | 7.40 | 0.588 | 0.912 | 0.750 | ||
| h0a | [-] | 65.6 | 61.8 | 61.0 | 3.37 | 2.46 | 7.40 | 0.588 | 0.912 | 0.750 |
Download Data |
Period Mean (original grids) [Pg] |
Model Period Mean (intersection) [Pg] |
Benchmark Period Mean (intersection) [Pg] |
Model Period Mean (complement) [Pg] |
Benchmark Period Mean (complement) [Pg] |
Bias [kg m-2] |
Bias Score [1] |
Spatial Distribution Score [1] |
Overall Score [1] |
|||
|---|---|---|---|---|---|---|---|---|---|---|---|---|
| Benchmark | [-] | 43.7 | ||||||||||
| h0 | [-] | 67.4 | 65.9 | 43.6 | 0.312 | 0.100 | 2.70 | 0.516 | 0.768 | 0.642 | ||
| h0a | [-] | 67.4 | 65.9 | 43.6 | 0.312 | 0.100 | 2.70 | 0.516 | 0.768 | 0.642 |
Download Data |
Period Mean (original grids) [Pg] |
Model Period Mean (intersection) [Pg] |
Benchmark Period Mean (intersection) [Pg] |
Model Period Mean (complement) [Pg] |
Benchmark Period Mean (complement) [Pg] |
Bias [kg m-2] |
Bias Score [1] |
Spatial Distribution Score [1] |
Overall Score [1] |
|||
|---|---|---|---|---|---|---|---|---|---|---|---|---|
| Benchmark | [-] | 42.4 | ||||||||||
| h0 | [-] | 44.5 | 42.1 | 42.1 | 3.53 | 0.309 | 0.475 | 0.468 | 0.614 | 0.541 | ||
| h0a | [-] | 44.5 | 42.1 | 42.1 | 3.53 | 0.309 | 0.475 | 0.468 | 0.614 | 0.541 |
Download Data |
Period Mean (original grids) [Pg] |
Model Period Mean (intersection) [Pg] |
Benchmark Period Mean (intersection) [Pg] |
Model Period Mean (complement) [Pg] |
Benchmark Period Mean (complement) [Pg] |
Bias [kg m-2] |
Bias Score [1] |
Spatial Distribution Score [1] |
Overall Score [1] |
|||
|---|---|---|---|---|---|---|---|---|---|---|---|---|
| Benchmark | [-] | 35.8 | ||||||||||
| h0 | [-] | 37.0 | 33.7 | 34.9 | 2.36 | 0.982 | 1.30 | 0.518 | 0.793 | 0.655 | ||
| h0a | [-] | 37.0 | 33.7 | 34.9 | 2.36 | 0.982 | 1.30 | 0.518 | 0.793 | 0.655 |
Download Data |
Period Mean (original grids) [Pg] |
Model Period Mean (intersection) [Pg] |
Benchmark Period Mean (intersection) [Pg] |
Model Period Mean (complement) [Pg] |
Benchmark Period Mean (complement) [Pg] |
Bias [kg m-2] |
Bias Score [1] |
Spatial Distribution Score [1] |
Overall Score [1] |
|||
|---|---|---|---|---|---|---|---|---|---|---|---|---|
| Benchmark | [-] | 2.98 | ||||||||||
| h0 | [-] | 5.19 | 4.42 | 2.98 | 1.09 | 0.786 | 0.466 | 0.792 | 0.629 | |||
| h0a | [-] | 5.19 | 4.42 | 2.98 | 1.09 | 0.786 | 0.466 | 0.792 | 0.629 |
Download Data |
Period Mean (original grids) [Pg] |
Model Period Mean (intersection) [Pg] |
Benchmark Period Mean (intersection) [Pg] |
Model Period Mean (complement) [Pg] |
Benchmark Period Mean (complement) [Pg] |
Bias [kg m-2] |
Bias Score [1] |
Spatial Distribution Score [1] |
Overall Score [1] |
|||
|---|---|---|---|---|---|---|---|---|---|---|---|---|
| Benchmark | [-] | 38.7 | ||||||||||
| h0 | [-] | 14.7 | 12.3 | 37.8 | 2.16 | 0.933 | -4.06 | 0.475 | 0.839 | 0.657 | ||
| h0a | [-] | 14.7 | 12.3 | 37.8 | 2.16 | 0.933 | -4.06 | 0.475 | 0.839 | 0.657 |
Download Data |
Period Mean (original grids) [Pg] |
Model Period Mean (intersection) [Pg] |
Benchmark Period Mean (intersection) [Pg] |
Model Period Mean (complement) [Pg] |
Benchmark Period Mean (complement) [Pg] |
Bias [kg m-2] |
Bias Score [1] |
Spatial Distribution Score [1] |
Overall Score [1] |
|||
|---|---|---|---|---|---|---|---|---|---|---|---|---|
| Benchmark | [-] | 36.0 | ||||||||||
| h0 | [-] | 20.7 | 19.5 | 35.8 | 0.945 | 0.225 | -2.35 | 0.561 | 0.837 | 0.699 | ||
| h0a | [-] | 20.7 | 19.5 | 35.8 | 0.945 | 0.225 | -2.35 | 0.561 | 0.837 | 0.699 |
Download Data |
Period Mean (original grids) [Pg] |
Model Period Mean (intersection) [Pg] |
Benchmark Period Mean (intersection) [Pg] |
Model Period Mean (complement) [Pg] |
Benchmark Period Mean (complement) [Pg] |
Bias [kg m-2] |
Bias Score [1] |
Spatial Distribution Score [1] |
Overall Score [1] |
|||
|---|---|---|---|---|---|---|---|---|---|---|---|---|
| Benchmark | [-] | 588. | ||||||||||
| h0 | [-] | 689. | 662. | 582. | 25.6 | 6.38 | 1.66 | 0.501 | 0.841 | 0.671 | ||
| h0a | [-] | 689. | 662. | 582. | 25.6 | 6.38 | 1.66 | 0.501 | 0.841 | 0.671 |
Download Data |
Period Mean (original grids) [Pg] |
Model Period Mean (intersection) [Pg] |
Benchmark Period Mean (intersection) [Pg] |
Model Period Mean (complement) [Pg] |
Benchmark Period Mean (complement) [Pg] |
Bias [kg m-2] |
Bias Score [1] |
Spatial Distribution Score [1] |
Overall Score [1] |
|||
|---|---|---|---|---|---|---|---|---|---|---|---|---|
| Benchmark | [-] | 4.70 | ||||||||||
| h0 | [-] | 3.35 | 1.77 | 4.65 | 1.58 | 0.0591 | -1.54 | 0.552 | 0.549 | 0.550 | ||
| h0a | [-] | 3.35 | 1.77 | 4.65 | 1.58 | 0.0591 | -1.54 | 0.552 | 0.549 | 0.550 |
Download Data |
Period Mean (original grids) [Pg] |
Model Period Mean (intersection) [Pg] |
Benchmark Period Mean (intersection) [Pg] |
Model Period Mean (complement) [Pg] |
Benchmark Period Mean (complement) [Pg] |
Bias [kg m-2] |
Bias Score [1] |
Spatial Distribution Score [1] |
Overall Score [1] |
|||
|---|---|---|---|---|---|---|---|---|---|---|---|---|
| Benchmark | [-] | 6.62 | ||||||||||
| h0 | [-] | 10.5 | 9.02 | 6.60 | 1.27 | 0.0169 | 0.906 | 0.378 | 0.826 | 0.602 | ||
| h0a | [-] | 10.5 | 9.02 | 6.60 | 1.27 | 0.0169 | 0.906 | 0.378 | 0.826 | 0.602 |
Download Data |
Period Mean (original grids) [Pg] |
Model Period Mean (intersection) [Pg] |
Benchmark Period Mean (intersection) [Pg] |
Model Period Mean (complement) [Pg] |
Benchmark Period Mean (complement) [Pg] |
Bias [kg m-2] |
Bias Score [1] |
Spatial Distribution Score [1] |
Overall Score [1] |
|||
|---|---|---|---|---|---|---|---|---|---|---|---|---|
| Benchmark | [-] | 7.90 | ||||||||||
| h0 | [-] | 18.3 | 16.6 | 7.57 | 1.24 | 0.333 | 5.79 | 0.314 | 0.235 | 0.274 | ||
| h0a | [-] | 18.3 | 16.6 | 7.57 | 1.24 | 0.333 | 5.79 | 0.314 | 0.235 | 0.274 |
Download Data |
Period Mean (original grids) [Pg] |
Model Period Mean (intersection) [Pg] |
Benchmark Period Mean (intersection) [Pg] |
Model Period Mean (complement) [Pg] |
Benchmark Period Mean (complement) [Pg] |
Bias [kg m-2] |
Bias Score [1] |
Spatial Distribution Score [1] |
Overall Score [1] |
|||
|---|---|---|---|---|---|---|---|---|---|---|---|---|
| Benchmark | [-] | 19.4 | ||||||||||
| h0 | [-] | 29.5 | 28.7 | 19.3 | 0.687 | 0.0945 | 2.77 | 0.519 | 0.647 | 0.583 | ||
| h0a | [-] | 29.5 | 28.7 | 19.3 | 0.687 | 0.0945 | 2.77 | 0.519 | 0.647 | 0.583 |
Download Data |
Period Mean (original grids) [Pg] |
Model Period Mean (intersection) [Pg] |
Benchmark Period Mean (intersection) [Pg] |
Model Period Mean (complement) [Pg] |
Benchmark Period Mean (complement) [Pg] |
Bias [kg m-2] |
Bias Score [1] |
Spatial Distribution Score [1] |
Overall Score [1] |
|||
|---|---|---|---|---|---|---|---|---|---|---|---|---|
| Benchmark | [-] | 29.9 | ||||||||||
| h0 | [-] | 46.1 | 45.7 | 29.7 | 0.603 | 0.199 | 3.48 | 0.443 | 0.913 | 0.678 | ||
| h0a | [-] | 46.1 | 45.7 | 29.7 | 0.603 | 0.199 | 3.48 | 0.443 | 0.913 | 0.678 |
Download Data |
Period Mean (original grids) [Pg] |
Model Period Mean (intersection) [Pg] |
Benchmark Period Mean (intersection) [Pg] |
Model Period Mean (complement) [Pg] |
Benchmark Period Mean (complement) [Pg] |
Bias [kg m-2] |
Bias Score [1] |
Spatial Distribution Score [1] |
Overall Score [1] |
|||
|---|---|---|---|---|---|---|---|---|---|---|---|---|
| Benchmark | [-] | 15.3 | ||||||||||
| h0 | [-] | 5.72 | 5.42 | 15.2 | 0.347 | 0.143 | -2.84 | 0.484 | 0.868 | 0.676 | ||
| h0a | [-] | 5.72 | 5.42 | 15.2 | 0.347 | 0.143 | -2.84 | 0.484 | 0.868 | 0.676 |
Download Data |
Period Mean (original grids) [Pg] |
Model Period Mean (intersection) [Pg] |
Benchmark Period Mean (intersection) [Pg] |
Model Period Mean (complement) [Pg] |
Benchmark Period Mean (complement) [Pg] |
Bias [kg m-2] |
Bias Score [1] |
Spatial Distribution Score [1] |
Overall Score [1] |
|||
|---|---|---|---|---|---|---|---|---|---|---|---|---|
| Benchmark | [-] | 130. | ||||||||||
| h0 | [-] | 188. | 186. | 129. | 1.00 | 0.134 | 7.16 | 0.568 | 0.949 | 0.758 | ||
| h0a | [-] | 188. | 186. | 129. | 1.00 | 0.134 | 7.16 | 0.568 | 0.949 | 0.758 |
Download Data |
Period Mean (original grids) [Pg] |
Model Period Mean (intersection) [Pg] |
Benchmark Period Mean (intersection) [Pg] |
Model Period Mean (complement) [Pg] |
Benchmark Period Mean (complement) [Pg] |
Bias [kg m-2] |
Bias Score [1] |
Spatial Distribution Score [1] |
Overall Score [1] |
|||
|---|---|---|---|---|---|---|---|---|---|---|---|---|
| Benchmark | [-] | 23.7 | ||||||||||
| h0 | [-] | 44.1 | 43.9 | 23.6 | 0.853 | 0.0502 | 3.35 | 0.347 | 0.593 | 0.470 | ||
| h0a | [-] | 44.1 | 43.9 | 23.6 | 0.853 | 0.0502 | 3.35 | 0.347 | 0.593 | 0.470 |
Download Data |
Period Mean (original grids) [Pg] |
Model Period Mean (intersection) [Pg] |
Benchmark Period Mean (intersection) [Pg] |
Model Period Mean (complement) [Pg] |
Benchmark Period Mean (complement) [Pg] |
Bias [kg m-2] |
Bias Score [1] |
Spatial Distribution Score [1] |
Overall Score [1] |
|||
|---|---|---|---|---|---|---|---|---|---|---|---|---|
| Benchmark | [-] | 7.82 | ||||||||||
| h0 | [-] | 10.0 | 9.53 | 7.71 | 0.459 | 0.116 | 1.51 | 0.363 | 0.759 | 0.561 | ||
| h0a | [-] | 10.0 | 9.53 | 7.71 | 0.459 | 0.116 | 1.51 | 0.363 | 0.759 | 0.561 |
Temporally integrated period mean