Mean State
Download Data |
Period Mean (original grids) [Pg] |
Model Period Mean (intersection) [Pg] |
Benchmark Period Mean (intersection) [Pg] |
Model Period Mean (complement) [Pg] |
Benchmark Period Mean (complement) [Pg] |
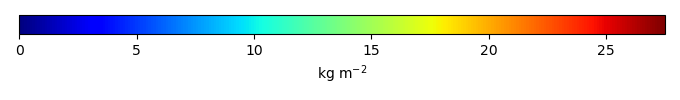
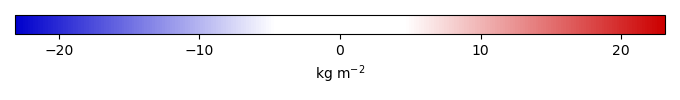
Bias [kg m-2] |
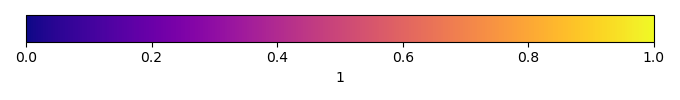
Bias Score [1] |
Spatial Distribution Score [1] |
Overall Score [1] |
|||
|---|---|---|---|---|---|---|---|---|---|---|---|---|
| Benchmark | [-] | 38.7 | ||||||||||
| h0 | [-] | 55.7 | 56.1 | 38.7 | 0.373 | 0.0105 | 4.35 | 0.486 | 0.768 | 0.627 | ||
| h0a | [-] | 55.7 | 56.1 | 38.7 | 0.373 | 0.0105 | 4.35 | 0.486 | 0.768 | 0.627 |
Download Data |
Period Mean (original grids) [Pg] |
Model Period Mean (intersection) [Pg] |
Benchmark Period Mean (intersection) [Pg] |
Model Period Mean (complement) [Pg] |
Benchmark Period Mean (complement) [Pg] |
Bias [kg m-2] |
Bias Score [1] |
Spatial Distribution Score [1] |
Overall Score [1] |
|||
|---|---|---|---|---|---|---|---|---|---|---|---|---|
| Benchmark | [-] | 11.9 | ||||||||||
| h0 | [-] | 5.13 | 4.65 | 11.9 | 0.0685 | 0.00545 | -1.06 | 0.460 | 0.775 | 0.618 | ||
| h0a | [-] | 5.13 | 4.65 | 11.9 | 0.0685 | 0.00545 | -1.06 | 0.460 | 0.775 | 0.618 |
Download Data |
Period Mean (original grids) [Pg] |
Model Period Mean (intersection) [Pg] |
Benchmark Period Mean (intersection) [Pg] |
Model Period Mean (complement) [Pg] |
Benchmark Period Mean (complement) [Pg] |
Bias [kg m-2] |
Bias Score [1] |
Spatial Distribution Score [1] |
Overall Score [1] |
|||
|---|---|---|---|---|---|---|---|---|---|---|---|---|
| Benchmark | [-] | 24.6 | ||||||||||
| h0 | [-] | 16.1 | 15.1 | 24.5 | 0.561 | 0.0169 | -0.772 | 0.475 | 0.526 | 0.501 | ||
| h0a | [-] | 16.1 | 15.1 | 24.5 | 0.561 | 0.0169 | -0.772 | 0.475 | 0.526 | 0.501 |
Download Data |
Period Mean (original grids) [Pg] |
Model Period Mean (intersection) [Pg] |
Benchmark Period Mean (intersection) [Pg] |
Model Period Mean (complement) [Pg] |
Benchmark Period Mean (complement) [Pg] |
Bias [kg m-2] |
Bias Score [1] |
Spatial Distribution Score [1] |
Overall Score [1] |
|||
|---|---|---|---|---|---|---|---|---|---|---|---|---|
| Benchmark | [-] | 36.8 | ||||||||||
| h0 | [-] | 66.4 | 62.7 | 36.4 | 3.30 | 0.363 | 14.4 | 0.293 | 0.930 | 0.611 | ||
| h0a | [-] | 66.4 | 62.7 | 36.4 | 3.30 | 0.363 | 14.4 | 0.293 | 0.930 | 0.611 |
Download Data |
Period Mean (original grids) [Pg] |
Model Period Mean (intersection) [Pg] |
Benchmark Period Mean (intersection) [Pg] |
Model Period Mean (complement) [Pg] |
Benchmark Period Mean (complement) [Pg] |
Bias [kg m-2] |
Bias Score [1] |
Spatial Distribution Score [1] |
Overall Score [1] |
|||
|---|---|---|---|---|---|---|---|---|---|---|---|---|
| Benchmark | [-] | 38.4 | ||||||||||
| h0 | [-] | 44.7 | 30.6 | 38.3 | 15.2 | 0.102 | -0.492 | 0.497 | 0.618 | 0.557 | ||
| h0a | [-] | 44.7 | 30.6 | 38.3 | 15.2 | 0.102 | -0.492 | 0.497 | 0.618 | 0.557 |
Download Data |
Period Mean (original grids) [Pg] |
Model Period Mean (intersection) [Pg] |
Benchmark Period Mean (intersection) [Pg] |
Model Period Mean (complement) [Pg] |
Benchmark Period Mean (complement) [Pg] |
Bias [kg m-2] |
Bias Score [1] |
Spatial Distribution Score [1] |
Overall Score [1] |
|||
|---|---|---|---|---|---|---|---|---|---|---|---|---|
| Benchmark | [-] | 43.7 | ||||||||||
| h0 | [-] | 37.5 | 35.6 | 43.5 | 1.00 | 0.172 | 0.137 | 0.471 | 0.743 | 0.607 | ||
| h0a | [-] | 37.5 | 35.6 | 43.5 | 1.00 | 0.172 | 0.137 | 0.471 | 0.743 | 0.607 |
Download Data |
Period Mean (original grids) [Pg] |
Model Period Mean (intersection) [Pg] |
Benchmark Period Mean (intersection) [Pg] |
Model Period Mean (complement) [Pg] |
Benchmark Period Mean (complement) [Pg] |
Bias [kg m-2] |
Bias Score [1] |
Spatial Distribution Score [1] |
Overall Score [1] |
|||
|---|---|---|---|---|---|---|---|---|---|---|---|---|
| Benchmark | [-] | 13.7 | ||||||||||
| h0 | [-] | 14.8 | 3.66 | 13.6 | 10.9 | 0.0388 | -1.34 | 0.435 | 0.556 | 0.496 | ||
| h0a | [-] | 14.8 | 3.66 | 13.6 | 10.9 | 0.0388 | -1.34 | 0.435 | 0.556 | 0.496 |
Download Data |
Period Mean (original grids) [Pg] |
Model Period Mean (intersection) [Pg] |
Benchmark Period Mean (intersection) [Pg] |
Model Period Mean (complement) [Pg] |
Benchmark Period Mean (complement) [Pg] |
Bias [kg m-2] |
Bias Score [1] |
Spatial Distribution Score [1] |
Overall Score [1] |
|||
|---|---|---|---|---|---|---|---|---|---|---|---|---|
| Benchmark | [-] | 349. | ||||||||||
| h0 | [-] | 699. | 478. | 348. | 219. | 0.874 | 2.71 | 0.438 | 0.611 | 0.524 | ||
| h0a | [-] | 699. | 478. | 348. | 219. | 0.874 | 2.71 | 0.438 | 0.611 | 0.524 |
Download Data |
Period Mean (original grids) [Pg] |
Model Period Mean (intersection) [Pg] |
Benchmark Period Mean (intersection) [Pg] |
Model Period Mean (complement) [Pg] |
Benchmark Period Mean (complement) [Pg] |
Bias [kg m-2] |
Bias Score [1] |
Spatial Distribution Score [1] |
Overall Score [1] |
|||
|---|---|---|---|---|---|---|---|---|---|---|---|---|
| Benchmark | [-] | 2.53 | ||||||||||
| h0 | [-] | 3.39 | 0.345 | 2.53 | 3.04 | 0.000123 | -0.960 | 0.466 | 0.0663 | 0.266 | ||
| h0a | [-] | 3.39 | 0.345 | 2.53 | 3.04 | 0.000123 | -0.960 | 0.466 | 0.0663 | 0.266 |
Download Data |
Period Mean (original grids) [Pg] |
Model Period Mean (intersection) [Pg] |
Benchmark Period Mean (intersection) [Pg] |
Model Period Mean (complement) [Pg] |
Benchmark Period Mean (complement) [Pg] |
Bias [kg m-2] |
Bias Score [1] |
Spatial Distribution Score [1] |
Overall Score [1] |
|||
|---|---|---|---|---|---|---|---|---|---|---|---|---|
| Benchmark | [-] | 11.1 | ||||||||||
| h0 | [-] | 18.5 | 17.1 | 11.0 | 0.918 | 0.0901 | 4.02 | 0.403 | 0.447 | 0.425 | ||
| h0a | [-] | 18.5 | 17.1 | 11.0 | 0.918 | 0.0901 | 4.02 | 0.403 | 0.447 | 0.425 |
Download Data |
Period Mean (original grids) [Pg] |
Model Period Mean (intersection) [Pg] |
Benchmark Period Mean (intersection) [Pg] |
Model Period Mean (complement) [Pg] |
Benchmark Period Mean (complement) [Pg] |
Bias [kg m-2] |
Bias Score [1] |
Spatial Distribution Score [1] |
Overall Score [1] |
|||
|---|---|---|---|---|---|---|---|---|---|---|---|---|
| Benchmark | [-] | 1.55 | ||||||||||
| h0 | [-] | 29.6 | 6.37 | 1.54 | 23.1 | 0.00751 | 7.44 | 0.194 | 0.304 | 0.249 | ||
| h0a | [-] | 29.6 | 6.37 | 1.54 | 23.1 | 0.00751 | 7.44 | 0.194 | 0.304 | 0.249 |
Download Data |
Period Mean (original grids) [Pg] |
Model Period Mean (intersection) [Pg] |
Benchmark Period Mean (intersection) [Pg] |
Model Period Mean (complement) [Pg] |
Benchmark Period Mean (complement) [Pg] |
Bias [kg m-2] |
Bias Score [1] |
Spatial Distribution Score [1] |
Overall Score [1] |
|||
|---|---|---|---|---|---|---|---|---|---|---|---|---|
| Benchmark | [-] | 0.219 | ||||||||||
| h0 | [-] | 5.73 | 0.137 | 0.219 | 5.65 | -0.262 | 0.602 | 0.297 | 0.449 | |||
| h0a | [-] | 5.73 | 0.137 | 0.219 | 5.65 | -0.262 | 0.602 | 0.297 | 0.449 |
Download Data |
Period Mean (original grids) [Pg] |
Model Period Mean (intersection) [Pg] |
Benchmark Period Mean (intersection) [Pg] |
Model Period Mean (complement) [Pg] |
Benchmark Period Mean (complement) [Pg] |
Bias [kg m-2] |
Bias Score [1] |
Spatial Distribution Score [1] |
Overall Score [1] |
|||
|---|---|---|---|---|---|---|---|---|---|---|---|---|
| Benchmark | [-] | 100. | ||||||||||
| h0 | [-] | 193. | 191. | 100. | 0.696 | 0.0239 | 11.1 | 0.390 | 0.878 | 0.634 | ||
| h0a | [-] | 193. | 191. | 100. | 0.696 | 0.0239 | 11.1 | 0.390 | 0.878 | 0.634 |
Download Data |
Period Mean (original grids) [Pg] |
Model Period Mean (intersection) [Pg] |
Benchmark Period Mean (intersection) [Pg] |
Model Period Mean (complement) [Pg] |
Benchmark Period Mean (complement) [Pg] |
Bias [kg m-2] |
Bias Score [1] |
Spatial Distribution Score [1] |
Overall Score [1] |
|||
|---|---|---|---|---|---|---|---|---|---|---|---|---|
| Benchmark | [-] | 18.4 | ||||||||||
| h0 | [-] | 45.0 | 45.1 | 18.4 | 0.585 | 0.0158 | 4.28 | 0.371 | 0.256 | 0.313 | ||
| h0a | [-] | 45.0 | 45.1 | 18.4 | 0.585 | 0.0158 | 4.28 | 0.371 | 0.256 | 0.313 |
Download Data |
Period Mean (original grids) [Pg] |
Model Period Mean (intersection) [Pg] |
Benchmark Period Mean (intersection) [Pg] |
Model Period Mean (complement) [Pg] |
Benchmark Period Mean (complement) [Pg] |
Bias [kg m-2] |
Bias Score [1] |
Spatial Distribution Score [1] |
Overall Score [1] |
|||
|---|---|---|---|---|---|---|---|---|---|---|---|---|
| Benchmark | [-] | 7.28 | ||||||||||
| h0 | [-] | 10.0 | 9.80 | 7.25 | 0.192 | 0.0282 | 1.53 | 0.489 | 0.341 | 0.415 | ||
| h0a | [-] | 10.0 | 9.80 | 7.25 | 0.192 | 0.0282 | 1.53 | 0.489 | 0.341 | 0.415 |
Temporally integrated period mean