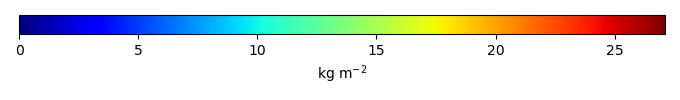
Mean State
Download Data |
Period Mean (original grids) [Pg] |
Model Period Mean (intersection) [Pg] |
Benchmark Period Mean (intersection) [Pg] |
Model Period Mean (complement) [Pg] |
Benchmark Period Mean (complement) [Pg] |
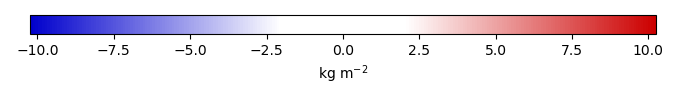
Bias [kg m-2] |
Bias Score [1] |
Spatial Distribution Score [1] |
Overall Score [1] |
|||
|---|---|---|---|---|---|---|---|---|---|---|---|---|
| Benchmark | [-] | 4.43 | ||||||||||
| h0 | [-] | 3.10 | 3.02 | 4.41 | 0.129 | 0.0225 | -0.319 | 0.574 | 0.811 | 0.692 | ||
| h0a | [-] | 3.10 | 3.02 | 4.41 | 0.129 | 0.0225 | -0.319 | 0.574 | 0.811 | 0.692 |
Download Data |
Period Mean (original grids) [Pg] |
Model Period Mean (intersection) [Pg] |
Benchmark Period Mean (intersection) [Pg] |
Model Period Mean (complement) [Pg] |
Benchmark Period Mean (complement) [Pg] |
Bias [kg m-2] |
Bias Score [1] |
Spatial Distribution Score [1] |
Overall Score [1] |
|||
|---|---|---|---|---|---|---|---|---|---|---|---|---|
| Benchmark | [-] | 40.1 | ||||||||||
| h0 | [-] | 67.6 | 66.2 | 40.0 | 0.186 | 0.0925 | 3.11 | 0.483 | 0.602 | 0.542 | ||
| h0a | [-] | 67.6 | 66.2 | 40.0 | 0.186 | 0.0925 | 3.11 | 0.483 | 0.602 | 0.542 |
Download Data |
Period Mean (original grids) [Pg] |
Model Period Mean (intersection) [Pg] |
Benchmark Period Mean (intersection) [Pg] |
Model Period Mean (complement) [Pg] |
Benchmark Period Mean (complement) [Pg] |
Bias [kg m-2] |
Bias Score [1] |
Spatial Distribution Score [1] |
Overall Score [1] |
|||
|---|---|---|---|---|---|---|---|---|---|---|---|---|
| Benchmark | [-] | 28.0 | ||||||||||
| h0 | [-] | 44.6 | 19.9 | 27.7 | 25.8 | 0.287 | -0.582 | 0.528 | 0.570 | 0.549 | ||
| h0a | [-] | 44.6 | 19.9 | 27.7 | 25.8 | 0.287 | -0.582 | 0.528 | 0.570 | 0.549 |
Download Data |
Period Mean (original grids) [Pg] |
Model Period Mean (intersection) [Pg] |
Benchmark Period Mean (intersection) [Pg] |
Model Period Mean (complement) [Pg] |
Benchmark Period Mean (complement) [Pg] |
Bias [kg m-2] |
Bias Score [1] |
Spatial Distribution Score [1] |
Overall Score [1] |
|||
|---|---|---|---|---|---|---|---|---|---|---|---|---|
| Benchmark | [-] | 0.341 | ||||||||||
| h0 | [-] | 37.2 | 0.0786 | 0.341 | 36.1 | -1.83 | 0.475 | 0.675 | 0.575 | |||
| h0a | [-] | 37.2 | 0.0786 | 0.341 | 36.1 | -1.83 | 0.475 | 0.675 | 0.575 |
Download Data |
Period Mean (original grids) [Pg] |
Model Period Mean (intersection) [Pg] |
Benchmark Period Mean (intersection) [Pg] |
Model Period Mean (complement) [Pg] |
Benchmark Period Mean (complement) [Pg] |
Bias [kg m-2] |
Bias Score [1] |
Spatial Distribution Score [1] |
Overall Score [1] |
|||
|---|---|---|---|---|---|---|---|---|---|---|---|---|
| Benchmark | [-] | 3.80 | ||||||||||
| h0 | [-] | 5.19 | 5.02 | 3.79 | 0.491 | 0.00605 | 0.569 | 0.531 | 0.664 | 0.598 | ||
| h0a | [-] | 5.19 | 5.02 | 3.79 | 0.491 | 0.00605 | 0.569 | 0.531 | 0.664 | 0.598 |
Download Data |
Period Mean (original grids) [Pg] |
Model Period Mean (intersection) [Pg] |
Benchmark Period Mean (intersection) [Pg] |
Model Period Mean (complement) [Pg] |
Benchmark Period Mean (complement) [Pg] |
Bias [kg m-2] |
Bias Score [1] |
Spatial Distribution Score [1] |
Overall Score [1] |
|||
|---|---|---|---|---|---|---|---|---|---|---|---|---|
| Benchmark | [-] | 29.4 | ||||||||||
| h0 | [-] | 20.8 | 19.9 | 29.2 | 0.543 | 0.236 | -0.901 | 0.593 | 0.796 | 0.694 | ||
| h0a | [-] | 20.8 | 19.9 | 29.2 | 0.543 | 0.236 | -0.901 | 0.593 | 0.796 | 0.694 |
Download Data |
Period Mean (original grids) [Pg] |
Model Period Mean (intersection) [Pg] |
Benchmark Period Mean (intersection) [Pg] |
Model Period Mean (complement) [Pg] |
Benchmark Period Mean (complement) [Pg] |
Bias [kg m-2] |
Bias Score [1] |
Spatial Distribution Score [1] |
Overall Score [1] |
|||
|---|---|---|---|---|---|---|---|---|---|---|---|---|
| Benchmark | [-] | 174. | ||||||||||
| h0 | [-] | 692. | 205. | 173. | 485. | 1.15 | 1.01 | 0.495 | 0.615 | 0.555 | ||
| h0a | [-] | 692. | 205. | 173. | 485. | 1.15 | 1.01 | 0.495 | 0.615 | 0.555 |
Download Data |
Period Mean (original grids) [Pg] |
Model Period Mean (intersection) [Pg] |
Benchmark Period Mean (intersection) [Pg] |
Model Period Mean (complement) [Pg] |
Benchmark Period Mean (complement) [Pg] |
Bias [kg m-2] |
Bias Score [1] |
Spatial Distribution Score [1] |
Overall Score [1] |
|||
|---|---|---|---|---|---|---|---|---|---|---|---|---|
| Benchmark | [-] | 4.88 | ||||||||||
| h0 | [-] | 3.36 | 1.67 | 4.79 | 1.68 | 0.0857 | -1.92 | 0.559 | 0.812 | 0.685 | ||
| h0a | [-] | 3.36 | 1.67 | 4.79 | 1.68 | 0.0857 | -1.92 | 0.559 | 0.812 | 0.685 |
Download Data |
Period Mean (original grids) [Pg] |
Model Period Mean (intersection) [Pg] |
Benchmark Period Mean (intersection) [Pg] |
Model Period Mean (complement) [Pg] |
Benchmark Period Mean (complement) [Pg] |
Bias [kg m-2] |
Bias Score [1] |
Spatial Distribution Score [1] |
Overall Score [1] |
|||
|---|---|---|---|---|---|---|---|---|---|---|---|---|
| Benchmark | [-] | 9.77 | ||||||||||
| h0 | [-] | 10.5 | 10.0 | 9.71 | 0.256 | 0.0666 | 0.247 | 0.441 | 0.709 | 0.575 | ||
| h0a | [-] | 10.5 | 10.0 | 9.71 | 0.256 | 0.0666 | 0.247 | 0.441 | 0.709 | 0.575 |
Download Data |
Period Mean (original grids) [Pg] |
Model Period Mean (intersection) [Pg] |
Benchmark Period Mean (intersection) [Pg] |
Model Period Mean (complement) [Pg] |
Benchmark Period Mean (complement) [Pg] |
Bias [kg m-2] |
Bias Score [1] |
Spatial Distribution Score [1] |
Overall Score [1] |
|||
|---|---|---|---|---|---|---|---|---|---|---|---|---|
| Benchmark | [-] | 0.211 | ||||||||||
| h0 | [-] | 18.3 | 0.0698 | 0.210 | 17.8 | 0.000277 | -1.04 | 0.578 | 0.880 | 0.729 | ||
| h0a | [-] | 18.3 | 0.0698 | 0.210 | 17.8 | 0.000277 | -1.04 | 0.578 | 0.880 | 0.729 |
Download Data |
Period Mean (original grids) [Pg] |
Model Period Mean (intersection) [Pg] |
Benchmark Period Mean (intersection) [Pg] |
Model Period Mean (complement) [Pg] |
Benchmark Period Mean (complement) [Pg] |
Bias [kg m-2] |
Bias Score [1] |
Spatial Distribution Score [1] |
Overall Score [1] |
|||
|---|---|---|---|---|---|---|---|---|---|---|---|---|
| Benchmark | [-] | 16.1 | ||||||||||
| h0 | [-] | 29.6 | 27.8 | 16.1 | 1.65 | 0.0623 | 3.41 | 0.471 | 0.425 | 0.448 | ||
| h0a | [-] | 29.6 | 27.8 | 16.1 | 1.65 | 0.0623 | 3.41 | 0.471 | 0.425 | 0.448 |
Download Data |
Period Mean (original grids) [Pg] |
Model Period Mean (intersection) [Pg] |
Benchmark Period Mean (intersection) [Pg] |
Model Period Mean (complement) [Pg] |
Benchmark Period Mean (complement) [Pg] |
Bias [kg m-2] |
Bias Score [1] |
Spatial Distribution Score [1] |
Overall Score [1] |
|||
|---|---|---|---|---|---|---|---|---|---|---|---|---|
| Benchmark | [-] | 24.5 | ||||||||||
| h0 | [-] | 46.1 | 45.9 | 24.3 | 0.420 | 0.162 | 4.49 | 0.368 | 0.686 | 0.527 | ||
| h0a | [-] | 46.1 | 45.9 | 24.3 | 0.420 | 0.162 | 4.49 | 0.368 | 0.686 | 0.527 |
Download Data |
Period Mean (original grids) [Pg] |
Model Period Mean (intersection) [Pg] |
Benchmark Period Mean (intersection) [Pg] |
Model Period Mean (complement) [Pg] |
Benchmark Period Mean (complement) [Pg] |
Bias [kg m-2] |
Bias Score [1] |
Spatial Distribution Score [1] |
Overall Score [1] |
|||
|---|---|---|---|---|---|---|---|---|---|---|---|---|
| Benchmark | [-] | 12.8 | ||||||||||
| h0 | [-] | 5.72 | 5.50 | 12.6 | 0.271 | 0.127 | -1.88 | 0.478 | 0.778 | 0.628 | ||
| h0a | [-] | 5.72 | 5.50 | 12.6 | 0.271 | 0.127 | -1.88 | 0.478 | 0.778 | 0.628 |
Temporally integrated period mean