Mean State
Download Data |
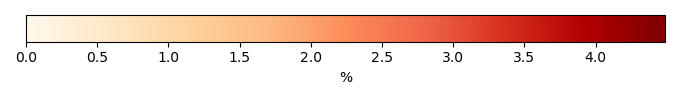
Period Mean (original grids) [%] |
Model Period Mean (intersection) [%] |
Benchmark Period Mean (intersection) [%] |
Model Period Mean (complement) [%] |
Benchmark Period Mean (complement) [%] |
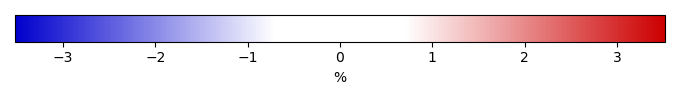
Bias [%] |
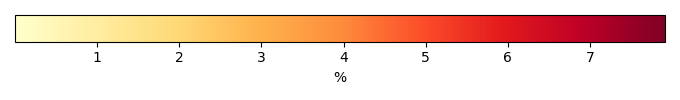
RMSE [%] |
Phase Shift [months] |
Bias Score [1] |
RMSE Score [1] |
Seasonal Cycle Score [1] |
Spatial Distribution Score [1] |
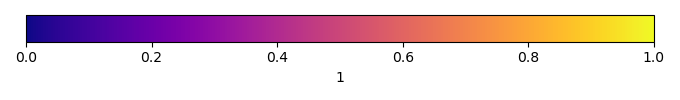
Overall Score [1] |
|||
|---|---|---|---|---|---|---|---|---|---|---|---|---|---|---|---|---|
| Benchmark | [-] | 0.427 | ||||||||||||||
| h0 | [-] | 0.612 | 0.727 | 0.428 | 0.0266 | 0.0158 | 0.265 | 1.22 | 1.95 | 0.548 | 0.367 | 0.712 | 0.755 | 0.550 | ||
| h0a | [-] | 0.612 | 0.727 | 0.428 | 0.0266 | 0.0158 | 0.265 | 1.22 | 1.95 | 0.548 | 0.367 | 0.712 | 0.755 | 0.550 |
Download Data |
Period Mean (original grids) [%] |
Model Period Mean (intersection) [%] |
Benchmark Period Mean (intersection) [%] |
Model Period Mean (complement) [%] |
Benchmark Period Mean (complement) [%] |
Bias [%] |
RMSE [%] |
Phase Shift [months] |
Bias Score [1] |
RMSE Score [1] |
Seasonal Cycle Score [1] |
Spatial Distribution Score [1] |
Overall Score [1] |
|||
|---|---|---|---|---|---|---|---|---|---|---|---|---|---|---|---|---|
| Benchmark | [-] | 1.70 | ||||||||||||||
| h0 | [-] | 2.19 | 2.21 | 1.70 | 0.0848 | 0.0767 | 0.509 | 3.80 | 2.53 | 0.553 | 0.355 | 0.606 | 0.778 | 0.529 | ||
| h0a | [-] | 2.19 | 2.21 | 1.70 | 0.0848 | 0.0767 | 0.509 | 3.80 | 2.53 | 0.553 | 0.355 | 0.606 | 0.778 | 0.529 |
Download Data |
Period Mean (original grids) [%] |
Model Period Mean (intersection) [%] |
Benchmark Period Mean (intersection) [%] |
Model Period Mean (complement) [%] |
Benchmark Period Mean (complement) [%] |
Bias [%] |
RMSE [%] |
Phase Shift [months] |
Bias Score [1] |
RMSE Score [1] |
Seasonal Cycle Score [1] |
Spatial Distribution Score [1] |
Overall Score [1] |
|||
|---|---|---|---|---|---|---|---|---|---|---|---|---|---|---|---|---|
| Benchmark | [-] | 1.53 | ||||||||||||||
| h0 | [-] | 2.79 | 2.87 | 1.54 | 0.391 | 0.0449 | 1.23 | 3.77 | 1.81 | 0.501 | 0.338 | 0.751 | 0.853 | 0.556 | ||
| h0a | [-] | 2.79 | 2.87 | 1.54 | 0.391 | 0.0449 | 1.23 | 3.77 | 1.81 | 0.501 | 0.338 | 0.751 | 0.853 | 0.556 |
Download Data |
Period Mean (original grids) [%] |
Model Period Mean (intersection) [%] |
Benchmark Period Mean (intersection) [%] |
Model Period Mean (complement) [%] |
Benchmark Period Mean (complement) [%] |
Bias [%] |
RMSE [%] |
Phase Shift [months] |
Bias Score [1] |
RMSE Score [1] |
Seasonal Cycle Score [1] |
Spatial Distribution Score [1] |
Overall Score [1] |
|||
|---|---|---|---|---|---|---|---|---|---|---|---|---|---|---|---|---|
| Benchmark | [-] | 0.0179 | ||||||||||||||
| h0 | [-] | 0.0776 | 0.0805 | 0.0179 | 0.00889 | 0.00168 | 0.0577 | 0.163 | 2.13 | 0.651 | 0.392 | 0.673 | 0.310 | 0.483 | ||
| h0a | [-] | 0.0776 | 0.0805 | 0.0179 | 0.00889 | 0.00168 | 0.0577 | 0.163 | 2.13 | 0.651 | 0.392 | 0.673 | 0.310 | 0.483 |
Download Data |
Period Mean (original grids) [%] |
Model Period Mean (intersection) [%] |
Benchmark Period Mean (intersection) [%] |
Model Period Mean (complement) [%] |
Benchmark Period Mean (complement) [%] |
Bias [%] |
RMSE [%] |
Phase Shift [months] |
Bias Score [1] |
RMSE Score [1] |
Seasonal Cycle Score [1] |
Spatial Distribution Score [1] |
Overall Score [1] |
|||
|---|---|---|---|---|---|---|---|---|---|---|---|---|---|---|---|---|
| Benchmark | [-] | 0.0473 | ||||||||||||||
| h0 | [-] | 0.0524 | 0.0482 | 0.0488 | 0.0895 | 0.00859 | 0.0101 | 0.143 | 1.86 | 0.649 | 0.498 | 0.732 | 0.494 | 0.574 | ||
| h0a | [-] | 0.0524 | 0.0482 | 0.0488 | 0.0895 | 0.00859 | 0.0101 | 0.143 | 1.86 | 0.649 | 0.498 | 0.732 | 0.494 | 0.574 |
Download Data |
Period Mean (original grids) [%] |
Model Period Mean (intersection) [%] |
Benchmark Period Mean (intersection) [%] |
Model Period Mean (complement) [%] |
Benchmark Period Mean (complement) [%] |
Bias [%] |
RMSE [%] |
Phase Shift [months] |
Bias Score [1] |
RMSE Score [1] |
Seasonal Cycle Score [1] |
Spatial Distribution Score [1] |
Overall Score [1] |
|||
|---|---|---|---|---|---|---|---|---|---|---|---|---|---|---|---|---|
| Benchmark | [-] | 0.0747 | ||||||||||||||
| h0 | [-] | 0.116 | 0.112 | 0.0748 | 0.0118 | 0.00440 | 0.0368 | 0.244 | 1.34 | 0.622 | 0.463 | 0.825 | 0.648 | 0.604 | ||
| h0a | [-] | 0.116 | 0.112 | 0.0748 | 0.0118 | 0.00440 | 0.0368 | 0.244 | 1.34 | 0.622 | 0.463 | 0.825 | 0.648 | 0.604 |
Download Data |
Period Mean (original grids) [%] |
Model Period Mean (intersection) [%] |
Benchmark Period Mean (intersection) [%] |
Model Period Mean (complement) [%] |
Benchmark Period Mean (complement) [%] |
Bias [%] |
RMSE [%] |
Phase Shift [months] |
Bias Score [1] |
RMSE Score [1] |
Seasonal Cycle Score [1] |
Spatial Distribution Score [1] |
Overall Score [1] |
|||
|---|---|---|---|---|---|---|---|---|---|---|---|---|---|---|---|---|
| Benchmark | [-] | 0.109 | ||||||||||||||
| h0 | [-] | 0.315 | 0.355 | 0.110 | 0.0173 | 0.0267 | 0.237 | 0.547 | 2.35 | 0.521 | 0.311 | 0.625 | 0.405 | 0.435 | ||
| h0a | [-] | 0.315 | 0.355 | 0.110 | 0.0173 | 0.0267 | 0.237 | 0.547 | 2.35 | 0.521 | 0.311 | 0.625 | 0.405 | 0.435 |
Download Data |
Period Mean (original grids) [%] |
Model Period Mean (intersection) [%] |
Benchmark Period Mean (intersection) [%] |
Model Period Mean (complement) [%] |
Benchmark Period Mean (complement) [%] |
Bias [%] |
RMSE [%] |
Phase Shift [months] |
Bias Score [1] |
RMSE Score [1] |
Seasonal Cycle Score [1] |
Spatial Distribution Score [1] |
Overall Score [1] |
|||
|---|---|---|---|---|---|---|---|---|---|---|---|---|---|---|---|---|
| Benchmark | [-] | 0.178 | ||||||||||||||
| h0 | [-] | 0.832 | 0.888 | 0.180 | 0.156 | 0.0122 | 0.656 | 1.39 | 1.67 | 0.307 | 0.178 | 0.775 | 0.319 | 0.352 | ||
| h0a | [-] | 0.832 | 0.888 | 0.180 | 0.156 | 0.0122 | 0.656 | 1.39 | 1.67 | 0.307 | 0.178 | 0.775 | 0.319 | 0.352 |
Download Data |
Period Mean (original grids) [%] |
Model Period Mean (intersection) [%] |
Benchmark Period Mean (intersection) [%] |
Model Period Mean (complement) [%] |
Benchmark Period Mean (complement) [%] |
Bias [%] |
RMSE [%] |
Phase Shift [months] |
Bias Score [1] |
RMSE Score [1] |
Seasonal Cycle Score [1] |
Spatial Distribution Score [1] |
Overall Score [1] |
|||
|---|---|---|---|---|---|---|---|---|---|---|---|---|---|---|---|---|
| Benchmark | [-] | 0.00981 | ||||||||||||||
| h0 | [-] | 0.0483 | 0.0502 | 0.00982 | 0.00212 | 0.00 | 0.0375 | 0.112 | 2.96 | 0.750 | 0.422 | 0.509 | 0.186 | 0.458 | ||
| h0a | [-] | 0.0483 | 0.0502 | 0.00982 | 0.00212 | 0.00 | 0.0375 | 0.112 | 2.96 | 0.750 | 0.422 | 0.509 | 0.186 | 0.458 |
Download Data |
Period Mean (original grids) [%] |
Model Period Mean (intersection) [%] |
Benchmark Period Mean (intersection) [%] |
Model Period Mean (complement) [%] |
Benchmark Period Mean (complement) [%] |
Bias [%] |
RMSE [%] |
Phase Shift [months] |
Bias Score [1] |
RMSE Score [1] |
Seasonal Cycle Score [1] |
Spatial Distribution Score [1] |
Overall Score [1] |
|||
|---|---|---|---|---|---|---|---|---|---|---|---|---|---|---|---|---|
| Benchmark | [-] | 0.535 | ||||||||||||||
| h0 | [-] | 0.677 | 0.691 | 0.538 | 0.202 | 0.139 | 0.116 | 1.14 | 1.67 | 0.602 | 0.507 | 0.772 | 0.793 | 0.636 | ||
| h0a | [-] | 0.677 | 0.691 | 0.538 | 0.202 | 0.139 | 0.116 | 1.14 | 1.67 | 0.602 | 0.507 | 0.772 | 0.793 | 0.636 |
Download Data |
Period Mean (original grids) [%] |
Model Period Mean (intersection) [%] |
Benchmark Period Mean (intersection) [%] |
Model Period Mean (complement) [%] |
Benchmark Period Mean (complement) [%] |
Bias [%] |
RMSE [%] |
Phase Shift [months] |
Bias Score [1] |
RMSE Score [1] |
Seasonal Cycle Score [1] |
Spatial Distribution Score [1] |
Overall Score [1] |
|||
|---|---|---|---|---|---|---|---|---|---|---|---|---|---|---|---|---|
| Benchmark | [-] | 0.0207 | ||||||||||||||
| h0 | [-] | 0.138 | 0.141 | 0.0208 | 0.0434 | 0.00632 | 0.110 | 0.233 | 2.27 | 0.382 | 0.181 | 0.649 | 0.0989 | 0.298 | ||
| h0a | [-] | 0.138 | 0.141 | 0.0208 | 0.0434 | 0.00632 | 0.110 | 0.233 | 2.27 | 0.382 | 0.181 | 0.649 | 0.0989 | 0.298 |
Download Data |
Period Mean (original grids) [%] |
Model Period Mean (intersection) [%] |
Benchmark Period Mean (intersection) [%] |
Model Period Mean (complement) [%] |
Benchmark Period Mean (complement) [%] |
Bias [%] |
RMSE [%] |
Phase Shift [months] |
Bias Score [1] |
RMSE Score [1] |
Seasonal Cycle Score [1] |
Spatial Distribution Score [1] |
Overall Score [1] |
|||
|---|---|---|---|---|---|---|---|---|---|---|---|---|---|---|---|---|
| Benchmark | [-] | 0.317 | ||||||||||||||
| h0 | [-] | 0.576 | 0.662 | 0.319 | 0.0224 | 0.0255 | 0.313 | 0.974 | 2.09 | 0.533 | 0.359 | 0.684 | 0.759 | 0.539 | ||
| h0a | [-] | 0.576 | 0.662 | 0.319 | 0.0224 | 0.0255 | 0.313 | 0.974 | 2.09 | 0.533 | 0.359 | 0.684 | 0.759 | 0.539 |
Download Data |
Period Mean (original grids) [%] |
Model Period Mean (intersection) [%] |
Benchmark Period Mean (intersection) [%] |
Model Period Mean (complement) [%] |
Benchmark Period Mean (complement) [%] |
Bias [%] |
RMSE [%] |
Phase Shift [months] |
Bias Score [1] |
RMSE Score [1] |
Seasonal Cycle Score [1] |
Spatial Distribution Score [1] |
Overall Score [1] |
|||
|---|---|---|---|---|---|---|---|---|---|---|---|---|---|---|---|---|
| Benchmark | [-] | 0.0188 | ||||||||||||||
| h0 | [-] | 0.0597 | 0.168 | 0.0188 | 0.00290 | 0.0131 | 0.151 | 0.269 | 2.62 | 0.552 | 0.434 | 0.581 | 0.104 | 0.421 | ||
| h0a | [-] | 0.0597 | 0.168 | 0.0188 | 0.00290 | 0.0131 | 0.151 | 0.269 | 2.62 | 0.552 | 0.434 | 0.581 | 0.104 | 0.421 |
Download Data |
Period Mean (original grids) [%] |
Model Period Mean (intersection) [%] |
Benchmark Period Mean (intersection) [%] |
Model Period Mean (complement) [%] |
Benchmark Period Mean (complement) [%] |
Bias [%] |
RMSE [%] |
Phase Shift [months] |
Bias Score [1] |
RMSE Score [1] |
Seasonal Cycle Score [1] |
Spatial Distribution Score [1] |
Overall Score [1] |
|||
|---|---|---|---|---|---|---|---|---|---|---|---|---|---|---|---|---|
| Benchmark | [-] | 0.0145 | ||||||||||||||
| h0 | [-] | 0.0196 | 0.0216 | 0.0145 | 0.000711 | 0.000137 | 0.00549 | 0.0589 | 3.53 | 0.875 | 0.559 | 0.396 | 0.621 | 0.602 | ||
| h0a | [-] | 0.0196 | 0.0216 | 0.0145 | 0.000711 | 0.000137 | 0.00549 | 0.0589 | 3.53 | 0.875 | 0.559 | 0.396 | 0.621 | 0.602 |
Download Data |
Period Mean (original grids) [%] |
Model Period Mean (intersection) [%] |
Benchmark Period Mean (intersection) [%] |
Model Period Mean (complement) [%] |
Benchmark Period Mean (complement) [%] |
Bias [%] |
RMSE [%] |
Phase Shift [months] |
Bias Score [1] |
RMSE Score [1] |
Seasonal Cycle Score [1] |
Spatial Distribution Score [1] |
Overall Score [1] |
|||
|---|---|---|---|---|---|---|---|---|---|---|---|---|---|---|---|---|
| Benchmark | [-] | 0.0817 | ||||||||||||||
| h0 | [-] | 0.800 | 0.849 | 0.0830 | 0.211 | 0.0160 | 0.653 | 0.975 | 1.69 | 0.351 | 0.265 | 0.760 | 0.0375 | 0.336 | ||
| h0a | [-] | 0.800 | 0.849 | 0.0830 | 0.211 | 0.0160 | 0.653 | 0.975 | 1.69 | 0.351 | 0.265 | 0.760 | 0.0375 | 0.336 |
Download Data |
Period Mean (original grids) [%] |
Model Period Mean (intersection) [%] |
Benchmark Period Mean (intersection) [%] |
Model Period Mean (complement) [%] |
Benchmark Period Mean (complement) [%] |
Bias [%] |
RMSE [%] |
Phase Shift [months] |
Bias Score [1] |
RMSE Score [1] |
Seasonal Cycle Score [1] |
Spatial Distribution Score [1] |
Overall Score [1] |
|||
|---|---|---|---|---|---|---|---|---|---|---|---|---|---|---|---|---|
| Benchmark | [-] | 0.0303 | ||||||||||||||
| h0 | [-] | 0.137 | 0.128 | 0.0304 | 0.0778 | 0.0113 | 0.0944 | 0.214 | 2.95 | 0.477 | 0.296 | 0.515 | 0.123 | 0.341 | ||
| h0a | [-] | 0.137 | 0.128 | 0.0304 | 0.0778 | 0.0113 | 0.0944 | 0.214 | 2.95 | 0.477 | 0.296 | 0.515 | 0.123 | 0.341 |
Download Data |
Period Mean (original grids) [%] |
Model Period Mean (intersection) [%] |
Benchmark Period Mean (intersection) [%] |
Model Period Mean (complement) [%] |
Benchmark Period Mean (complement) [%] |
Bias [%] |
RMSE [%] |
Phase Shift [months] |
Bias Score [1] |
RMSE Score [1] |
Seasonal Cycle Score [1] |
Spatial Distribution Score [1] |
Overall Score [1] |
|||
|---|---|---|---|---|---|---|---|---|---|---|---|---|---|---|---|---|
| Benchmark | [-] | 0.0265 | ||||||||||||||
| h0 | [-] | 0.0985 | 0.101 | 0.0265 | 0.0114 | 8.47e-05 | 0.0738 | 0.192 | 2.23 | 0.566 | 0.385 | 0.662 | 0.124 | 0.425 | ||
| h0a | [-] | 0.0985 | 0.101 | 0.0265 | 0.0114 | 8.47e-05 | 0.0738 | 0.192 | 2.23 | 0.566 | 0.385 | 0.662 | 0.124 | 0.425 |
Download Data |
Period Mean (original grids) [%] |
Model Period Mean (intersection) [%] |
Benchmark Period Mean (intersection) [%] |
Model Period Mean (complement) [%] |
Benchmark Period Mean (complement) [%] |
Bias [%] |
RMSE [%] |
Phase Shift [months] |
Bias Score [1] |
RMSE Score [1] |
Seasonal Cycle Score [1] |
Spatial Distribution Score [1] |
Overall Score [1] |
|||
|---|---|---|---|---|---|---|---|---|---|---|---|---|---|---|---|---|
| Benchmark | [-] | 0.0301 | ||||||||||||||
| h0 | [-] | 0.374 | 0.385 | 0.0301 | 0.0204 | 0.0324 | 0.351 | 0.583 | 1.77 | 0.307 | 0.247 | 0.739 | 0.0477 | 0.318 | ||
| h0a | [-] | 0.374 | 0.385 | 0.0301 | 0.0204 | 0.0324 | 0.351 | 0.583 | 1.77 | 0.307 | 0.247 | 0.739 | 0.0477 | 0.318 |
Download Data |
Period Mean (original grids) [%] |
Model Period Mean (intersection) [%] |
Benchmark Period Mean (intersection) [%] |
Model Period Mean (complement) [%] |
Benchmark Period Mean (complement) [%] |
Bias [%] |
RMSE [%] |
Phase Shift [months] |
Bias Score [1] |
RMSE Score [1] |
Seasonal Cycle Score [1] |
Spatial Distribution Score [1] |
Overall Score [1] |
|||
|---|---|---|---|---|---|---|---|---|---|---|---|---|---|---|---|---|
| Benchmark | [-] | 0.125 | ||||||||||||||
| h0 | [-] | 0.205 | 0.210 | 0.125 | 0.120 | 0.0256 | 0.0855 | 0.365 | 1.42 | 0.532 | 0.383 | 0.804 | 0.407 | 0.502 | ||
| h0a | [-] | 0.205 | 0.210 | 0.125 | 0.120 | 0.0256 | 0.0855 | 0.365 | 1.42 | 0.532 | 0.383 | 0.804 | 0.407 | 0.502 |
Download Data |
Period Mean (original grids) [%] |
Model Period Mean (intersection) [%] |
Benchmark Period Mean (intersection) [%] |
Model Period Mean (complement) [%] |
Benchmark Period Mean (complement) [%] |
Bias [%] |
RMSE [%] |
Phase Shift [months] |
Bias Score [1] |
RMSE Score [1] |
Seasonal Cycle Score [1] |
Spatial Distribution Score [1] |
Overall Score [1] |
|||
|---|---|---|---|---|---|---|---|---|---|---|---|---|---|---|---|---|
| Benchmark | [-] | 0.217 | ||||||||||||||
| h0 | [-] | 1.09 | 1.09 | 0.217 | 0.165 | 0.0214 | 0.845 | 1.29 | 1.70 | 0.390 | 0.331 | 0.755 | 0.164 | 0.394 | ||
| h0a | [-] | 1.09 | 1.09 | 0.217 | 0.165 | 0.0214 | 0.845 | 1.29 | 1.70 | 0.390 | 0.331 | 0.755 | 0.164 | 0.394 |
Download Data |
Period Mean (original grids) [%] |
Model Period Mean (intersection) [%] |
Benchmark Period Mean (intersection) [%] |
Model Period Mean (complement) [%] |
Benchmark Period Mean (complement) [%] |
Bias [%] |
RMSE [%] |
Phase Shift [months] |
Bias Score [1] |
RMSE Score [1] |
Seasonal Cycle Score [1] |
Spatial Distribution Score [1] |
Overall Score [1] |
|||
|---|---|---|---|---|---|---|---|---|---|---|---|---|---|---|---|---|
| Benchmark | [-] | 0.0291 | ||||||||||||||
| h0 | [-] | 0.265 | 0.252 | 0.0292 | 0.0395 | 0.00379 | 0.209 | 0.300 | 1.80 | 0.516 | 0.384 | 0.732 | 0.0777 | 0.419 | ||
| h0a | [-] | 0.265 | 0.252 | 0.0292 | 0.0395 | 0.00379 | 0.209 | 0.300 | 1.80 | 0.516 | 0.384 | 0.732 | 0.0777 | 0.419 |
Temporally integrated period mean