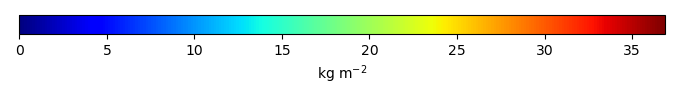
Mean State
Download Data |
Period Mean (original grids) [Pg] |
Model Period Mean (intersection) [Pg] |
Benchmark Period Mean (intersection) [Pg] |
Model Period Mean (complement) [Pg] |
Benchmark Period Mean (complement) [Pg] |
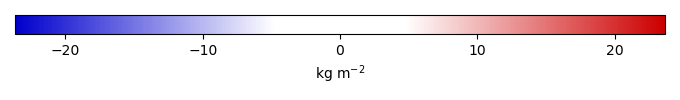
Bias [kg m-2] |
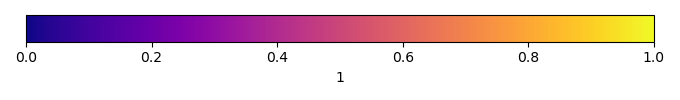
Bias Score [1] |
Spatial Distribution Score [1] |
Overall Score [1] |
|||
|---|---|---|---|---|---|---|---|---|---|---|---|---|
| Benchmark | [-] | 34.1 | ||||||||||
| h0 | [-] | 33.6 | 34.2 | 34.0 | 0.223 | 0.149 | 0.417 | 0.673 | 0.921 | 0.797 | ||
| h0a | [-] | 33.6 | 34.2 | 34.0 | 0.223 | 0.149 | 0.417 | 0.673 | 0.921 | 0.797 |
Download Data |
Period Mean (original grids) [Pg] |
Model Period Mean (intersection) [Pg] |
Benchmark Period Mean (intersection) [Pg] |
Model Period Mean (complement) [Pg] |
Benchmark Period Mean (complement) [Pg] |
Bias [kg m-2] |
Bias Score [1] |
Spatial Distribution Score [1] |
Overall Score [1] |
|||
|---|---|---|---|---|---|---|---|---|---|---|---|---|
| Benchmark | [-] | 44.8 | ||||||||||
| h0 | [-] | 15.2 | 14.4 | 44.6 | 0.0325 | 0.199 | -4.39 | 0.502 | 0.811 | 0.657 | ||
| h0a | [-] | 15.2 | 14.4 | 44.6 | 0.0325 | 0.199 | -4.39 | 0.502 | 0.811 | 0.657 |
Download Data |
Period Mean (original grids) [Pg] |
Model Period Mean (intersection) [Pg] |
Benchmark Period Mean (intersection) [Pg] |
Model Period Mean (complement) [Pg] |
Benchmark Period Mean (complement) [Pg] |
Bias [kg m-2] |
Bias Score [1] |
Spatial Distribution Score [1] |
Overall Score [1] |
|||
|---|---|---|---|---|---|---|---|---|---|---|---|---|
| Benchmark | [-] | 60.1 | ||||||||||
| h0 | [-] | 30.1 | 29.1 | 59.7 | 0.744 | 0.405 | -2.81 | 0.546 | 0.793 | 0.669 | ||
| h0a | [-] | 30.1 | 29.1 | 59.7 | 0.744 | 0.405 | -2.81 | 0.546 | 0.793 | 0.669 |
Download Data |
Period Mean (original grids) [Pg] |
Model Period Mean (intersection) [Pg] |
Benchmark Period Mean (intersection) [Pg] |
Model Period Mean (complement) [Pg] |
Benchmark Period Mean (complement) [Pg] |
Bias [kg m-2] |
Bias Score [1] |
Spatial Distribution Score [1] |
Overall Score [1] |
|||
|---|---|---|---|---|---|---|---|---|---|---|---|---|
| Benchmark | [-] | 11.1 | ||||||||||
| h0 | [-] | 40.0 | 3.00 | 10.5 | 37.2 | 0.585 | -9.00 | 0.479 | 0.766 | 0.622 | ||
| h0a | [-] | 40.0 | 3.00 | 10.5 | 37.2 | 0.585 | -9.00 | 0.479 | 0.766 | 0.622 |
Download Data |
Period Mean (original grids) [Pg] |
Model Period Mean (intersection) [Pg] |
Benchmark Period Mean (intersection) [Pg] |
Model Period Mean (complement) [Pg] |
Benchmark Period Mean (complement) [Pg] |
Bias [kg m-2] |
Bias Score [1] |
Spatial Distribution Score [1] |
Overall Score [1] |
|||
|---|---|---|---|---|---|---|---|---|---|---|---|---|
| Benchmark | [-] | 55.7 | ||||||||||
| h0 | [-] | 22.1 | 20.7 | 53.4 | 1.19 | 2.31 | -5.93 | 0.690 | 0.493 | 0.592 | ||
| h0a | [-] | 22.1 | 20.7 | 53.4 | 1.19 | 2.31 | -5.93 | 0.690 | 0.493 | 0.592 |
Download Data |
Period Mean (original grids) [Pg] |
Model Period Mean (intersection) [Pg] |
Benchmark Period Mean (intersection) [Pg] |
Model Period Mean (complement) [Pg] |
Benchmark Period Mean (complement) [Pg] |
Bias [kg m-2] |
Bias Score [1] |
Spatial Distribution Score [1] |
Overall Score [1] |
|||
|---|---|---|---|---|---|---|---|---|---|---|---|---|
| Benchmark | [-] | 65.6 | ||||||||||
| h0 | [-] | 132. | 43.1 | 65.3 | 85.8 | 0.296 | -4.89 | 0.667 | 0.759 | 0.713 | ||
| h0a | [-] | 132. | 43.1 | 65.3 | 85.8 | 0.296 | -4.89 | 0.667 | 0.759 | 0.713 |
Download Data |
Period Mean (original grids) [Pg] |
Model Period Mean (intersection) [Pg] |
Benchmark Period Mean (intersection) [Pg] |
Model Period Mean (complement) [Pg] |
Benchmark Period Mean (complement) [Pg] |
Bias [kg m-2] |
Bias Score [1] |
Spatial Distribution Score [1] |
Overall Score [1] |
|||
|---|---|---|---|---|---|---|---|---|---|---|---|---|
| Benchmark | [-] | 143. | ||||||||||
| h0 | [-] | 115. | 102. | 142. | 16.0 | 1.13 | -2.00 | 0.609 | 0.814 | 0.711 | ||
| h0a | [-] | 115. | 102. | 142. | 16.0 | 1.13 | -2.00 | 0.609 | 0.814 | 0.711 |
Download Data |
Period Mean (original grids) [Pg] |
Model Period Mean (intersection) [Pg] |
Benchmark Period Mean (intersection) [Pg] |
Model Period Mean (complement) [Pg] |
Benchmark Period Mean (complement) [Pg] |
Bias [kg m-2] |
Bias Score [1] |
Spatial Distribution Score [1] |
Overall Score [1] |
|||
|---|---|---|---|---|---|---|---|---|---|---|---|---|
| Benchmark | [-] | 58.4 | ||||||||||
| h0 | [-] | 39.6 | 37.8 | 57.4 | 0.700 | 0.993 | -1.79 | 0.677 | 0.830 | 0.753 | ||
| h0a | [-] | 39.6 | 37.8 | 57.4 | 0.700 | 0.993 | -1.79 | 0.677 | 0.830 | 0.753 |
Download Data |
Period Mean (original grids) [Pg] |
Model Period Mean (intersection) [Pg] |
Benchmark Period Mean (intersection) [Pg] |
Model Period Mean (complement) [Pg] |
Benchmark Period Mean (complement) [Pg] |
Bias [kg m-2] |
Bias Score [1] |
Spatial Distribution Score [1] |
Overall Score [1] |
|||
|---|---|---|---|---|---|---|---|---|---|---|---|---|
| Benchmark | [-] | 7.78 | ||||||||||
| h0 | [-] | 73.8 | 4.53 | 7.45 | 70.1 | 0.328 | 1.52 | 0.440 | 0.558 | 0.499 | ||
| h0a | [-] | 73.8 | 4.53 | 7.45 | 70.1 | 0.328 | 1.52 | 0.440 | 0.558 | 0.499 |
Download Data |
Period Mean (original grids) [Pg] |
Model Period Mean (intersection) [Pg] |
Benchmark Period Mean (intersection) [Pg] |
Model Period Mean (complement) [Pg] |
Benchmark Period Mean (complement) [Pg] |
Bias [kg m-2] |
Bias Score [1] |
Spatial Distribution Score [1] |
Overall Score [1] |
|||
|---|---|---|---|---|---|---|---|---|---|---|---|---|
| Benchmark | [-] | 58.9 | ||||||||||
| h0 | [-] | 36.0 | 34.8 | 58.0 | 1.09 | 0.888 | -1.84 | 0.564 | 0.438 | 0.501 | ||
| h0a | [-] | 36.0 | 34.8 | 58.0 | 1.09 | 0.888 | -1.84 | 0.564 | 0.438 | 0.501 |
Download Data |
Period Mean (original grids) [Pg] |
Model Period Mean (intersection) [Pg] |
Benchmark Period Mean (intersection) [Pg] |
Model Period Mean (complement) [Pg] |
Benchmark Period Mean (complement) [Pg] |
Bias [kg m-2] |
Bias Score [1] |
Spatial Distribution Score [1] |
Overall Score [1] |
|||
|---|---|---|---|---|---|---|---|---|---|---|---|---|
| Benchmark | [-] | 61.8 | ||||||||||
| h0 | [-] | 38.7 | 35.2 | 61.1 | 2.98 | 0.626 | -3.37 | 0.661 | 0.699 | 0.680 | ||
| h0a | [-] | 38.7 | 35.2 | 61.1 | 2.98 | 0.626 | -3.37 | 0.661 | 0.699 | 0.680 |
Download Data |
Period Mean (original grids) [Pg] |
Model Period Mean (intersection) [Pg] |
Benchmark Period Mean (intersection) [Pg] |
Model Period Mean (complement) [Pg] |
Benchmark Period Mean (complement) [Pg] |
Bias [kg m-2] |
Bias Score [1] |
Spatial Distribution Score [1] |
Overall Score [1] |
|||
|---|---|---|---|---|---|---|---|---|---|---|---|---|
| Benchmark | [-] | 1.05e+03 | ||||||||||
| h0 | [-] | 968. | 637. | 1.03e+03 | 329. | 13.7 | -2.65 | 0.590 | 0.858 | 0.724 | ||
| h0a | [-] | 968. | 637. | 1.03e+03 | 329. | 13.7 | -2.65 | 0.590 | 0.858 | 0.724 |
Download Data |
Period Mean (original grids) [Pg] |
Model Period Mean (intersection) [Pg] |
Benchmark Period Mean (intersection) [Pg] |
Model Period Mean (complement) [Pg] |
Benchmark Period Mean (complement) [Pg] |
Bias [kg m-2] |
Bias Score [1] |
Spatial Distribution Score [1] |
Overall Score [1] |
|||
|---|---|---|---|---|---|---|---|---|---|---|---|---|
| Benchmark | [-] | 64.3 | ||||||||||
| h0 | [-] | 24.0 | 23.8 | 63.8 | 0.484 | 0.478 | -2.23 | 0.442 | 0.497 | 0.469 | ||
| h0a | [-] | 24.0 | 23.8 | 63.8 | 0.484 | 0.478 | -2.23 | 0.442 | 0.497 | 0.469 |
Download Data |
Period Mean (original grids) [Pg] |
Model Period Mean (intersection) [Pg] |
Benchmark Period Mean (intersection) [Pg] |
Model Period Mean (complement) [Pg] |
Benchmark Period Mean (complement) [Pg] |
Bias [kg m-2] |
Bias Score [1] |
Spatial Distribution Score [1] |
Overall Score [1] |
|||
|---|---|---|---|---|---|---|---|---|---|---|---|---|
| Benchmark | [-] | 13.3 | ||||||||||
| h0 | [-] | 82.9 | 3.65 | 12.2 | 78.1 | 1.06 | -4.16 | 0.446 | 0.769 | 0.608 | ||
| h0a | [-] | 82.9 | 3.65 | 12.2 | 78.1 | 1.06 | -4.16 | 0.446 | 0.769 | 0.608 |
Download Data |
Period Mean (original grids) [Pg] |
Model Period Mean (intersection) [Pg] |
Benchmark Period Mean (intersection) [Pg] |
Model Period Mean (complement) [Pg] |
Benchmark Period Mean (complement) [Pg] |
Bias [kg m-2] |
Bias Score [1] |
Spatial Distribution Score [1] |
Overall Score [1] |
|||
|---|---|---|---|---|---|---|---|---|---|---|---|---|
| Benchmark | [-] | 42.5 | ||||||||||
| h0 | [-] | 19.0 | 17.7 | 41.2 | 0.855 | 1.34 | -4.96 | 0.593 | 0.761 | 0.677 | ||
| h0a | [-] | 19.0 | 17.7 | 41.2 | 0.855 | 1.34 | -4.96 | 0.593 | 0.761 | 0.677 |
Download Data |
Period Mean (original grids) [Pg] |
Model Period Mean (intersection) [Pg] |
Benchmark Period Mean (intersection) [Pg] |
Model Period Mean (complement) [Pg] |
Benchmark Period Mean (complement) [Pg] |
Bias [kg m-2] |
Bias Score [1] |
Spatial Distribution Score [1] |
Overall Score [1] |
|||
|---|---|---|---|---|---|---|---|---|---|---|---|---|
| Benchmark | [-] | 45.3 | ||||||||||
| h0 | [-] | 29.2 | 28.4 | 44.9 | 0.270 | 0.439 | -3.71 | 0.731 | 0.542 | 0.637 | ||
| h0a | [-] | 29.2 | 28.4 | 44.9 | 0.270 | 0.439 | -3.71 | 0.731 | 0.542 | 0.637 |
Download Data |
Period Mean (original grids) [Pg] |
Model Period Mean (intersection) [Pg] |
Benchmark Period Mean (intersection) [Pg] |
Model Period Mean (complement) [Pg] |
Benchmark Period Mean (complement) [Pg] |
Bias [kg m-2] |
Bias Score [1] |
Spatial Distribution Score [1] |
Overall Score [1] |
|||
|---|---|---|---|---|---|---|---|---|---|---|---|---|
| Benchmark | [-] | 51.3 | ||||||||||
| h0 | [-] | 63.1 | 32.6 | 50.6 | 31.7 | 0.713 | -4.94 | 0.645 | 0.815 | 0.730 | ||
| h0a | [-] | 63.1 | 32.6 | 50.6 | 31.7 | 0.713 | -4.94 | 0.645 | 0.815 | 0.730 |
Download Data |
Period Mean (original grids) [Pg] |
Model Period Mean (intersection) [Pg] |
Benchmark Period Mean (intersection) [Pg] |
Model Period Mean (complement) [Pg] |
Benchmark Period Mean (complement) [Pg] |
Bias [kg m-2] |
Bias Score [1] |
Spatial Distribution Score [1] |
Overall Score [1] |
|||
|---|---|---|---|---|---|---|---|---|---|---|---|---|
| Benchmark | [-] | 34.3 | ||||||||||
| h0 | [-] | 13.6 | 13.7 | 34.0 | 0.522 | 0.239 | -4.93 | 0.520 | 0.785 | 0.653 | ||
| h0a | [-] | 13.6 | 13.7 | 34.0 | 0.522 | 0.239 | -4.93 | 0.520 | 0.785 | 0.653 |
Download Data |
Period Mean (original grids) [Pg] |
Model Period Mean (intersection) [Pg] |
Benchmark Period Mean (intersection) [Pg] |
Model Period Mean (complement) [Pg] |
Benchmark Period Mean (complement) [Pg] |
Bias [kg m-2] |
Bias Score [1] |
Spatial Distribution Score [1] |
Overall Score [1] |
|||
|---|---|---|---|---|---|---|---|---|---|---|---|---|
| Benchmark | [-] | 101. | ||||||||||
| h0 | [-] | 74.6 | 73.9 | 100. | 0.402 | 0.498 | -2.71 | 0.730 | 0.470 | 0.600 | ||
| h0a | [-] | 74.6 | 73.9 | 100. | 0.402 | 0.498 | -2.71 | 0.730 | 0.470 | 0.600 |
Download Data |
Period Mean (original grids) [Pg] |
Model Period Mean (intersection) [Pg] |
Benchmark Period Mean (intersection) [Pg] |
Model Period Mean (complement) [Pg] |
Benchmark Period Mean (complement) [Pg] |
Bias [kg m-2] |
Bias Score [1] |
Spatial Distribution Score [1] |
Overall Score [1] |
|||
|---|---|---|---|---|---|---|---|---|---|---|---|---|
| Benchmark | [-] | 60.7 | ||||||||||
| h0 | [-] | 63.8 | 64.2 | 60.5 | 0.534 | 0.241 | 0.972 | 0.598 | 0.911 | 0.754 | ||
| h0a | [-] | 63.8 | 64.2 | 60.5 | 0.534 | 0.241 | 0.972 | 0.598 | 0.911 | 0.754 |
Download Data |
Period Mean (original grids) [Pg] |
Model Period Mean (intersection) [Pg] |
Benchmark Period Mean (intersection) [Pg] |
Model Period Mean (complement) [Pg] |
Benchmark Period Mean (complement) [Pg] |
Bias [kg m-2] |
Bias Score [1] |
Spatial Distribution Score [1] |
Overall Score [1] |
|||
|---|---|---|---|---|---|---|---|---|---|---|---|---|
| Benchmark | [-] | 29.6 | ||||||||||
| h0 | [-] | 20.4 | 19.4 | 28.9 | 0.302 | 0.713 | -2.07 | 0.527 | 0.706 | 0.616 | ||
| h0a | [-] | 20.4 | 19.4 | 28.9 | 0.302 | 0.713 | -2.07 | 0.527 | 0.706 | 0.616 |
Temporally integrated period mean