Mean State
Download Data |
Period Mean (original grids) [Pg] |
Model Period Mean (intersection) [Pg] |
Benchmark Period Mean (intersection) [Pg] |
Model Period Mean (complement) [Pg] |
Benchmark Period Mean (complement) [Pg] |
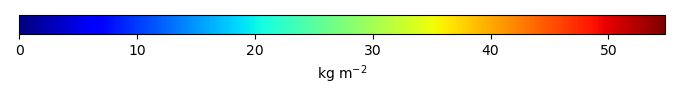
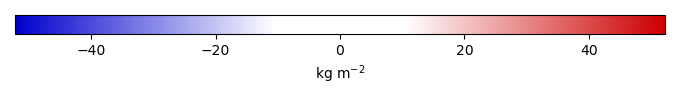
Bias [kg m-2] |
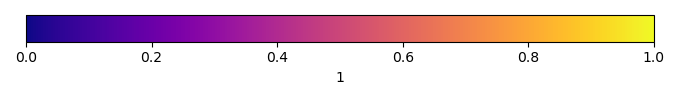
Bias Score [1] |
Spatial Distribution Score [1] |
Overall Score [1] |
|||
|---|---|---|---|---|---|---|---|---|---|---|---|---|
| Benchmark | [-] | 76.5 | ||||||||||
| h0 | [-] | 40.0 | 36.8 | 76.1 | 3.39 | 0.322 | -13.1 | 0.546 | 0.835 | 0.690 | ||
| h0a | [-] | 40.0 | 36.8 | 76.1 | 3.39 | 0.322 | -13.1 | 0.546 | 0.835 | 0.690 |
Download Data |
Period Mean (original grids) [Pg] |
Model Period Mean (intersection) [Pg] |
Benchmark Period Mean (intersection) [Pg] |
Model Period Mean (complement) [Pg] |
Benchmark Period Mean (complement) [Pg] |
Bias [kg m-2] |
Bias Score [1] |
Spatial Distribution Score [1] |
Overall Score [1] |
|||
|---|---|---|---|---|---|---|---|---|---|---|---|---|
| Benchmark | [-] | 113. | ||||||||||
| h0 | [-] | 132. | 85.6 | 113. | 43.2 | 0.0550 | -5.70 | 0.641 | 0.809 | 0.725 | ||
| h0a | [-] | 132. | 85.6 | 113. | 43.2 | 0.0550 | -5.70 | 0.641 | 0.809 | 0.725 |
Download Data |
Period Mean (original grids) [Pg] |
Model Period Mean (intersection) [Pg] |
Benchmark Period Mean (intersection) [Pg] |
Model Period Mean (complement) [Pg] |
Benchmark Period Mean (complement) [Pg] |
Bias [kg m-2] |
Bias Score [1] |
Spatial Distribution Score [1] |
Overall Score [1] |
|||
|---|---|---|---|---|---|---|---|---|---|---|---|---|
| Benchmark | [-] | 12.2 | ||||||||||
| h0 | [-] | 115. | 15.5 | 12.2 | 103. | 3.05 | 0.570 | 0.426 | 0.498 | |||
| h0a | [-] | 115. | 15.5 | 12.2 | 103. | 3.05 | 0.570 | 0.426 | 0.498 |
Download Data |
Period Mean (original grids) [Pg] |
Model Period Mean (intersection) [Pg] |
Benchmark Period Mean (intersection) [Pg] |
Model Period Mean (complement) [Pg] |
Benchmark Period Mean (complement) [Pg] |
Bias [kg m-2] |
Bias Score [1] |
Spatial Distribution Score [1] |
Overall Score [1] |
|||
|---|---|---|---|---|---|---|---|---|---|---|---|---|
| Benchmark | [-] | 97.3 | ||||||||||
| h0 | [-] | 73.8 | 69.7 | 97.2 | 4.92 | 0.101 | -8.15 | 0.611 | 0.793 | 0.702 | ||
| h0a | [-] | 73.8 | 69.7 | 97.2 | 4.92 | 0.101 | -8.15 | 0.611 | 0.793 | 0.702 |
Download Data |
Period Mean (original grids) [Pg] |
Model Period Mean (intersection) [Pg] |
Benchmark Period Mean (intersection) [Pg] |
Model Period Mean (complement) [Pg] |
Benchmark Period Mean (complement) [Pg] |
Bias [kg m-2] |
Bias Score [1] |
Spatial Distribution Score [1] |
Overall Score [1] |
|||
|---|---|---|---|---|---|---|---|---|---|---|---|---|
| Benchmark | [-] | 5.12 | ||||||||||
| h0 | [-] | 38.7 | 2.41 | 5.12 | 35.8 | -10.1 | 0.548 | 0.479 | 0.514 | |||
| h0a | [-] | 38.7 | 2.41 | 5.12 | 35.8 | -10.1 | 0.548 | 0.479 | 0.514 |
Download Data |
Period Mean (original grids) [Pg] |
Model Period Mean (intersection) [Pg] |
Benchmark Period Mean (intersection) [Pg] |
Model Period Mean (complement) [Pg] |
Benchmark Period Mean (complement) [Pg] |
Bias [kg m-2] |
Bias Score [1] |
Spatial Distribution Score [1] |
Overall Score [1] |
|||
|---|---|---|---|---|---|---|---|---|---|---|---|---|
| Benchmark | [-] | 473. | ||||||||||
| h0 | [-] | 968. | 320. | 472. | 646. | 0.797 | -6.44 | 0.582 | 0.831 | 0.707 | ||
| h0a | [-] | 968. | 320. | 472. | 646. | 0.797 | -6.44 | 0.582 | 0.831 | 0.707 |
Download Data |
Period Mean (original grids) [Pg] |
Model Period Mean (intersection) [Pg] |
Benchmark Period Mean (intersection) [Pg] |
Model Period Mean (complement) [Pg] |
Benchmark Period Mean (complement) [Pg] |
Bias [kg m-2] |
Bias Score [1] |
Spatial Distribution Score [1] |
Overall Score [1] |
|||
|---|---|---|---|---|---|---|---|---|---|---|---|---|
| Benchmark | [-] | 116. | ||||||||||
| h0 | [-] | 82.9 | 77.7 | 116. | 4.02 | 0.294 | -5.70 | 0.464 | 0.711 | 0.587 | ||
| h0a | [-] | 82.9 | 77.7 | 116. | 4.02 | 0.294 | -5.70 | 0.464 | 0.711 | 0.587 |
Download Data |
Period Mean (original grids) [Pg] |
Model Period Mean (intersection) [Pg] |
Benchmark Period Mean (intersection) [Pg] |
Model Period Mean (complement) [Pg] |
Benchmark Period Mean (complement) [Pg] |
Bias [kg m-2] |
Bias Score [1] |
Spatial Distribution Score [1] |
Overall Score [1] |
|||
|---|---|---|---|---|---|---|---|---|---|---|---|---|
| Benchmark | [-] | 0.0131 | ||||||||||
| h0 | [-] | 29.2 | 0.0115 | 0.0131 | 28.7 | -0.678 | 0.892 | 8.43e-23 | 0.446 | |||
| h0a | [-] | 29.2 | 0.0115 | 0.0131 | 28.7 | -0.678 | 0.892 | 8.43e-23 | 0.446 |
Download Data |
Period Mean (original grids) [Pg] |
Model Period Mean (intersection) [Pg] |
Benchmark Period Mean (intersection) [Pg] |
Model Period Mean (complement) [Pg] |
Benchmark Period Mean (complement) [Pg] |
Bias [kg m-2] |
Bias Score [1] |
Spatial Distribution Score [1] |
Overall Score [1] |
|||
|---|---|---|---|---|---|---|---|---|---|---|---|---|
| Benchmark | [-] | 46.1 | ||||||||||
| h0 | [-] | 63.1 | 31.6 | 46.1 | 32.7 | 0.00820 | -7.01 | 0.558 | 0.635 | 0.596 | ||
| h0a | [-] | 63.1 | 31.6 | 46.1 | 32.7 | 0.00820 | -7.01 | 0.558 | 0.635 | 0.596 |
Download Data |
Period Mean (original grids) [Pg] |
Model Period Mean (intersection) [Pg] |
Benchmark Period Mean (intersection) [Pg] |
Model Period Mean (complement) [Pg] |
Benchmark Period Mean (complement) [Pg] |
Bias [kg m-2] |
Bias Score [1] |
Spatial Distribution Score [1] |
Overall Score [1] |
|||
|---|---|---|---|---|---|---|---|---|---|---|---|---|
| Benchmark | [-] | 0.232 | ||||||||||
| h0 | [-] | 13.6 | 0.413 | 0.232 | 13.8 | 2.37 | 0.353 | 0.744 | 0.549 | |||
| h0a | [-] | 13.6 | 0.413 | 0.232 | 13.8 | 2.37 | 0.353 | 0.744 | 0.549 |
Temporally integrated period mean