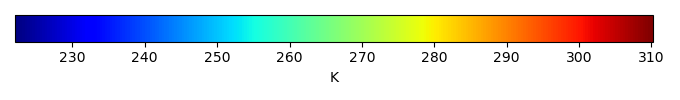
Mean State
Download Data |
Period Mean (original grids) [K] |
Model Period Mean (intersection) [K] |
Benchmark Period Mean (intersection) [K] |
Model Period Mean (complement) [K] |
Benchmark Period Mean (complement) [K] |
Bias [K] |
RMSE [K] |
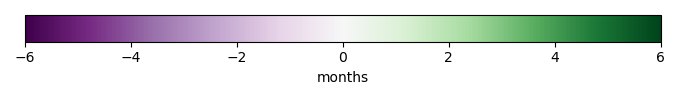
Phase Shift [months] |
Bias Score [1] |
RMSE Score [1] |
Seasonal Cycle Score [1] |
Spatial Distribution Score [1] |
Overall Score [1] |
|||
|---|---|---|---|---|---|---|---|---|---|---|---|---|---|---|---|---|
| Benchmark | [-] | 304. | ||||||||||||||
| h0 | [-] | 305. | 305. | 304. | 304. | 305. | 1.10 | 1.44 | 0.388 | 0.382 | 0.799 | 0.954 | 0.991 | 0.785 | ||
| h0a | [-] | 305. | 305. | 304. | 304. | 305. | 1.10 | 1.44 | 0.388 | 0.382 | 0.799 | 0.954 | 0.991 | 0.785 |
Download Data |
Period Mean (original grids) [K] |
Model Period Mean (intersection) [K] |
Benchmark Period Mean (intersection) [K] |
Model Period Mean (complement) [K] |
Benchmark Period Mean (complement) [K] |
Bias [K] |
RMSE [K] |
Phase Shift [months] |
Bias Score [1] |
RMSE Score [1] |
Seasonal Cycle Score [1] |
Spatial Distribution Score [1] |
Overall Score [1] |
|||
|---|---|---|---|---|---|---|---|---|---|---|---|---|---|---|---|---|
| Benchmark | [-] | 307. | ||||||||||||||
| h0 | [-] | 309. | 309. | 307. | 304. | 306. | 1.36 | 1.60 | 0.224 | 0.594 | 0.860 | 0.981 | 0.995 | 0.858 | ||
| h0a | [-] | 309. | 309. | 307. | 304. | 306. | 1.36 | 1.60 | 0.224 | 0.594 | 0.860 | 0.981 | 0.995 | 0.858 |
Download Data |
Period Mean (original grids) [K] |
Model Period Mean (intersection) [K] |
Benchmark Period Mean (intersection) [K] |
Model Period Mean (complement) [K] |
Benchmark Period Mean (complement) [K] |
Bias [K] |
RMSE [K] |
Phase Shift [months] |
Bias Score [1] |
RMSE Score [1] |
Seasonal Cycle Score [1] |
Spatial Distribution Score [1] |
Overall Score [1] |
|||
|---|---|---|---|---|---|---|---|---|---|---|---|---|---|---|---|---|
| Benchmark | [-] | 302. | ||||||||||||||
| h0 | [-] | 303. | 303. | 302. | 300. | 301. | 1.02 | 1.51 | 0.460 | 0.515 | 0.830 | 0.945 | 0.985 | 0.821 | ||
| h0a | [-] | 303. | 303. | 302. | 300. | 301. | 1.02 | 1.51 | 0.460 | 0.515 | 0.830 | 0.945 | 0.985 | 0.821 |
Download Data |
Period Mean (original grids) [K] |
Model Period Mean (intersection) [K] |
Benchmark Period Mean (intersection) [K] |
Model Period Mean (complement) [K] |
Benchmark Period Mean (complement) [K] |
Bias [K] |
RMSE [K] |
Phase Shift [months] |
Bias Score [1] |
RMSE Score [1] |
Seasonal Cycle Score [1] |
Spatial Distribution Score [1] |
Overall Score [1] |
|||
|---|---|---|---|---|---|---|---|---|---|---|---|---|---|---|---|---|
| Benchmark | [-] | 267. | ||||||||||||||
| h0 | [-] | 265. | 265. | 267. | 269. | 269. | -1.65 | 2.44 | 0.0520 | 0.894 | 0.907 | 0.997 | 0.997 | 0.940 | ||
| h0a | [-] | 265. | 265. | 267. | 269. | 269. | -1.65 | 2.44 | 0.0520 | 0.894 | 0.907 | 0.997 | 0.997 | 0.940 |
Download Data |
Period Mean (original grids) [K] |
Model Period Mean (intersection) [K] |
Benchmark Period Mean (intersection) [K] |
Model Period Mean (complement) [K] |
Benchmark Period Mean (complement) [K] |
Bias [K] |
RMSE [K] |
Phase Shift [months] |
Bias Score [1] |
RMSE Score [1] |
Seasonal Cycle Score [1] |
Spatial Distribution Score [1] |
Overall Score [1] |
|||
|---|---|---|---|---|---|---|---|---|---|---|---|---|---|---|---|---|
| Benchmark | [-] | 304. | ||||||||||||||
| h0 | [-] | 305. | 305. | 304. | 303. | 304. | 0.788 | 1.49 | 1.00 | 0.171 | 0.664 | 0.856 | 0.859 | 0.643 | ||
| h0a | [-] | 305. | 305. | 304. | 303. | 304. | 0.788 | 1.49 | 1.00 | 0.171 | 0.664 | 0.856 | 0.859 | 0.643 |
Download Data |
Period Mean (original grids) [K] |
Model Period Mean (intersection) [K] |
Benchmark Period Mean (intersection) [K] |
Model Period Mean (complement) [K] |
Benchmark Period Mean (complement) [K] |
Bias [K] |
RMSE [K] |
Phase Shift [months] |
Bias Score [1] |
RMSE Score [1] |
Seasonal Cycle Score [1] |
Spatial Distribution Score [1] |
Overall Score [1] |
|||
|---|---|---|---|---|---|---|---|---|---|---|---|---|---|---|---|---|
| Benchmark | [-] | 277. | ||||||||||||||
| h0 | [-] | 275. | 275. | 277. | 277. | 277. | -1.73 | 2.43 | 0.00990 | 0.881 | 0.901 | 0.999 | 1.00 | 0.936 | ||
| h0a | [-] | 275. | 275. | 277. | 277. | 277. | -1.73 | 2.43 | 0.00990 | 0.881 | 0.901 | 0.999 | 1.00 | 0.936 |
Download Data |
Period Mean (original grids) [K] |
Model Period Mean (intersection) [K] |
Benchmark Period Mean (intersection) [K] |
Model Period Mean (complement) [K] |
Benchmark Period Mean (complement) [K] |
Bias [K] |
RMSE [K] |
Phase Shift [months] |
Bias Score [1] |
RMSE Score [1] |
Seasonal Cycle Score [1] |
Spatial Distribution Score [1] |
Overall Score [1] |
|||
|---|---|---|---|---|---|---|---|---|---|---|---|---|---|---|---|---|
| Benchmark | [-] | 287. | ||||||||||||||
| h0 | [-] | 286. | 286. | 287. | 290. | 293. | -0.447 | 1.72 | 0.179 | 0.873 | 0.911 | 0.987 | 0.999 | 0.936 | ||
| h0a | [-] | 286. | 286. | 287. | 290. | 293. | -0.447 | 1.72 | 0.179 | 0.873 | 0.911 | 0.987 | 0.999 | 0.936 |
Download Data |
Period Mean (original grids) [K] |
Model Period Mean (intersection) [K] |
Benchmark Period Mean (intersection) [K] |
Model Period Mean (complement) [K] |
Benchmark Period Mean (complement) [K] |
Bias [K] |
RMSE [K] |
Phase Shift [months] |
Bias Score [1] |
RMSE Score [1] |
Seasonal Cycle Score [1] |
Spatial Distribution Score [1] |
Overall Score [1] |
|||
|---|---|---|---|---|---|---|---|---|---|---|---|---|---|---|---|---|
| Benchmark | [-] | 303. | ||||||||||||||
| h0 | [-] | 303. | 303. | 303. | 304. | 304. | 0.567 | 1.53 | 0.252 | 0.670 | 0.812 | 0.975 | 1.00 | 0.854 | ||
| h0a | [-] | 303. | 303. | 303. | 304. | 304. | 0.567 | 1.53 | 0.252 | 0.670 | 0.812 | 0.975 | 1.00 | 0.854 |
Download Data |
Period Mean (original grids) [K] |
Model Period Mean (intersection) [K] |
Benchmark Period Mean (intersection) [K] |
Model Period Mean (complement) [K] |
Benchmark Period Mean (complement) [K] |
Bias [K] |
RMSE [K] |
Phase Shift [months] |
Bias Score [1] |
RMSE Score [1] |
Seasonal Cycle Score [1] |
Spatial Distribution Score [1] |
Overall Score [1] |
|||
|---|---|---|---|---|---|---|---|---|---|---|---|---|---|---|---|---|
| Benchmark | [-] | 269. | ||||||||||||||
| h0 | [-] | 266. | 266. | 269. | 268. | 270. | -2.30 | 2.89 | 0.0352 | 0.856 | 0.901 | 0.998 | 0.998 | 0.931 | ||
| h0a | [-] | 266. | 266. | 269. | 268. | 270. | -2.30 | 2.89 | 0.0352 | 0.856 | 0.901 | 0.998 | 0.998 | 0.931 |
Download Data |
Period Mean (original grids) [K] |
Model Period Mean (intersection) [K] |
Benchmark Period Mean (intersection) [K] |
Model Period Mean (complement) [K] |
Benchmark Period Mean (complement) [K] |
Bias [K] |
RMSE [K] |
Phase Shift [months] |
Bias Score [1] |
RMSE Score [1] |
Seasonal Cycle Score [1] |
Spatial Distribution Score [1] |
Overall Score [1] |
|||
|---|---|---|---|---|---|---|---|---|---|---|---|---|---|---|---|---|
| Benchmark | [-] | 302. | ||||||||||||||
| h0 | [-] | 303. | 303. | 302. | 296. | 299. | 1.15 | 1.62 | 0.219 | 0.720 | 0.882 | 0.984 | 0.987 | 0.891 | ||
| h0a | [-] | 303. | 303. | 302. | 296. | 299. | 1.15 | 1.62 | 0.219 | 0.720 | 0.882 | 0.984 | 0.987 | 0.891 |
Download Data |
Period Mean (original grids) [K] |
Model Period Mean (intersection) [K] |
Benchmark Period Mean (intersection) [K] |
Model Period Mean (complement) [K] |
Benchmark Period Mean (complement) [K] |
Bias [K] |
RMSE [K] |
Phase Shift [months] |
Bias Score [1] |
RMSE Score [1] |
Seasonal Cycle Score [1] |
Spatial Distribution Score [1] |
Overall Score [1] |
|||
|---|---|---|---|---|---|---|---|---|---|---|---|---|---|---|---|---|
| Benchmark | [-] | 287. | ||||||||||||||
| h0 | [-] | 286. | 286. | 287. | 287. | 291. | -1.19 | 1.76 | 0.217 | 0.822 | 0.896 | 0.985 | 0.992 | 0.919 | ||
| h0a | [-] | 286. | 286. | 287. | 287. | 291. | -1.19 | 1.76 | 0.217 | 0.822 | 0.896 | 0.985 | 0.992 | 0.919 |
Download Data |
Period Mean (original grids) [K] |
Model Period Mean (intersection) [K] |
Benchmark Period Mean (intersection) [K] |
Model Period Mean (complement) [K] |
Benchmark Period Mean (complement) [K] |
Bias [K] |
RMSE [K] |
Phase Shift [months] |
Bias Score [1] |
RMSE Score [1] |
Seasonal Cycle Score [1] |
Spatial Distribution Score [1] |
Overall Score [1] |
|||
|---|---|---|---|---|---|---|---|---|---|---|---|---|---|---|---|---|
| Benchmark | [-] | 293. | ||||||||||||||
| h0 | [-] | 288. | 293. | 293. | 247. | 295. | -0.0659 | 1.79 | 0.230 | 0.717 | 0.861 | 0.976 | 0.991 | 0.881 | ||
| h0a | [-] | 288. | 293. | 293. | 247. | 295. | -0.0659 | 1.79 | 0.230 | 0.717 | 0.861 | 0.976 | 0.991 | 0.881 |
Download Data |
Period Mean (original grids) [K] |
Model Period Mean (intersection) [K] |
Benchmark Period Mean (intersection) [K] |
Model Period Mean (complement) [K] |
Benchmark Period Mean (complement) [K] |
Bias [K] |
RMSE [K] |
Phase Shift [months] |
Bias Score [1] |
RMSE Score [1] |
Seasonal Cycle Score [1] |
Spatial Distribution Score [1] |
Overall Score [1] |
|||
|---|---|---|---|---|---|---|---|---|---|---|---|---|---|---|---|---|
| Benchmark | [-] | 303. | ||||||||||||||
| h0 | [-] | 304. | 304. | 303. | 299. | 301. | 0.344 | 1.24 | 0.212 | 0.850 | 0.916 | 0.982 | 0.997 | 0.932 | ||
| h0a | [-] | 304. | 304. | 303. | 299. | 301. | 0.344 | 1.24 | 0.212 | 0.850 | 0.916 | 0.982 | 0.997 | 0.932 |
Download Data |
Period Mean (original grids) [K] |
Model Period Mean (intersection) [K] |
Benchmark Period Mean (intersection) [K] |
Model Period Mean (complement) [K] |
Benchmark Period Mean (complement) [K] |
Bias [K] |
RMSE [K] |
Phase Shift [months] |
Bias Score [1] |
RMSE Score [1] |
Seasonal Cycle Score [1] |
Spatial Distribution Score [1] |
Overall Score [1] |
|||
|---|---|---|---|---|---|---|---|---|---|---|---|---|---|---|---|---|
| Benchmark | [-] | 269. | ||||||||||||||
| h0 | [-] | 268. | 268. | 269. | 267. | 269. | -1.70 | 2.54 | 0.0314 | 0.865 | 0.880 | 0.998 | 1.00 | 0.925 | ||
| h0a | [-] | 268. | 268. | 269. | 267. | 269. | -1.70 | 2.54 | 0.0314 | 0.865 | 0.880 | 0.998 | 1.00 | 0.925 |
Download Data |
Period Mean (original grids) [K] |
Model Period Mean (intersection) [K] |
Benchmark Period Mean (intersection) [K] |
Model Period Mean (complement) [K] |
Benchmark Period Mean (complement) [K] |
Bias [K] |
RMSE [K] |
Phase Shift [months] |
Bias Score [1] |
RMSE Score [1] |
Seasonal Cycle Score [1] |
Spatial Distribution Score [1] |
Overall Score [1] |
|||
|---|---|---|---|---|---|---|---|---|---|---|---|---|---|---|---|---|
| Benchmark | [-] | 303. | ||||||||||||||
| h0 | [-] | 303. | 303. | 303. | 303. | 304. | 0.210 | 1.45 | 0.321 | 0.613 | 0.830 | 0.970 | 0.996 | 0.848 | ||
| h0a | [-] | 303. | 303. | 303. | 303. | 304. | 0.210 | 1.45 | 0.321 | 0.613 | 0.830 | 0.970 | 0.996 | 0.848 |
Download Data |
Period Mean (original grids) [K] |
Model Period Mean (intersection) [K] |
Benchmark Period Mean (intersection) [K] |
Model Period Mean (complement) [K] |
Benchmark Period Mean (complement) [K] |
Bias [K] |
RMSE [K] |
Phase Shift [months] |
Bias Score [1] |
RMSE Score [1] |
Seasonal Cycle Score [1] |
Spatial Distribution Score [1] |
Overall Score [1] |
|||
|---|---|---|---|---|---|---|---|---|---|---|---|---|---|---|---|---|
| Benchmark | [-] | 293. | ||||||||||||||
| h0 | [-] | 292. | 292. | 293. | 298. | 296. | 0.0472 | 1.32 | 0.154 | 0.910 | 0.899 | 0.990 | 0.988 | 0.937 | ||
| h0a | [-] | 292. | 292. | 293. | 298. | 296. | 0.0472 | 1.32 | 0.154 | 0.910 | 0.899 | 0.990 | 0.988 | 0.937 |
Download Data |
Period Mean (original grids) [K] |
Model Period Mean (intersection) [K] |
Benchmark Period Mean (intersection) [K] |
Model Period Mean (complement) [K] |
Benchmark Period Mean (complement) [K] |
Bias [K] |
RMSE [K] |
Phase Shift [months] |
Bias Score [1] |
RMSE Score [1] |
Seasonal Cycle Score [1] |
Spatial Distribution Score [1] |
Overall Score [1] |
|||
|---|---|---|---|---|---|---|---|---|---|---|---|---|---|---|---|---|
| Benchmark | [-] | 280. | ||||||||||||||
| h0 | [-] | 279. | 279. | 280. | 281. | 283. | -1.07 | 1.79 | 0.0683 | 0.898 | 0.891 | 0.995 | 0.985 | 0.932 | ||
| h0a | [-] | 279. | 279. | 280. | 281. | 283. | -1.07 | 1.79 | 0.0683 | 0.898 | 0.891 | 0.995 | 0.985 | 0.932 |
Download Data |
Period Mean (original grids) [K] |
Model Period Mean (intersection) [K] |
Benchmark Period Mean (intersection) [K] |
Model Period Mean (complement) [K] |
Benchmark Period Mean (complement) [K] |
Bias [K] |
RMSE [K] |
Phase Shift [months] |
Bias Score [1] |
RMSE Score [1] |
Seasonal Cycle Score [1] |
Spatial Distribution Score [1] |
Overall Score [1] |
|||
|---|---|---|---|---|---|---|---|---|---|---|---|---|---|---|---|---|
| Benchmark | [-] | 291. | ||||||||||||||
| h0 | [-] | 291. | 291. | 291. | 292. | 292. | -0.0762 | 1.62 | 0.0902 | 0.883 | 0.884 | 0.994 | 0.998 | 0.928 | ||
| h0a | [-] | 291. | 291. | 291. | 292. | 292. | -0.0762 | 1.62 | 0.0902 | 0.883 | 0.884 | 0.994 | 0.998 | 0.928 |
Download Data |
Period Mean (original grids) [K] |
Model Period Mean (intersection) [K] |
Benchmark Period Mean (intersection) [K] |
Model Period Mean (complement) [K] |
Benchmark Period Mean (complement) [K] |
Bias [K] |
RMSE [K] |
Phase Shift [months] |
Bias Score [1] |
RMSE Score [1] |
Seasonal Cycle Score [1] |
Spatial Distribution Score [1] |
Overall Score [1] |
|||
|---|---|---|---|---|---|---|---|---|---|---|---|---|---|---|---|---|
| Benchmark | [-] | 304. | ||||||||||||||
| h0 | [-] | 305. | 305. | 304. | 303. | 304. | 1.07 | 1.40 | 0.427 | 0.347 | 0.784 | 0.944 | 1.00 | 0.772 | ||
| h0a | [-] | 305. | 305. | 304. | 303. | 304. | 1.07 | 1.40 | 0.427 | 0.347 | 0.784 | 0.944 | 1.00 | 0.772 |
Download Data |
Period Mean (original grids) [K] |
Model Period Mean (intersection) [K] |
Benchmark Period Mean (intersection) [K] |
Model Period Mean (complement) [K] |
Benchmark Period Mean (complement) [K] |
Bias [K] |
RMSE [K] |
Phase Shift [months] |
Bias Score [1] |
RMSE Score [1] |
Seasonal Cycle Score [1] |
Spatial Distribution Score [1] |
Overall Score [1] |
|||
|---|---|---|---|---|---|---|---|---|---|---|---|---|---|---|---|---|
| Benchmark | [-] | 302. | ||||||||||||||
| h0 | [-] | 303. | 303. | 302. | 299. | 297. | 1.05 | 1.34 | 0.273 | 0.603 | 0.817 | 0.970 | 0.996 | 0.841 | ||
| h0a | [-] | 303. | 303. | 302. | 299. | 297. | 1.05 | 1.34 | 0.273 | 0.603 | 0.817 | 0.970 | 0.996 | 0.841 |
Download Data |
Period Mean (original grids) [K] |
Model Period Mean (intersection) [K] |
Benchmark Period Mean (intersection) [K] |
Model Period Mean (complement) [K] |
Benchmark Period Mean (complement) [K] |
Bias [K] |
RMSE [K] |
Phase Shift [months] |
Bias Score [1] |
RMSE Score [1] |
Seasonal Cycle Score [1] |
Spatial Distribution Score [1] |
Overall Score [1] |
|||
|---|---|---|---|---|---|---|---|---|---|---|---|---|---|---|---|---|
| Benchmark | [-] | 290. | ||||||||||||||
| h0 | [-] | 292. | 292. | 290. | 292. | 288. | 1.20 | 2.27 | 0.368 | 0.571 | 0.777 | 0.952 | 0.992 | 0.814 | ||
| h0a | [-] | 292. | 292. | 290. | 292. | 288. | 1.20 | 2.27 | 0.368 | 0.571 | 0.777 | 0.952 | 0.992 | 0.814 |
Temporally integrated period mean