Mean State
Download Data |
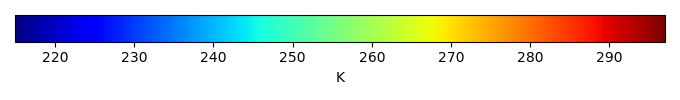
Period Mean (original grids) [K] |
Model Period Mean (intersection) [K] |
Benchmark Period Mean (intersection) [K] |
Model Period Mean (complement) [K] |
Benchmark Period Mean (complement) [K] |
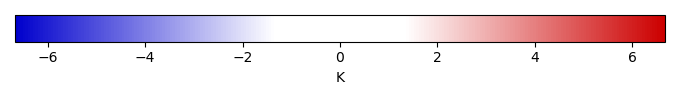
Bias [K] |
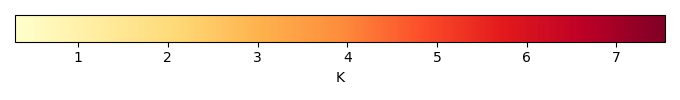
RMSE [K] |
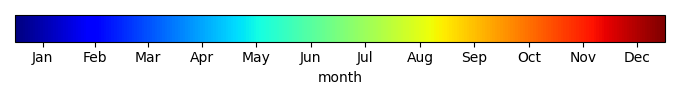
Phase Shift [months] |
Bias Score [1] |
RMSE Score [1] |
Seasonal Cycle Score [1] |
Spatial Distribution Score [1] |
Overall Score [1] |
|||
|---|---|---|---|---|---|---|---|---|---|---|---|---|---|---|---|---|
| Benchmark | [-] | 293. | ||||||||||||||
| h0 | [-] | 294. | 294. | 293. | 297. | 296. | 0.624 | 1.04 | 0.597 | 0.408 | 0.651 | 0.942 | 1.00 | 0.731 | ||
| h0a | [-] | 294. | 294. | 293. | 297. | 296. | 0.624 | 1.04 | 0.597 | 0.408 | 0.651 | 0.942 | 1.00 | 0.731 |
Download Data |
Period Mean (original grids) [K] |
Model Period Mean (intersection) [K] |
Benchmark Period Mean (intersection) [K] |
Model Period Mean (complement) [K] |
Benchmark Period Mean (complement) [K] |
Bias [K] |
RMSE [K] |
Phase Shift [months] |
Bias Score [1] |
RMSE Score [1] |
Seasonal Cycle Score [1] |
Spatial Distribution Score [1] |
Overall Score [1] |
|||
|---|---|---|---|---|---|---|---|---|---|---|---|---|---|---|---|---|
| Benchmark | [-] | 294. | ||||||||||||||
| h0 | [-] | 294. | 294. | 294. | 296. | 295. | -0.0590 | 1.19 | 0.302 | 0.729 | 0.772 | 0.972 | 0.985 | 0.846 | ||
| h0a | [-] | 294. | 294. | 294. | 296. | 295. | -0.0590 | 1.19 | 0.302 | 0.729 | 0.772 | 0.972 | 0.985 | 0.846 |
Download Data |
Period Mean (original grids) [K] |
Model Period Mean (intersection) [K] |
Benchmark Period Mean (intersection) [K] |
Model Period Mean (complement) [K] |
Benchmark Period Mean (complement) [K] |
Bias [K] |
RMSE [K] |
Phase Shift [months] |
Bias Score [1] |
RMSE Score [1] |
Seasonal Cycle Score [1] |
Spatial Distribution Score [1] |
Overall Score [1] |
|||
|---|---|---|---|---|---|---|---|---|---|---|---|---|---|---|---|---|
| Benchmark | [-] | 289. | ||||||||||||||
| h0 | [-] | 289. | 289. | 289. | 292. | 292. | 0.212 | 0.997 | 0.617 | 0.718 | 0.854 | 0.933 | 0.995 | 0.871 | ||
| h0a | [-] | 289. | 289. | 289. | 292. | 292. | 0.212 | 0.997 | 0.617 | 0.718 | 0.854 | 0.933 | 0.995 | 0.871 |
Download Data |
Period Mean (original grids) [K] |
Model Period Mean (intersection) [K] |
Benchmark Period Mean (intersection) [K] |
Model Period Mean (complement) [K] |
Benchmark Period Mean (complement) [K] |
Bias [K] |
RMSE [K] |
Phase Shift [months] |
Bias Score [1] |
RMSE Score [1] |
Seasonal Cycle Score [1] |
Spatial Distribution Score [1] |
Overall Score [1] |
|||
|---|---|---|---|---|---|---|---|---|---|---|---|---|---|---|---|---|
| Benchmark | [-] | 258. | ||||||||||||||
| h0 | [-] | 255. | 255. | 258. | 263. | 261. | -2.10 | 2.79 | 0.0670 | 0.854 | 0.919 | 0.995 | 0.999 | 0.937 | ||
| h0a | [-] | 255. | 255. | 258. | 263. | 261. | -2.10 | 2.79 | 0.0670 | 0.854 | 0.919 | 0.995 | 0.999 | 0.937 |
Download Data |
Period Mean (original grids) [K] |
Model Period Mean (intersection) [K] |
Benchmark Period Mean (intersection) [K] |
Model Period Mean (complement) [K] |
Benchmark Period Mean (complement) [K] |
Bias [K] |
RMSE [K] |
Phase Shift [months] |
Bias Score [1] |
RMSE Score [1] |
Seasonal Cycle Score [1] |
Spatial Distribution Score [1] |
Overall Score [1] |
|||
|---|---|---|---|---|---|---|---|---|---|---|---|---|---|---|---|---|
| Benchmark | [-] | 295. | ||||||||||||||
| h0 | [-] | 295. | 295. | 295. | 297. | 295. | 1.10 | 1.50 | 1.68 | 0.246 | 0.614 | 0.736 | 0.942 | 0.630 | ||
| h0a | [-] | 295. | 295. | 295. | 297. | 295. | 1.10 | 1.50 | 1.68 | 0.246 | 0.614 | 0.736 | 0.942 | 0.630 |
Download Data |
Period Mean (original grids) [K] |
Model Period Mean (intersection) [K] |
Benchmark Period Mean (intersection) [K] |
Model Period Mean (complement) [K] |
Benchmark Period Mean (complement) [K] |
Bias [K] |
RMSE [K] |
Phase Shift [months] |
Bias Score [1] |
RMSE Score [1] |
Seasonal Cycle Score [1] |
Spatial Distribution Score [1] |
Overall Score [1] |
|||
|---|---|---|---|---|---|---|---|---|---|---|---|---|---|---|---|---|
| Benchmark | [-] | 266. | ||||||||||||||
| h0 | [-] | 264. | 264. | 266. | 270. | 270. | -2.17 | 2.75 | 0.0663 | 0.842 | 0.896 | 0.996 | 0.999 | 0.926 | ||
| h0a | [-] | 264. | 264. | 266. | 270. | 270. | -2.17 | 2.75 | 0.0663 | 0.842 | 0.896 | 0.996 | 0.999 | 0.926 |
Download Data |
Period Mean (original grids) [K] |
Model Period Mean (intersection) [K] |
Benchmark Period Mean (intersection) [K] |
Model Period Mean (complement) [K] |
Benchmark Period Mean (complement) [K] |
Bias [K] |
RMSE [K] |
Phase Shift [months] |
Bias Score [1] |
RMSE Score [1] |
Seasonal Cycle Score [1] |
Spatial Distribution Score [1] |
Overall Score [1] |
|||
|---|---|---|---|---|---|---|---|---|---|---|---|---|---|---|---|---|
| Benchmark | [-] | 275. | ||||||||||||||
| h0 | [-] | 274. | 274. | 275. | 284. | 285. | -1.19 | 2.00 | 0.0564 | 0.836 | 0.919 | 0.996 | 1.00 | 0.934 | ||
| h0a | [-] | 274. | 274. | 275. | 284. | 285. | -1.19 | 2.00 | 0.0564 | 0.836 | 0.919 | 0.996 | 1.00 | 0.934 |
Download Data |
Period Mean (original grids) [K] |
Model Period Mean (intersection) [K] |
Benchmark Period Mean (intersection) [K] |
Model Period Mean (complement) [K] |
Benchmark Period Mean (complement) [K] |
Bias [K] |
RMSE [K] |
Phase Shift [months] |
Bias Score [1] |
RMSE Score [1] |
Seasonal Cycle Score [1] |
Spatial Distribution Score [1] |
Overall Score [1] |
|||
|---|---|---|---|---|---|---|---|---|---|---|---|---|---|---|---|---|
| Benchmark | [-] | 292. | ||||||||||||||
| h0 | [-] | 291. | 291. | 292. | 296. | 296. | -0.423 | 1.40 | 0.383 | 0.751 | 0.832 | 0.966 | 0.995 | 0.875 | ||
| h0a | [-] | 291. | 291. | 292. | 296. | 296. | -0.423 | 1.40 | 0.383 | 0.751 | 0.832 | 0.966 | 0.995 | 0.875 |
Download Data |
Period Mean (original grids) [K] |
Model Period Mean (intersection) [K] |
Benchmark Period Mean (intersection) [K] |
Model Period Mean (complement) [K] |
Benchmark Period Mean (complement) [K] |
Bias [K] |
RMSE [K] |
Phase Shift [months] |
Bias Score [1] |
RMSE Score [1] |
Seasonal Cycle Score [1] |
Spatial Distribution Score [1] |
Overall Score [1] |
|||
|---|---|---|---|---|---|---|---|---|---|---|---|---|---|---|---|---|
| Benchmark | [-] | 261. | ||||||||||||||
| h0 | [-] | 258. | 258. | 261. | 262. | 263. | -2.74 | 3.26 | 0.0228 | 0.824 | 0.909 | 0.998 | 0.998 | 0.928 | ||
| h0a | [-] | 258. | 258. | 261. | 262. | 263. | -2.74 | 3.26 | 0.0228 | 0.824 | 0.909 | 0.998 | 0.998 | 0.928 |
Download Data |
Period Mean (original grids) [K] |
Model Period Mean (intersection) [K] |
Benchmark Period Mean (intersection) [K] |
Model Period Mean (complement) [K] |
Benchmark Period Mean (complement) [K] |
Bias [K] |
RMSE [K] |
Phase Shift [months] |
Bias Score [1] |
RMSE Score [1] |
Seasonal Cycle Score [1] |
Spatial Distribution Score [1] |
Overall Score [1] |
|||
|---|---|---|---|---|---|---|---|---|---|---|---|---|---|---|---|---|
| Benchmark | [-] | 288. | ||||||||||||||
| h0 | [-] | 288. | 288. | 288. | 288. | 289. | 0.316 | 0.903 | 0.288 | 0.850 | 0.906 | 0.980 | 0.998 | 0.928 | ||
| h0a | [-] | 288. | 288. | 288. | 288. | 289. | 0.316 | 0.903 | 0.288 | 0.850 | 0.906 | 0.980 | 0.998 | 0.928 |
Download Data |
Period Mean (original grids) [K] |
Model Period Mean (intersection) [K] |
Benchmark Period Mean (intersection) [K] |
Model Period Mean (complement) [K] |
Benchmark Period Mean (complement) [K] |
Bias [K] |
RMSE [K] |
Phase Shift [months] |
Bias Score [1] |
RMSE Score [1] |
Seasonal Cycle Score [1] |
Spatial Distribution Score [1] |
Overall Score [1] |
|||
|---|---|---|---|---|---|---|---|---|---|---|---|---|---|---|---|---|
| Benchmark | [-] | 278. | ||||||||||||||
| h0 | [-] | 276. | 276. | 278. | 280. | 283. | -1.46 | 1.88 | 0.211 | 0.761 | 0.897 | 0.986 | 0.986 | 0.906 | ||
| h0a | [-] | 276. | 276. | 278. | 280. | 283. | -1.46 | 1.88 | 0.211 | 0.761 | 0.897 | 0.986 | 0.986 | 0.906 |
Download Data |
Period Mean (original grids) [K] |
Model Period Mean (intersection) [K] |
Benchmark Period Mean (intersection) [K] |
Model Period Mean (complement) [K] |
Benchmark Period Mean (complement) [K] |
Bias [K] |
RMSE [K] |
Phase Shift [months] |
Bias Score [1] |
RMSE Score [1] |
Seasonal Cycle Score [1] |
Spatial Distribution Score [1] |
Overall Score [1] |
|||
|---|---|---|---|---|---|---|---|---|---|---|---|---|---|---|---|---|
| Benchmark | [-] | 281. | ||||||||||||||
| h0 | [-] | 276. | 280. | 281. | 239. | 286. | -0.668 | 1.73 | 0.365 | 0.742 | 0.856 | 0.958 | 0.995 | 0.882 | ||
| h0a | [-] | 276. | 280. | 281. | 239. | 286. | -0.668 | 1.73 | 0.365 | 0.742 | 0.856 | 0.958 | 0.995 | 0.882 |
Download Data |
Period Mean (original grids) [K] |
Model Period Mean (intersection) [K] |
Benchmark Period Mean (intersection) [K] |
Model Period Mean (complement) [K] |
Benchmark Period Mean (complement) [K] |
Bias [K] |
RMSE [K] |
Phase Shift [months] |
Bias Score [1] |
RMSE Score [1] |
Seasonal Cycle Score [1] |
Spatial Distribution Score [1] |
Overall Score [1] |
|||
|---|---|---|---|---|---|---|---|---|---|---|---|---|---|---|---|---|
| Benchmark | [-] | 289. | ||||||||||||||
| h0 | [-] | 288. | 288. | 289. | 291. | 290. | -1.08 | 1.61 | 0.357 | 0.802 | 0.888 | 0.972 | 1.00 | 0.910 | ||
| h0a | [-] | 288. | 288. | 289. | 291. | 290. | -1.08 | 1.61 | 0.357 | 0.802 | 0.888 | 0.972 | 1.00 | 0.910 |
Download Data |
Period Mean (original grids) [K] |
Model Period Mean (intersection) [K] |
Benchmark Period Mean (intersection) [K] |
Model Period Mean (complement) [K] |
Benchmark Period Mean (complement) [K] |
Bias [K] |
RMSE [K] |
Phase Shift [months] |
Bias Score [1] |
RMSE Score [1] |
Seasonal Cycle Score [1] |
Spatial Distribution Score [1] |
Overall Score [1] |
|||
|---|---|---|---|---|---|---|---|---|---|---|---|---|---|---|---|---|
| Benchmark | [-] | 261. | ||||||||||||||
| h0 | [-] | 259. | 259. | 261. | 261. | 262. | -1.96 | 2.66 | 0.0709 | 0.842 | 0.899 | 0.995 | 0.997 | 0.926 | ||
| h0a | [-] | 259. | 259. | 261. | 261. | 262. | -1.96 | 2.66 | 0.0709 | 0.842 | 0.899 | 0.995 | 0.997 | 0.926 |
Download Data |
Period Mean (original grids) [K] |
Model Period Mean (intersection) [K] |
Benchmark Period Mean (intersection) [K] |
Model Period Mean (complement) [K] |
Benchmark Period Mean (complement) [K] |
Bias [K] |
RMSE [K] |
Phase Shift [months] |
Bias Score [1] |
RMSE Score [1] |
Seasonal Cycle Score [1] |
Spatial Distribution Score [1] |
Overall Score [1] |
|||
|---|---|---|---|---|---|---|---|---|---|---|---|---|---|---|---|---|
| Benchmark | [-] | 289. | ||||||||||||||
| h0 | [-] | 289. | 289. | 289. | 294. | 295. | 0.447 | 1.52 | 0.405 | 0.616 | 0.845 | 0.959 | 1.00 | 0.853 | ||
| h0a | [-] | 289. | 289. | 289. | 294. | 295. | 0.447 | 1.52 | 0.405 | 0.616 | 0.845 | 0.959 | 1.00 | 0.853 |
Download Data |
Period Mean (original grids) [K] |
Model Period Mean (intersection) [K] |
Benchmark Period Mean (intersection) [K] |
Model Period Mean (complement) [K] |
Benchmark Period Mean (complement) [K] |
Bias [K] |
RMSE [K] |
Phase Shift [months] |
Bias Score [1] |
RMSE Score [1] |
Seasonal Cycle Score [1] |
Spatial Distribution Score [1] |
Overall Score [1] |
|||
|---|---|---|---|---|---|---|---|---|---|---|---|---|---|---|---|---|
| Benchmark | [-] | 281. | ||||||||||||||
| h0 | [-] | 280. | 280. | 281. | 288. | 286. | 0.0692 | 1.07 | 0.0735 | 0.912 | 0.921 | 0.995 | 0.989 | 0.948 | ||
| h0a | [-] | 280. | 280. | 281. | 288. | 286. | 0.0692 | 1.07 | 0.0735 | 0.912 | 0.921 | 0.995 | 0.989 | 0.948 |
Download Data |
Period Mean (original grids) [K] |
Model Period Mean (intersection) [K] |
Benchmark Period Mean (intersection) [K] |
Model Period Mean (complement) [K] |
Benchmark Period Mean (complement) [K] |
Bias [K] |
RMSE [K] |
Phase Shift [months] |
Bias Score [1] |
RMSE Score [1] |
Seasonal Cycle Score [1] |
Spatial Distribution Score [1] |
Overall Score [1] |
|||
|---|---|---|---|---|---|---|---|---|---|---|---|---|---|---|---|---|
| Benchmark | [-] | 269. | ||||||||||||||
| h0 | [-] | 268. | 268. | 269. | 274. | 276. | -1.25 | 1.99 | 0.0424 | 0.871 | 0.874 | 0.997 | 0.984 | 0.920 | ||
| h0a | [-] | 268. | 268. | 269. | 274. | 276. | -1.25 | 1.99 | 0.0424 | 0.871 | 0.874 | 0.997 | 0.984 | 0.920 |
Download Data |
Period Mean (original grids) [K] |
Model Period Mean (intersection) [K] |
Benchmark Period Mean (intersection) [K] |
Model Period Mean (complement) [K] |
Benchmark Period Mean (complement) [K] |
Bias [K] |
RMSE [K] |
Phase Shift [months] |
Bias Score [1] |
RMSE Score [1] |
Seasonal Cycle Score [1] |
Spatial Distribution Score [1] |
Overall Score [1] |
|||
|---|---|---|---|---|---|---|---|---|---|---|---|---|---|---|---|---|
| Benchmark | [-] | 276. | ||||||||||||||
| h0 | [-] | 276. | 276. | 276. | 282. | 281. | 0.158 | 1.55 | 0.0738 | 0.849 | 0.883 | 0.995 | 0.996 | 0.921 | ||
| h0a | [-] | 276. | 276. | 276. | 282. | 281. | 0.158 | 1.55 | 0.0738 | 0.849 | 0.883 | 0.995 | 0.996 | 0.921 |
Download Data |
Period Mean (original grids) [K] |
Model Period Mean (intersection) [K] |
Benchmark Period Mean (intersection) [K] |
Model Period Mean (complement) [K] |
Benchmark Period Mean (complement) [K] |
Bias [K] |
RMSE [K] |
Phase Shift [months] |
Bias Score [1] |
RMSE Score [1] |
Seasonal Cycle Score [1] |
Spatial Distribution Score [1] |
Overall Score [1] |
|||
|---|---|---|---|---|---|---|---|---|---|---|---|---|---|---|---|---|
| Benchmark | [-] | 294. | ||||||||||||||
| h0 | [-] | 295. | 295. | 294. | 296. | 296. | 0.820 | 1.25 | 1.59 | 0.357 | 0.715 | 0.759 | 0.997 | 0.709 | ||
| h0a | [-] | 295. | 295. | 294. | 296. | 296. | 0.820 | 1.25 | 1.59 | 0.357 | 0.715 | 0.759 | 0.997 | 0.709 |
Download Data |
Period Mean (original grids) [K] |
Model Period Mean (intersection) [K] |
Benchmark Period Mean (intersection) [K] |
Model Period Mean (complement) [K] |
Benchmark Period Mean (complement) [K] |
Bias [K] |
RMSE [K] |
Phase Shift [months] |
Bias Score [1] |
RMSE Score [1] |
Seasonal Cycle Score [1] |
Spatial Distribution Score [1] |
Overall Score [1] |
|||
|---|---|---|---|---|---|---|---|---|---|---|---|---|---|---|---|---|
| Benchmark | [-] | 290. | ||||||||||||||
| h0 | [-] | 291. | 290. | 290. | 292. | 288. | 0.230 | 0.964 | 0.619 | 0.733 | 0.846 | 0.914 | 0.999 | 0.868 | ||
| h0a | [-] | 291. | 290. | 290. | 292. | 288. | 0.230 | 0.964 | 0.619 | 0.733 | 0.846 | 0.914 | 0.999 | 0.868 |
Download Data |
Period Mean (original grids) [K] |
Model Period Mean (intersection) [K] |
Benchmark Period Mean (intersection) [K] |
Model Period Mean (complement) [K] |
Benchmark Period Mean (complement) [K] |
Bias [K] |
RMSE [K] |
Phase Shift [months] |
Bias Score [1] |
RMSE Score [1] |
Seasonal Cycle Score [1] |
Spatial Distribution Score [1] |
Overall Score [1] |
|||
|---|---|---|---|---|---|---|---|---|---|---|---|---|---|---|---|---|
| Benchmark | [-] | 278. | ||||||||||||||
| h0 | [-] | 278. | 278. | 278. | 284. | 280. | 0.676 | 1.97 | 0.214 | 0.619 | 0.829 | 0.984 | 1.00 | 0.852 | ||
| h0a | [-] | 278. | 278. | 278. | 284. | 280. | 0.676 | 1.97 | 0.214 | 0.619 | 0.829 | 0.984 | 1.00 | 0.852 |
Temporally integrated period mean