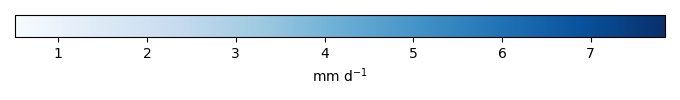
Mean State
Download Data |
Period Mean (original grids) [mm d-1] |
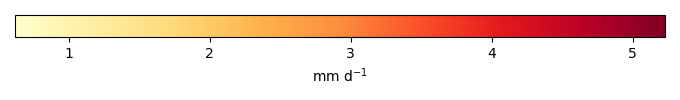
Bias [mm d-1] |
RMSE [mm d-1] |
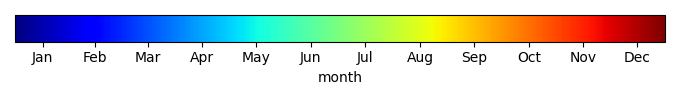
Phase Shift [months] |
Bias Score [1] |
RMSE Score [1] |
Seasonal Cycle Score [1] |
Overall Score [1] |
|||
|---|---|---|---|---|---|---|---|---|---|---|---|
| Benchmark | [-] | 4.82 | |||||||||
| h0 | [-] | 4.32 | -0.502 | 3.88 | 0.00 | 0.596 | 0.00 | 1.00 | 0.399 | ||
| h0a | [-] | 4.32 | -0.502 | 3.88 | 0.00 | 0.596 | 0.00 | 1.00 | 0.399 |
Download Data |
Period Mean (original grids) [mm d-1] |
Bias [mm d-1] |
RMSE [mm d-1] |
Phase Shift [months] |
Bias Score [1] |
RMSE Score [1] |
Seasonal Cycle Score [1] |
Overall Score [1] |
|||
|---|---|---|---|---|---|---|---|---|---|---|---|
| Benchmark | [-] | 0.768 | |||||||||
| h0 | [-] | 1.04 | 0.271 | 1.45 | 1.02 | 0.454 | 0.0274 | 0.932 | 0.360 | ||
| h0a | [-] | 1.04 | 0.271 | 1.45 | 1.02 | 0.454 | 0.0274 | 0.932 | 0.360 |
Download Data |
Period Mean (original grids) [mm d-1] |
Bias [mm d-1] |
RMSE [mm d-1] |
Phase Shift [months] |
Bias Score [1] |
RMSE Score [1] |
Seasonal Cycle Score [1] |
Overall Score [1] |
|||
|---|---|---|---|---|---|---|---|---|---|---|---|
| Benchmark | [-] | 1.59 | |||||||||
| h0 | [-] | 2.19 | 0.597 | 1.85 | 0.983 | 0.631 | 0.344 | 0.937 | 0.564 | ||
| h0a | [-] | 2.19 | 0.597 | 1.85 | 0.983 | 0.631 | 0.344 | 0.937 | 0.564 |
Download Data |
Period Mean (original grids) [mm d-1] |
Bias [mm d-1] |
RMSE [mm d-1] |
Phase Shift [months] |
Bias Score [1] |
RMSE Score [1] |
Seasonal Cycle Score [1] |
Overall Score [1] |
|||
|---|---|---|---|---|---|---|---|---|---|---|---|
| Benchmark | [-] | 0.431 | |||||||||
| h0 | [-] | 0.694 | 0.263 | 0.718 | 1.02 | 0.663 | 0.0453 | 0.932 | 0.421 | ||
| h0a | [-] | 0.694 | 0.263 | 0.718 | 1.02 | 0.663 | 0.0453 | 0.932 | 0.421 |
Download Data |
Period Mean (original grids) [mm d-1] |
Bias [mm d-1] |
RMSE [mm d-1] |
Phase Shift [months] |
Bias Score [1] |
RMSE Score [1] |
Seasonal Cycle Score [1] |
Overall Score [1] |
|||
|---|---|---|---|---|---|---|---|---|---|---|---|
| Benchmark | [-] | 5.11 | |||||||||
| h0 | [-] | 5.69 | 0.584 | 4.01 | 1.02 | 0.639 | 0.00 | 0.933 | 0.393 | ||
| h0a | [-] | 5.69 | 0.584 | 4.01 | 1.02 | 0.639 | 0.00 | 0.933 | 0.393 |
Download Data |
Period Mean (original grids) [mm d-1] |
Bias [mm d-1] |
RMSE [mm d-1] |
Phase Shift [months] |
Bias Score [1] |
RMSE Score [1] |
Seasonal Cycle Score [1] |
Overall Score [1] |
|||
|---|---|---|---|---|---|---|---|---|---|---|---|
| Benchmark | [-] | 1.30 | |||||||||
| h0 | [-] | 1.59 | 0.294 | 1.08 | 1.54 | 0.526 | 0.0695 | 0.856 | 0.380 | ||
| h0a | [-] | 1.59 | 0.294 | 1.08 | 1.54 | 0.526 | 0.0695 | 0.856 | 0.380 |
Download Data |
Period Mean (original grids) [mm d-1] |
Bias [mm d-1] |
RMSE [mm d-1] |
Phase Shift [months] |
Bias Score [1] |
RMSE Score [1] |
Seasonal Cycle Score [1] |
Overall Score [1] |
|||
|---|---|---|---|---|---|---|---|---|---|---|---|
| Benchmark | [-] | 1.95 | |||||||||
| h0 | [-] | 2.41 | 0.463 | 2.42 | 1.11 | 0.362 | 0.00347 | 0.814 | 0.296 | ||
| h0a | [-] | 2.41 | 0.463 | 2.42 | 1.11 | 0.362 | 0.00347 | 0.814 | 0.296 |
Download Data |
Period Mean (original grids) [mm d-1] |
Bias [mm d-1] |
RMSE [mm d-1] |
Phase Shift [months] |
Bias Score [1] |
RMSE Score [1] |
Seasonal Cycle Score [1] |
Overall Score [1] |
|||
|---|---|---|---|---|---|---|---|---|---|---|---|
| Benchmark | [-] | 2.65 | |||||||||
| h0 | [-] | 2.37 | -0.272 | 2.89 | 1.67 | 0.399 | 0.0120 | 0.770 | 0.298 | ||
| h0a | [-] | 2.37 | -0.272 | 2.89 | 1.67 | 0.399 | 0.0120 | 0.770 | 0.298 |
Download Data |
Period Mean (original grids) [mm d-1] |
Bias [mm d-1] |
RMSE [mm d-1] |
Phase Shift [months] |
Bias Score [1] |
RMSE Score [1] |
Seasonal Cycle Score [1] |
Overall Score [1] |
|||
|---|---|---|---|---|---|---|---|---|---|---|---|
| Benchmark | [-] | 2.35 | |||||||||
| h0 | [-] | 2.42 | 0.0620 | 2.07 | 1.51 | 0.355 | 0.00552 | 0.809 | 0.294 | ||
| h0a | [-] | 2.42 | 0.0620 | 2.07 | 1.51 | 0.355 | 0.00552 | 0.809 | 0.294 |
Download Data |
Period Mean (original grids) [mm d-1] |
Bias [mm d-1] |
RMSE [mm d-1] |
Phase Shift [months] |
Bias Score [1] |
RMSE Score [1] |
Seasonal Cycle Score [1] |
Overall Score [1] |
|||
|---|---|---|---|---|---|---|---|---|---|---|---|
| Benchmark | [-] | 2.16 | |||||||||
| h0 | [-] | 2.23 | 0.0656 | 2.11 | 1.41 | 0.435 | 0.0173 | 0.815 | 0.321 | ||
| h0a | [-] | 2.23 | 0.0656 | 2.11 | 1.41 | 0.435 | 0.0173 | 0.815 | 0.321 |
Download Data |
Period Mean (original grids) [mm d-1] |
Bias [mm d-1] |
RMSE [mm d-1] |
Phase Shift [months] |
Bias Score [1] |
RMSE Score [1] |
Seasonal Cycle Score [1] |
Overall Score [1] |
|||
|---|---|---|---|---|---|---|---|---|---|---|---|
| Benchmark | [-] | 0.621 | |||||||||
| h0 | [-] | 0.792 | 0.170 | 0.851 | 1.03 | 0.509 | 0.0489 | 0.930 | 0.384 | ||
| h0a | [-] | 0.792 | 0.170 | 0.851 | 1.03 | 0.509 | 0.0489 | 0.930 | 0.384 |
Download Data |
Period Mean (original grids) [mm d-1] |
Bias [mm d-1] |
RMSE [mm d-1] |
Phase Shift [months] |
Bias Score [1] |
RMSE Score [1] |
Seasonal Cycle Score [1] |
Overall Score [1] |
|||
|---|---|---|---|---|---|---|---|---|---|---|---|
| Benchmark | [-] | 6.24 | |||||||||
| h0 | [-] | 7.84 | 1.59 | 4.64 | 0.00 | 0.493 | 0.104 | 1.00 | 0.425 | ||
| h0a | [-] | 7.84 | 1.59 | 4.64 | 0.00 | 0.493 | 0.104 | 1.00 | 0.425 |
Download Data |
Period Mean (original grids) [mm d-1] |
Bias [mm d-1] |
RMSE [mm d-1] |
Phase Shift [months] |
Bias Score [1] |
RMSE Score [1] |
Seasonal Cycle Score [1] |
Overall Score [1] |
|||
|---|---|---|---|---|---|---|---|---|---|---|---|
| Benchmark | [-] | 2.29 | |||||||||
| h0 | [-] | 2.42 | 0.125 | 1.96 | 2.01 | 0.597 | 0.0288 | 0.703 | 0.339 | ||
| h0a | [-] | 2.42 | 0.125 | 1.96 | 2.01 | 0.597 | 0.0288 | 0.703 | 0.339 |
Download Data |
Period Mean (original grids) [mm d-1] |
Bias [mm d-1] |
RMSE [mm d-1] |
Phase Shift [months] |
Bias Score [1] |
RMSE Score [1] |
Seasonal Cycle Score [1] |
Overall Score [1] |
|||
|---|---|---|---|---|---|---|---|---|---|---|---|
| Benchmark | [-] | 1.11 | |||||||||
| h0 | [-] | 1.39 | 0.284 | 1.29 | 0.956 | 0.329 | 0.00 | 0.899 | 0.307 | ||
| h0a | [-] | 1.39 | 0.284 | 1.29 | 0.956 | 0.329 | 0.00 | 0.899 | 0.307 |
Download Data |
Period Mean (original grids) [mm d-1] |
Bias [mm d-1] |
RMSE [mm d-1] |
Phase Shift [months] |
Bias Score [1] |
RMSE Score [1] |
Seasonal Cycle Score [1] |
Overall Score [1] |
|||
|---|---|---|---|---|---|---|---|---|---|---|---|
| Benchmark | [-] | 1.29 | |||||||||
| h0 | [-] | 1.24 | -0.0467 | 1.79 | 0.917 | 0.383 | 0.0330 | 0.937 | 0.347 | ||
| h0a | [-] | 1.24 | -0.0467 | 1.79 | 0.917 | 0.383 | 0.0330 | 0.937 | 0.347 |
Download Data |
Period Mean (original grids) [mm d-1] |
Bias [mm d-1] |
RMSE [mm d-1] |
Phase Shift [months] |
Bias Score [1] |
RMSE Score [1] |
Seasonal Cycle Score [1] |
Overall Score [1] |
|||
|---|---|---|---|---|---|---|---|---|---|---|---|
| Benchmark | [-] | 6.63 | |||||||||
| h0 | [-] | 5.23 | -1.40 | 5.16 | 1.02 | 0.545 | 0.00107 | 0.933 | 0.370 | ||
| h0a | [-] | 5.23 | -1.40 | 5.16 | 1.02 | 0.545 | 0.00107 | 0.933 | 0.370 |
Download Data |
Period Mean (original grids) [mm d-1] |
Bias [mm d-1] |
RMSE [mm d-1] |
Phase Shift [months] |
Bias Score [1] |
RMSE Score [1] |
Seasonal Cycle Score [1] |
Overall Score [1] |
|||
|---|---|---|---|---|---|---|---|---|---|---|---|
| Benchmark | [-] | 3.88 | |||||||||
| h0 | [-] | 4.08 | 0.193 | 2.95 | 3.05 | 0.881 | 0.00 | 0.498 | 0.345 | ||
| h0a | [-] | 4.08 | 0.193 | 2.95 | 3.05 | 0.881 | 0.00 | 0.498 | 0.345 |
Download Data |
Period Mean (original grids) [mm d-1] |
Bias [mm d-1] |
RMSE [mm d-1] |
Phase Shift [months] |
Bias Score [1] |
RMSE Score [1] |
Seasonal Cycle Score [1] |
Overall Score [1] |
|||
|---|---|---|---|---|---|---|---|---|---|---|---|
| Benchmark | [-] | 0.989 | |||||||||
| h0 | [-] | 1.62 | 0.630 | 1.71 | 0.00 | 0.153 | 0.00 | 1.00 | 0.288 | ||
| h0a | [-] | 1.62 | 0.630 | 1.71 | 0.00 | 0.153 | 0.00 | 1.00 | 0.288 |
Temporally integrated period mean