Mean State
Download Data |
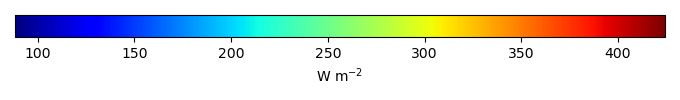
Period Mean (original grids) [W m-2] |
Model Period Mean (intersection) [W m-2] |
Benchmark Period Mean (intersection) [W m-2] |
Model Period Mean (complement) [W m-2] |
Benchmark Period Mean (complement) [W m-2] |
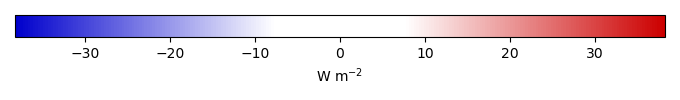
Bias [W m-2] |
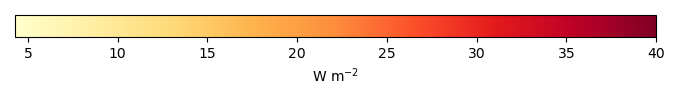
RMSE [W m-2] |
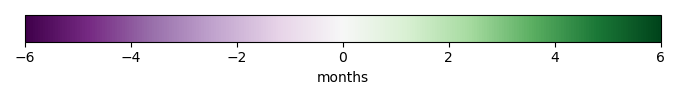
Phase Shift [months] |
Bias Score [1] |
RMSE Score [1] |
Seasonal Cycle Score [1] |
Spatial Distribution Score [1] |
Overall Score [1] |
|||
|---|---|---|---|---|---|---|---|---|---|---|---|---|---|---|---|---|
| Benchmark | [-] | 402. | ||||||||||||||
| h0 | [-] | 389. | 389. | 401. | 417. | -12.1 | 13.6 | 1.91 | 0.279 | 0.582 | 0.716 | 0.979 | 0.628 | |||
| h0a | [-] | 389. | 389. | 401. | 417. | -12.1 | 13.6 | 1.91 | 0.279 | 0.582 | 0.716 | 0.979 | 0.628 |
Download Data |
Period Mean (original grids) [W m-2] |
Model Period Mean (intersection) [W m-2] |
Benchmark Period Mean (intersection) [W m-2] |
Model Period Mean (complement) [W m-2] |
Benchmark Period Mean (complement) [W m-2] |
Bias [W m-2] |
RMSE [W m-2] |
Phase Shift [months] |
Bias Score [1] |
RMSE Score [1] |
Seasonal Cycle Score [1] |
Spatial Distribution Score [1] |
Overall Score [1] |
|||
|---|---|---|---|---|---|---|---|---|---|---|---|---|---|---|---|---|
| Benchmark | [-] | 389. | ||||||||||||||
| h0 | [-] | 378. | 378. | 389. | 405. | -11.0 | 15.1 | 1.12 | 0.631 | 0.772 | 0.866 | 0.963 | 0.801 | |||
| h0a | [-] | 378. | 378. | 389. | 405. | -11.0 | 15.1 | 1.12 | 0.631 | 0.772 | 0.866 | 0.963 | 0.801 |
Download Data |
Period Mean (original grids) [W m-2] |
Model Period Mean (intersection) [W m-2] |
Benchmark Period Mean (intersection) [W m-2] |
Model Period Mean (complement) [W m-2] |
Benchmark Period Mean (complement) [W m-2] |
Bias [W m-2] |
RMSE [W m-2] |
Phase Shift [months] |
Bias Score [1] |
RMSE Score [1] |
Seasonal Cycle Score [1] |
Spatial Distribution Score [1] |
Overall Score [1] |
|||
|---|---|---|---|---|---|---|---|---|---|---|---|---|---|---|---|---|
| Benchmark | [-] | 365. | ||||||||||||||
| h0 | [-] | 353. | 353. | 364. | 385. | -8.68 | 12.4 | 1.20 | 0.619 | 0.786 | 0.836 | 0.952 | 0.796 | |||
| h0a | [-] | 353. | 353. | 364. | 385. | -8.68 | 12.4 | 1.20 | 0.619 | 0.786 | 0.836 | 0.952 | 0.796 |
Download Data |
Period Mean (original grids) [W m-2] |
Model Period Mean (intersection) [W m-2] |
Benchmark Period Mean (intersection) [W m-2] |
Model Period Mean (complement) [W m-2] |
Benchmark Period Mean (complement) [W m-2] |
Bias [W m-2] |
RMSE [W m-2] |
Phase Shift [months] |
Bias Score [1] |
RMSE Score [1] |
Seasonal Cycle Score [1] |
Spatial Distribution Score [1] |
Overall Score [1] |
|||
|---|---|---|---|---|---|---|---|---|---|---|---|---|---|---|---|---|
| Benchmark | [-] | 241. | ||||||||||||||
| h0 | [-] | 227. | 227. | 240. | 259. | -9.31 | 17.0 | 0.113 | 0.840 | 0.812 | 0.992 | 0.982 | 0.888 | |||
| h0a | [-] | 227. | 227. | 240. | 259. | -9.31 | 17.0 | 0.113 | 0.840 | 0.812 | 0.992 | 0.982 | 0.888 |
Download Data |
Period Mean (original grids) [W m-2] |
Model Period Mean (intersection) [W m-2] |
Benchmark Period Mean (intersection) [W m-2] |
Model Period Mean (complement) [W m-2] |
Benchmark Period Mean (complement) [W m-2] |
Bias [W m-2] |
RMSE [W m-2] |
Phase Shift [months] |
Bias Score [1] |
RMSE Score [1] |
Seasonal Cycle Score [1] |
Spatial Distribution Score [1] |
Overall Score [1] |
|||
|---|---|---|---|---|---|---|---|---|---|---|---|---|---|---|---|---|
| Benchmark | [-] | 415. | ||||||||||||||
| h0 | [-] | 400. | 400. | 414. | 422. | -11.5 | 13.4 | 2.81 | 0.151 | 0.492 | 0.542 | 0.808 | 0.497 | |||
| h0a | [-] | 400. | 400. | 414. | 422. | -11.5 | 13.4 | 2.81 | 0.151 | 0.492 | 0.542 | 0.808 | 0.497 |
Download Data |
Period Mean (original grids) [W m-2] |
Model Period Mean (intersection) [W m-2] |
Benchmark Period Mean (intersection) [W m-2] |
Model Period Mean (complement) [W m-2] |
Benchmark Period Mean (complement) [W m-2] |
Bias [W m-2] |
RMSE [W m-2] |
Phase Shift [months] |
Bias Score [1] |
RMSE Score [1] |
Seasonal Cycle Score [1] |
Spatial Distribution Score [1] |
Overall Score [1] |
|||
|---|---|---|---|---|---|---|---|---|---|---|---|---|---|---|---|---|
| Benchmark | [-] | 264. | ||||||||||||||
| h0 | [-] | 261. | 261. | 264. | 285. | -3.08 | 11.0 | 0.0808 | 0.913 | 0.858 | 0.995 | 0.984 | 0.922 | |||
| h0a | [-] | 261. | 261. | 264. | 285. | -3.08 | 11.0 | 0.0808 | 0.913 | 0.858 | 0.995 | 0.984 | 0.922 |
Download Data |
Period Mean (original grids) [W m-2] |
Model Period Mean (intersection) [W m-2] |
Benchmark Period Mean (intersection) [W m-2] |
Model Period Mean (complement) [W m-2] |
Benchmark Period Mean (complement) [W m-2] |
Bias [W m-2] |
RMSE [W m-2] |
Phase Shift [months] |
Bias Score [1] |
RMSE Score [1] |
Seasonal Cycle Score [1] |
Spatial Distribution Score [1] |
Overall Score [1] |
|||
|---|---|---|---|---|---|---|---|---|---|---|---|---|---|---|---|---|
| Benchmark | [-] | 295. | ||||||||||||||
| h0 | [-] | 287. | 287. | 294. | 360. | -4.78 | 13.2 | 0.0981 | 0.818 | 0.847 | 0.992 | 0.985 | 0.898 | |||
| h0a | [-] | 287. | 287. | 294. | 360. | -4.78 | 13.2 | 0.0981 | 0.818 | 0.847 | 0.992 | 0.985 | 0.898 |
Download Data |
Period Mean (original grids) [W m-2] |
Model Period Mean (intersection) [W m-2] |
Benchmark Period Mean (intersection) [W m-2] |
Model Period Mean (complement) [W m-2] |
Benchmark Period Mean (complement) [W m-2] |
Bias [W m-2] |
RMSE [W m-2] |
Phase Shift [months] |
Bias Score [1] |
RMSE Score [1] |
Seasonal Cycle Score [1] |
Spatial Distribution Score [1] |
Overall Score [1] |
|||
|---|---|---|---|---|---|---|---|---|---|---|---|---|---|---|---|---|
| Benchmark | [-] | 386. | ||||||||||||||
| h0 | [-] | 364. | 364. | 384. | 417. | -14.7 | 18.9 | 0.794 | 0.585 | 0.778 | 0.907 | 0.990 | 0.808 | |||
| h0a | [-] | 364. | 364. | 384. | 417. | -14.7 | 18.9 | 0.794 | 0.585 | 0.778 | 0.907 | 0.990 | 0.808 |
Download Data |
Period Mean (original grids) [W m-2] |
Model Period Mean (intersection) [W m-2] |
Benchmark Period Mean (intersection) [W m-2] |
Model Period Mean (complement) [W m-2] |
Benchmark Period Mean (complement) [W m-2] |
Bias [W m-2] |
RMSE [W m-2] |
Phase Shift [months] |
Bias Score [1] |
RMSE Score [1] |
Seasonal Cycle Score [1] |
Spatial Distribution Score [1] |
Overall Score [1] |
|||
|---|---|---|---|---|---|---|---|---|---|---|---|---|---|---|---|---|
| Benchmark | [-] | 244. | ||||||||||||||
| h0 | [-] | 238. | 239. | 243. | 259. | -3.68 | 14.1 | 0.0531 | 0.907 | 0.805 | 0.996 | 1.00 | 0.903 | |||
| h0a | [-] | 238. | 239. | 243. | 259. | -3.68 | 14.1 | 0.0531 | 0.907 | 0.805 | 0.996 | 1.00 | 0.903 |
Download Data |
Period Mean (original grids) [W m-2] |
Model Period Mean (intersection) [W m-2] |
Benchmark Period Mean (intersection) [W m-2] |
Model Period Mean (complement) [W m-2] |
Benchmark Period Mean (complement) [W m-2] |
Bias [W m-2] |
RMSE [W m-2] |
Phase Shift [months] |
Bias Score [1] |
RMSE Score [1] |
Seasonal Cycle Score [1] |
Spatial Distribution Score [1] |
Overall Score [1] |
|||
|---|---|---|---|---|---|---|---|---|---|---|---|---|---|---|---|---|
| Benchmark | [-] | 351. | ||||||||||||||
| h0 | [-] | 346. | 346. | 351. | 361. | -3.63 | 8.65 | 0.559 | 0.829 | 0.833 | 0.963 | 0.989 | 0.889 | |||
| h0a | [-] | 346. | 346. | 351. | 361. | -3.63 | 8.65 | 0.559 | 0.829 | 0.833 | 0.963 | 0.989 | 0.889 |
Download Data |
Period Mean (original grids) [W m-2] |
Model Period Mean (intersection) [W m-2] |
Benchmark Period Mean (intersection) [W m-2] |
Model Period Mean (complement) [W m-2] |
Benchmark Period Mean (complement) [W m-2] |
Bias [W m-2] |
RMSE [W m-2] |
Phase Shift [months] |
Bias Score [1] |
RMSE Score [1] |
Seasonal Cycle Score [1] |
Spatial Distribution Score [1] |
Overall Score [1] |
|||
|---|---|---|---|---|---|---|---|---|---|---|---|---|---|---|---|---|
| Benchmark | [-] | 312. | ||||||||||||||
| h0 | [-] | 304. | 304. | 311. | 329. | -5.02 | 9.94 | 0.203 | 0.782 | 0.822 | 0.986 | 0.991 | 0.880 | |||
| h0a | [-] | 304. | 304. | 311. | 329. | -5.02 | 9.94 | 0.203 | 0.782 | 0.822 | 0.986 | 0.991 | 0.880 |
Download Data |
Period Mean (original grids) [W m-2] |
Model Period Mean (intersection) [W m-2] |
Benchmark Period Mean (intersection) [W m-2] |
Model Period Mean (complement) [W m-2] |
Benchmark Period Mean (complement) [W m-2] |
Bias [W m-2] |
RMSE [W m-2] |
Phase Shift [months] |
Bias Score [1] |
RMSE Score [1] |
Seasonal Cycle Score [1] |
Spatial Distribution Score [1] |
Overall Score [1] |
|||
|---|---|---|---|---|---|---|---|---|---|---|---|---|---|---|---|---|
| Benchmark | [-] | 315. | ||||||||||||||
| h0 | [-] | 304. | 304. | 314. | 357. | -7.11 | 13.4 | 0.664 | 0.686 | 0.763 | 0.917 | 0.999 | 0.826 | |||
| h0a | [-] | 304. | 304. | 314. | 357. | -7.11 | 13.4 | 0.664 | 0.686 | 0.763 | 0.917 | 0.999 | 0.826 |
Download Data |
Period Mean (original grids) [W m-2] |
Model Period Mean (intersection) [W m-2] |
Benchmark Period Mean (intersection) [W m-2] |
Model Period Mean (complement) [W m-2] |
Benchmark Period Mean (complement) [W m-2] |
Bias [W m-2] |
RMSE [W m-2] |
Phase Shift [months] |
Bias Score [1] |
RMSE Score [1] |
Seasonal Cycle Score [1] |
Spatial Distribution Score [1] |
Overall Score [1] |
|||
|---|---|---|---|---|---|---|---|---|---|---|---|---|---|---|---|---|
| Benchmark | [-] | 344. | ||||||||||||||
| h0 | [-] | 337. | 337. | 343. | 365. | -4.73 | 12.9 | 0.738 | 0.788 | 0.798 | 0.916 | 0.970 | 0.854 | |||
| h0a | [-] | 337. | 337. | 343. | 365. | -4.73 | 12.9 | 0.738 | 0.788 | 0.798 | 0.916 | 0.970 | 0.854 |
Download Data |
Period Mean (original grids) [W m-2] |
Model Period Mean (intersection) [W m-2] |
Benchmark Period Mean (intersection) [W m-2] |
Model Period Mean (complement) [W m-2] |
Benchmark Period Mean (complement) [W m-2] |
Bias [W m-2] |
RMSE [W m-2] |
Phase Shift [months] |
Bias Score [1] |
RMSE Score [1] |
Seasonal Cycle Score [1] |
Spatial Distribution Score [1] |
Overall Score [1] |
|||
|---|---|---|---|---|---|---|---|---|---|---|---|---|---|---|---|---|
| Benchmark | [-] | 246. | ||||||||||||||
| h0 | [-] | 234. | 234. | 245. | 256. | -11.1 | 17.1 | 0.136 | 0.803 | 0.797 | 0.991 | 0.998 | 0.877 | |||
| h0a | [-] | 234. | 234. | 245. | 256. | -11.1 | 17.1 | 0.136 | 0.803 | 0.797 | 0.991 | 0.998 | 0.877 |
Download Data |
Period Mean (original grids) [W m-2] |
Model Period Mean (intersection) [W m-2] |
Benchmark Period Mean (intersection) [W m-2] |
Model Period Mean (complement) [W m-2] |
Benchmark Period Mean (complement) [W m-2] |
Bias [W m-2] |
RMSE [W m-2] |
Phase Shift [months] |
Bias Score [1] |
RMSE Score [1] |
Seasonal Cycle Score [1] |
Spatial Distribution Score [1] |
Overall Score [1] |
|||
|---|---|---|---|---|---|---|---|---|---|---|---|---|---|---|---|---|
| Benchmark | [-] | 377. | ||||||||||||||
| h0 | [-] | 359. | 359. | 372. | 406. | -6.43 | 14.5 | 0.998 | 0.559 | 0.768 | 0.872 | 0.962 | 0.786 | |||
| h0a | [-] | 359. | 359. | 372. | 406. | -6.43 | 14.5 | 0.998 | 0.559 | 0.768 | 0.872 | 0.962 | 0.786 |
Download Data |
Period Mean (original grids) [W m-2] |
Model Period Mean (intersection) [W m-2] |
Benchmark Period Mean (intersection) [W m-2] |
Model Period Mean (complement) [W m-2] |
Benchmark Period Mean (complement) [W m-2] |
Bias [W m-2] |
RMSE [W m-2] |
Phase Shift [months] |
Bias Score [1] |
RMSE Score [1] |
Seasonal Cycle Score [1] |
Spatial Distribution Score [1] |
Overall Score [1] |
|||
|---|---|---|---|---|---|---|---|---|---|---|---|---|---|---|---|---|
| Benchmark | [-] | 332. | ||||||||||||||
| h0 | [-] | 328. | 329. | 331. | 367. | 0.663 | 10.3 | 0.146 | 0.916 | 0.819 | 0.990 | 0.999 | 0.909 | |||
| h0a | [-] | 328. | 329. | 331. | 367. | 0.663 | 10.3 | 0.146 | 0.916 | 0.819 | 0.990 | 0.999 | 0.909 |
Download Data |
Period Mean (original grids) [W m-2] |
Model Period Mean (intersection) [W m-2] |
Benchmark Period Mean (intersection) [W m-2] |
Model Period Mean (complement) [W m-2] |
Benchmark Period Mean (complement) [W m-2] |
Bias [W m-2] |
RMSE [W m-2] |
Phase Shift [months] |
Bias Score [1] |
RMSE Score [1] |
Seasonal Cycle Score [1] |
Spatial Distribution Score [1] |
Overall Score [1] |
|||
|---|---|---|---|---|---|---|---|---|---|---|---|---|---|---|---|---|
| Benchmark | [-] | 279. | ||||||||||||||
| h0 | [-] | 269. | 269. | 278. | 304. | -7.36 | 11.3 | 0.145 | 0.835 | 0.842 | 0.990 | 0.995 | 0.901 | |||
| h0a | [-] | 269. | 269. | 278. | 304. | -7.36 | 11.3 | 0.145 | 0.835 | 0.842 | 0.990 | 0.995 | 0.901 |
Download Data |
Period Mean (original grids) [W m-2] |
Model Period Mean (intersection) [W m-2] |
Benchmark Period Mean (intersection) [W m-2] |
Model Period Mean (complement) [W m-2] |
Benchmark Period Mean (complement) [W m-2] |
Bias [W m-2] |
RMSE [W m-2] |
Phase Shift [months] |
Bias Score [1] |
RMSE Score [1] |
Seasonal Cycle Score [1] |
Spatial Distribution Score [1] |
Overall Score [1] |
|||
|---|---|---|---|---|---|---|---|---|---|---|---|---|---|---|---|---|
| Benchmark | [-] | 295. | ||||||||||||||
| h0 | [-] | 292. | 293. | 295. | 325. | -1.30 | 9.63 | 0.185 | 0.843 | 0.836 | 0.988 | 1.00 | 0.900 | |||
| h0a | [-] | 292. | 293. | 295. | 325. | -1.30 | 9.63 | 0.185 | 0.843 | 0.836 | 0.988 | 1.00 | 0.900 |
Download Data |
Period Mean (original grids) [W m-2] |
Model Period Mean (intersection) [W m-2] |
Benchmark Period Mean (intersection) [W m-2] |
Model Period Mean (complement) [W m-2] |
Benchmark Period Mean (complement) [W m-2] |
Bias [W m-2] |
RMSE [W m-2] |
Phase Shift [months] |
Bias Score [1] |
RMSE Score [1] |
Seasonal Cycle Score [1] |
Spatial Distribution Score [1] |
Overall Score [1] |
|||
|---|---|---|---|---|---|---|---|---|---|---|---|---|---|---|---|---|
| Benchmark | [-] | 412. | ||||||||||||||
| h0 | [-] | 400. | 400. | 411. | 417. | -10.7 | 13.1 | 1.64 | 0.260 | 0.566 | 0.735 | 0.998 | 0.625 | |||
| h0a | [-] | 400. | 400. | 411. | 417. | -10.7 | 13.1 | 1.64 | 0.260 | 0.566 | 0.735 | 0.998 | 0.625 |
Download Data |
Period Mean (original grids) [W m-2] |
Model Period Mean (intersection) [W m-2] |
Benchmark Period Mean (intersection) [W m-2] |
Model Period Mean (complement) [W m-2] |
Benchmark Period Mean (complement) [W m-2] |
Bias [W m-2] |
RMSE [W m-2] |
Phase Shift [months] |
Bias Score [1] |
RMSE Score [1] |
Seasonal Cycle Score [1] |
Spatial Distribution Score [1] |
Overall Score [1] |
|||
|---|---|---|---|---|---|---|---|---|---|---|---|---|---|---|---|---|
| Benchmark | [-] | 378. | ||||||||||||||
| h0 | [-] | 373. | 372. | 378. | 374. | -4.87 | 12.5 | 1.05 | 0.641 | 0.730 | 0.874 | 0.953 | 0.785 | |||
| h0a | [-] | 373. | 372. | 378. | 374. | -4.87 | 12.5 | 1.05 | 0.641 | 0.730 | 0.874 | 0.953 | 0.785 |
Download Data |
Period Mean (original grids) [W m-2] |
Model Period Mean (intersection) [W m-2] |
Benchmark Period Mean (intersection) [W m-2] |
Model Period Mean (complement) [W m-2] |
Benchmark Period Mean (complement) [W m-2] |
Bias [W m-2] |
RMSE [W m-2] |
Phase Shift [months] |
Bias Score [1] |
RMSE Score [1] |
Seasonal Cycle Score [1] |
Spatial Distribution Score [1] |
Overall Score [1] |
|||
|---|---|---|---|---|---|---|---|---|---|---|---|---|---|---|---|---|
| Benchmark | [-] | 304. | ||||||||||||||
| h0 | [-] | 297. | 296. | 302. | 338. | -0.659 | 17.8 | 0.696 | 0.491 | 0.673 | 0.922 | 0.951 | 0.742 | |||
| h0a | [-] | 297. | 296. | 302. | 338. | -0.659 | 17.8 | 0.696 | 0.491 | 0.673 | 0.922 | 0.951 | 0.742 |
Temporally integrated period mean