Mean State
Download Data |
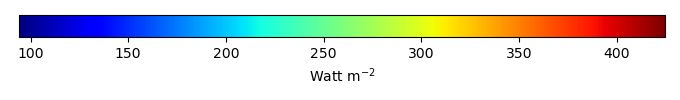
Period Mean (original grids) [Watt m-2] |
Model Period Mean (intersection) [Watt m-2] |
Benchmark Period Mean (intersection) [Watt m-2] |
Model Period Mean (complement) [Watt m-2] |
Benchmark Period Mean (complement) [Watt m-2] |
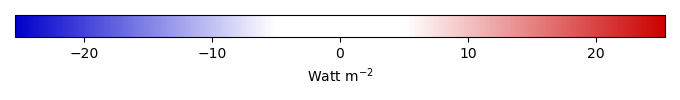
Bias [Watt m-2] |
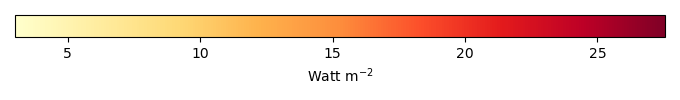
RMSE [Watt m-2] |
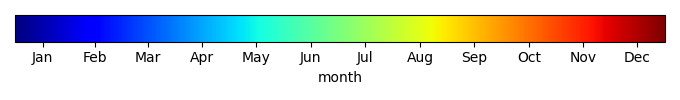
Phase Shift [months] |
Bias Score [1] |
RMSE Score [1] |
Seasonal Cycle Score [1] |
Spatial Distribution Score [1] |
Overall Score [1] |
|||
|---|---|---|---|---|---|---|---|---|---|---|---|---|---|---|---|---|
| Benchmark | [-] | 396. | ||||||||||||||
| h0 | [-] | 389. | 389. | 396. | 407. | -5.98 | 7.19 | 1.41 | 0.509 | 0.666 | 0.794 | 0.992 | 0.726 | |||
| h0a | [-] | 389. | 389. | 396. | 407. | -5.98 | 7.19 | 1.41 | 0.509 | 0.666 | 0.794 | 0.992 | 0.726 |
Download Data |
Period Mean (original grids) [Watt m-2] |
Model Period Mean (intersection) [Watt m-2] |
Benchmark Period Mean (intersection) [Watt m-2] |
Model Period Mean (complement) [Watt m-2] |
Benchmark Period Mean (complement) [Watt m-2] |
Bias [Watt m-2] |
RMSE [Watt m-2] |
Phase Shift [months] |
Bias Score [1] |
RMSE Score [1] |
Seasonal Cycle Score [1] |
Spatial Distribution Score [1] |
Overall Score [1] |
|||
|---|---|---|---|---|---|---|---|---|---|---|---|---|---|---|---|---|
| Benchmark | [-] | 383. | ||||||||||||||
| h0 | [-] | 379. | 379. | 383. | 399. | -3.94 | 9.85 | 0.917 | 0.778 | 0.748 | 0.897 | 0.999 | 0.834 | |||
| h0a | [-] | 379. | 379. | 383. | 399. | -3.94 | 9.85 | 0.917 | 0.778 | 0.748 | 0.897 | 0.999 | 0.834 |
Download Data |
Period Mean (original grids) [Watt m-2] |
Model Period Mean (intersection) [Watt m-2] |
Benchmark Period Mean (intersection) [Watt m-2] |
Model Period Mean (complement) [Watt m-2] |
Benchmark Period Mean (complement) [Watt m-2] |
Bias [Watt m-2] |
RMSE [Watt m-2] |
Phase Shift [months] |
Bias Score [1] |
RMSE Score [1] |
Seasonal Cycle Score [1] |
Spatial Distribution Score [1] |
Overall Score [1] |
|||
|---|---|---|---|---|---|---|---|---|---|---|---|---|---|---|---|---|
| Benchmark | [-] | 361. | ||||||||||||||
| h0 | [-] | 353. | 353. | 360. | 382. | -5.33 | 7.83 | 1.33 | 0.759 | 0.823 | 0.829 | 0.998 | 0.846 | |||
| h0a | [-] | 353. | 353. | 360. | 382. | -5.33 | 7.83 | 1.33 | 0.759 | 0.823 | 0.829 | 0.998 | 0.846 |
Download Data |
Period Mean (original grids) [Watt m-2] |
Model Period Mean (intersection) [Watt m-2] |
Benchmark Period Mean (intersection) [Watt m-2] |
Model Period Mean (complement) [Watt m-2] |
Benchmark Period Mean (complement) [Watt m-2] |
Bias [Watt m-2] |
RMSE [Watt m-2] |
Phase Shift [months] |
Bias Score [1] |
RMSE Score [1] |
Seasonal Cycle Score [1] |
Spatial Distribution Score [1] |
Overall Score [1] |
|||
|---|---|---|---|---|---|---|---|---|---|---|---|---|---|---|---|---|
| Benchmark | [-] | 239. | ||||||||||||||
| h0 | [-] | 227. | 227. | 238. | 249. | -8.62 | 11.3 | 0.0830 | 0.844 | 0.883 | 0.994 | 0.999 | 0.921 | |||
| h0a | [-] | 227. | 227. | 238. | 249. | -8.62 | 11.3 | 0.0830 | 0.844 | 0.883 | 0.994 | 0.999 | 0.921 |
Download Data |
Period Mean (original grids) [Watt m-2] |
Model Period Mean (intersection) [Watt m-2] |
Benchmark Period Mean (intersection) [Watt m-2] |
Model Period Mean (complement) [Watt m-2] |
Benchmark Period Mean (complement) [Watt m-2] |
Bias [Watt m-2] |
RMSE [Watt m-2] |
Phase Shift [months] |
Bias Score [1] |
RMSE Score [1] |
Seasonal Cycle Score [1] |
Spatial Distribution Score [1] |
Overall Score [1] |
|||
|---|---|---|---|---|---|---|---|---|---|---|---|---|---|---|---|---|
| Benchmark | [-] | 412. | ||||||||||||||
| h0 | [-] | 401. | 401. | 411. | 416. | -7.13 | 7.82 | 1.66 | 0.282 | 0.560 | 0.749 | 1.00 | 0.630 | |||
| h0a | [-] | 401. | 401. | 411. | 416. | -7.13 | 7.82 | 1.66 | 0.282 | 0.560 | 0.749 | 1.00 | 0.630 |
Download Data |
Period Mean (original grids) [Watt m-2] |
Model Period Mean (intersection) [Watt m-2] |
Benchmark Period Mean (intersection) [Watt m-2] |
Model Period Mean (complement) [Watt m-2] |
Benchmark Period Mean (complement) [Watt m-2] |
Bias [Watt m-2] |
RMSE [Watt m-2] |
Phase Shift [months] |
Bias Score [1] |
RMSE Score [1] |
Seasonal Cycle Score [1] |
Spatial Distribution Score [1] |
Overall Score [1] |
|||
|---|---|---|---|---|---|---|---|---|---|---|---|---|---|---|---|---|
| Benchmark | [-] | 264. | ||||||||||||||
| h0 | [-] | 261. | 260. | 264. | 278. | -3.22 | 7.16 | 0.0418 | 0.937 | 0.900 | 0.997 | 0.999 | 0.946 | |||
| h0a | [-] | 261. | 260. | 264. | 278. | -3.22 | 7.16 | 0.0418 | 0.937 | 0.900 | 0.997 | 0.999 | 0.946 |
Download Data |
Period Mean (original grids) [Watt m-2] |
Model Period Mean (intersection) [Watt m-2] |
Benchmark Period Mean (intersection) [Watt m-2] |
Model Period Mean (complement) [Watt m-2] |
Benchmark Period Mean (complement) [Watt m-2] |
Bias [Watt m-2] |
RMSE [Watt m-2] |
Phase Shift [months] |
Bias Score [1] |
RMSE Score [1] |
Seasonal Cycle Score [1] |
Spatial Distribution Score [1] |
Overall Score [1] |
|||
|---|---|---|---|---|---|---|---|---|---|---|---|---|---|---|---|---|
| Benchmark | [-] | 295. | ||||||||||||||
| h0 | [-] | 287. | 286. | 294. | 356. | -4.89 | 10.2 | 0.115 | 0.878 | 0.856 | 0.992 | 0.998 | 0.916 | |||
| h0a | [-] | 287. | 286. | 294. | 356. | -4.89 | 10.2 | 0.115 | 0.878 | 0.856 | 0.992 | 0.998 | 0.916 |
Download Data |
Period Mean (original grids) [Watt m-2] |
Model Period Mean (intersection) [Watt m-2] |
Benchmark Period Mean (intersection) [Watt m-2] |
Model Period Mean (complement) [Watt m-2] |
Benchmark Period Mean (complement) [Watt m-2] |
Bias [Watt m-2] |
RMSE [Watt m-2] |
Phase Shift [months] |
Bias Score [1] |
RMSE Score [1] |
Seasonal Cycle Score [1] |
Spatial Distribution Score [1] |
Overall Score [1] |
|||
|---|---|---|---|---|---|---|---|---|---|---|---|---|---|---|---|---|
| Benchmark | [-] | 378. | ||||||||||||||
| h0 | [-] | 364. | 365. | 376. | 410. | -6.31 | 9.42 | 0.379 | 0.729 | 0.829 | 0.964 | 0.998 | 0.870 | |||
| h0a | [-] | 364. | 365. | 376. | 410. | -6.31 | 9.42 | 0.379 | 0.729 | 0.829 | 0.964 | 0.998 | 0.870 |
Download Data |
Period Mean (original grids) [Watt m-2] |
Model Period Mean (intersection) [Watt m-2] |
Benchmark Period Mean (intersection) [Watt m-2] |
Model Period Mean (complement) [Watt m-2] |
Benchmark Period Mean (complement) [Watt m-2] |
Bias [Watt m-2] |
RMSE [Watt m-2] |
Phase Shift [months] |
Bias Score [1] |
RMSE Score [1] |
Seasonal Cycle Score [1] |
Spatial Distribution Score [1] |
Overall Score [1] |
|||
|---|---|---|---|---|---|---|---|---|---|---|---|---|---|---|---|---|
| Benchmark | [-] | 243. | ||||||||||||||
| h0 | [-] | 238. | 239. | 243. | 250. | -3.74 | 8.27 | 0.0280 | 0.923 | 0.868 | 0.998 | 0.988 | 0.929 | |||
| h0a | [-] | 238. | 239. | 243. | 250. | -3.74 | 8.27 | 0.0280 | 0.923 | 0.868 | 0.998 | 0.988 | 0.929 |
Download Data |
Period Mean (original grids) [Watt m-2] |
Model Period Mean (intersection) [Watt m-2] |
Benchmark Period Mean (intersection) [Watt m-2] |
Model Period Mean (complement) [Watt m-2] |
Benchmark Period Mean (complement) [Watt m-2] |
Bias [Watt m-2] |
RMSE [Watt m-2] |
Phase Shift [months] |
Bias Score [1] |
RMSE Score [1] |
Seasonal Cycle Score [1] |
Spatial Distribution Score [1] |
Overall Score [1] |
|||
|---|---|---|---|---|---|---|---|---|---|---|---|---|---|---|---|---|
| Benchmark | [-] | 352. | ||||||||||||||
| h0 | [-] | 346. | 346. | 351. | 358. | -4.26 | 8.22 | 0.503 | 0.841 | 0.834 | 0.962 | 0.999 | 0.894 | |||
| h0a | [-] | 346. | 346. | 351. | 358. | -4.26 | 8.22 | 0.503 | 0.841 | 0.834 | 0.962 | 0.999 | 0.894 |
Download Data |
Period Mean (original grids) [Watt m-2] |
Model Period Mean (intersection) [Watt m-2] |
Benchmark Period Mean (intersection) [Watt m-2] |
Model Period Mean (complement) [Watt m-2] |
Benchmark Period Mean (complement) [Watt m-2] |
Bias [Watt m-2] |
RMSE [Watt m-2] |
Phase Shift [months] |
Bias Score [1] |
RMSE Score [1] |
Seasonal Cycle Score [1] |
Spatial Distribution Score [1] |
Overall Score [1] |
|||
|---|---|---|---|---|---|---|---|---|---|---|---|---|---|---|---|---|
| Benchmark | [-] | 310. | ||||||||||||||
| h0 | [-] | 302. | 302. | 309. | 325. | -3.48 | 7.14 | 0.267 | 0.862 | 0.851 | 0.982 | 0.994 | 0.908 | |||
| h0a | [-] | 302. | 302. | 309. | 325. | -3.48 | 7.14 | 0.267 | 0.862 | 0.851 | 0.982 | 0.994 | 0.908 |
Download Data |
Period Mean (original grids) [Watt m-2] |
Model Period Mean (intersection) [Watt m-2] |
Benchmark Period Mean (intersection) [Watt m-2] |
Model Period Mean (complement) [Watt m-2] |
Benchmark Period Mean (complement) [Watt m-2] |
Bias [Watt m-2] |
RMSE [Watt m-2] |
Phase Shift [months] |
Bias Score [1] |
RMSE Score [1] |
Seasonal Cycle Score [1] |
Spatial Distribution Score [1] |
Overall Score [1] |
|||
|---|---|---|---|---|---|---|---|---|---|---|---|---|---|---|---|---|
| Benchmark | [-] | 313. | ||||||||||||||
| h0 | [-] | 304. | 304. | 311. | 351. | -4.54 | 9.12 | 0.614 | 0.776 | 0.796 | 0.928 | 0.999 | 0.859 | |||
| h0a | [-] | 304. | 304. | 311. | 351. | -4.54 | 9.12 | 0.614 | 0.776 | 0.796 | 0.928 | 0.999 | 0.859 |
Download Data |
Period Mean (original grids) [Watt m-2] |
Model Period Mean (intersection) [Watt m-2] |
Benchmark Period Mean (intersection) [Watt m-2] |
Model Period Mean (complement) [Watt m-2] |
Benchmark Period Mean (complement) [Watt m-2] |
Bias [Watt m-2] |
RMSE [Watt m-2] |
Phase Shift [months] |
Bias Score [1] |
RMSE Score [1] |
Seasonal Cycle Score [1] |
Spatial Distribution Score [1] |
Overall Score [1] |
|||
|---|---|---|---|---|---|---|---|---|---|---|---|---|---|---|---|---|
| Benchmark | [-] | 342. | ||||||||||||||
| h0 | [-] | 338. | 338. | 341. | 356. | -1.95 | 11.1 | 0.809 | 0.824 | 0.770 | 0.909 | 0.990 | 0.853 | |||
| h0a | [-] | 338. | 338. | 341. | 356. | -1.95 | 11.1 | 0.809 | 0.824 | 0.770 | 0.909 | 0.990 | 0.853 |
Download Data |
Period Mean (original grids) [Watt m-2] |
Model Period Mean (intersection) [Watt m-2] |
Benchmark Period Mean (intersection) [Watt m-2] |
Model Period Mean (complement) [Watt m-2] |
Benchmark Period Mean (complement) [Watt m-2] |
Bias [Watt m-2] |
RMSE [Watt m-2] |
Phase Shift [months] |
Bias Score [1] |
RMSE Score [1] |
Seasonal Cycle Score [1] |
Spatial Distribution Score [1] |
Overall Score [1] |
|||
|---|---|---|---|---|---|---|---|---|---|---|---|---|---|---|---|---|
| Benchmark | [-] | 244. | ||||||||||||||
| h0 | [-] | 234. | 234. | 244. | 251. | -9.80 | 12.0 | 0.115 | 0.809 | 0.874 | 0.992 | 0.998 | 0.909 | |||
| h0a | [-] | 234. | 234. | 244. | 251. | -9.80 | 12.0 | 0.115 | 0.809 | 0.874 | 0.992 | 0.998 | 0.909 |
Download Data |
Period Mean (original grids) [Watt m-2] |
Model Period Mean (intersection) [Watt m-2] |
Benchmark Period Mean (intersection) [Watt m-2] |
Model Period Mean (complement) [Watt m-2] |
Benchmark Period Mean (complement) [Watt m-2] |
Bias [Watt m-2] |
RMSE [Watt m-2] |
Phase Shift [months] |
Bias Score [1] |
RMSE Score [1] |
Seasonal Cycle Score [1] |
Spatial Distribution Score [1] |
Overall Score [1] |
|||
|---|---|---|---|---|---|---|---|---|---|---|---|---|---|---|---|---|
| Benchmark | [-] | 372. | ||||||||||||||
| h0 | [-] | 361. | 360. | 368. | 398. | -0.222 | 6.87 | 0.784 | 0.776 | 0.820 | 0.904 | 0.994 | 0.863 | |||
| h0a | [-] | 361. | 360. | 368. | 398. | -0.222 | 6.87 | 0.784 | 0.776 | 0.820 | 0.904 | 0.994 | 0.863 |
Download Data |
Period Mean (original grids) [Watt m-2] |
Model Period Mean (intersection) [Watt m-2] |
Benchmark Period Mean (intersection) [Watt m-2] |
Model Period Mean (complement) [Watt m-2] |
Benchmark Period Mean (complement) [Watt m-2] |
Bias [Watt m-2] |
RMSE [Watt m-2] |
Phase Shift [months] |
Bias Score [1] |
RMSE Score [1] |
Seasonal Cycle Score [1] |
Spatial Distribution Score [1] |
Overall Score [1] |
|||
|---|---|---|---|---|---|---|---|---|---|---|---|---|---|---|---|---|
| Benchmark | [-] | 332. | ||||||||||||||
| h0 | [-] | 330. | 330. | 331. | 364. | 1.21 | 7.11 | 0.202 | 0.938 | 0.856 | 0.986 | 0.999 | 0.927 | |||
| h0a | [-] | 330. | 330. | 331. | 364. | 1.21 | 7.11 | 0.202 | 0.938 | 0.856 | 0.986 | 0.999 | 0.927 |
Download Data |
Period Mean (original grids) [Watt m-2] |
Model Period Mean (intersection) [Watt m-2] |
Benchmark Period Mean (intersection) [Watt m-2] |
Model Period Mean (complement) [Watt m-2] |
Benchmark Period Mean (complement) [Watt m-2] |
Bias [Watt m-2] |
RMSE [Watt m-2] |
Phase Shift [months] |
Bias Score [1] |
RMSE Score [1] |
Seasonal Cycle Score [1] |
Spatial Distribution Score [1] |
Overall Score [1] |
|||
|---|---|---|---|---|---|---|---|---|---|---|---|---|---|---|---|---|
| Benchmark | [-] | 278. | ||||||||||||||
| h0 | [-] | 270. | 270. | 277. | 301. | -5.63 | 8.69 | 0.264 | 0.861 | 0.870 | 0.982 | 0.959 | 0.909 | |||
| h0a | [-] | 270. | 270. | 277. | 301. | -5.63 | 8.69 | 0.264 | 0.861 | 0.870 | 0.982 | 0.959 | 0.909 |
Download Data |
Period Mean (original grids) [Watt m-2] |
Model Period Mean (intersection) [Watt m-2] |
Benchmark Period Mean (intersection) [Watt m-2] |
Model Period Mean (complement) [Watt m-2] |
Benchmark Period Mean (complement) [Watt m-2] |
Bias [Watt m-2] |
RMSE [Watt m-2] |
Phase Shift [months] |
Bias Score [1] |
RMSE Score [1] |
Seasonal Cycle Score [1] |
Spatial Distribution Score [1] |
Overall Score [1] |
|||
|---|---|---|---|---|---|---|---|---|---|---|---|---|---|---|---|---|
| Benchmark | [-] | 296. | ||||||||||||||
| h0 | [-] | 294. | 296. | 295. | 323. | 1.00 | 7.03 | 0.622 | 0.891 | 0.843 | 0.958 | 1.00 | 0.907 | |||
| h0a | [-] | 294. | 296. | 295. | 323. | 1.00 | 7.03 | 0.622 | 0.891 | 0.843 | 0.958 | 1.00 | 0.907 |
Download Data |
Period Mean (original grids) [Watt m-2] |
Model Period Mean (intersection) [Watt m-2] |
Benchmark Period Mean (intersection) [Watt m-2] |
Model Period Mean (complement) [Watt m-2] |
Benchmark Period Mean (complement) [Watt m-2] |
Bias [Watt m-2] |
RMSE [Watt m-2] |
Phase Shift [months] |
Bias Score [1] |
RMSE Score [1] |
Seasonal Cycle Score [1] |
Spatial Distribution Score [1] |
Overall Score [1] |
|||
|---|---|---|---|---|---|---|---|---|---|---|---|---|---|---|---|---|
| Benchmark | [-] | 405. | ||||||||||||||
| h0 | [-] | 401. | 401. | 404. | 410. | -2.98 | 5.26 | 1.74 | 0.643 | 0.614 | 0.755 | 0.994 | 0.724 | |||
| h0a | [-] | 401. | 401. | 404. | 410. | -2.98 | 5.26 | 1.74 | 0.643 | 0.614 | 0.755 | 0.994 | 0.724 |
Download Data |
Period Mean (original grids) [Watt m-2] |
Model Period Mean (intersection) [Watt m-2] |
Benchmark Period Mean (intersection) [Watt m-2] |
Model Period Mean (complement) [Watt m-2] |
Benchmark Period Mean (complement) [Watt m-2] |
Bias [Watt m-2] |
RMSE [Watt m-2] |
Phase Shift [months] |
Bias Score [1] |
RMSE Score [1] |
Seasonal Cycle Score [1] |
Spatial Distribution Score [1] |
Overall Score [1] |
|||
|---|---|---|---|---|---|---|---|---|---|---|---|---|---|---|---|---|
| Benchmark | [-] | 375. | ||||||||||||||
| h0 | [-] | 373. | 373. | 375. | 373. | -1.93 | 9.65 | 1.26 | 0.757 | 0.728 | 0.847 | 0.994 | 0.811 | |||
| h0a | [-] | 373. | 373. | 375. | 373. | -1.93 | 9.65 | 1.26 | 0.757 | 0.728 | 0.847 | 0.994 | 0.811 |
Download Data |
Period Mean (original grids) [Watt m-2] |
Model Period Mean (intersection) [Watt m-2] |
Benchmark Period Mean (intersection) [Watt m-2] |
Model Period Mean (complement) [Watt m-2] |
Benchmark Period Mean (complement) [Watt m-2] |
Bias [Watt m-2] |
RMSE [Watt m-2] |
Phase Shift [months] |
Bias Score [1] |
RMSE Score [1] |
Seasonal Cycle Score [1] |
Spatial Distribution Score [1] |
Overall Score [1] |
|||
|---|---|---|---|---|---|---|---|---|---|---|---|---|---|---|---|---|
| Benchmark | [-] | 306. | ||||||||||||||
| h0 | [-] | 297. | 296. | 304. | 334. | -2.79 | 12.2 | 0.840 | 0.646 | 0.681 | 0.902 | 0.998 | 0.781 | |||
| h0a | [-] | 297. | 296. | 304. | 334. | -2.79 | 12.2 | 0.840 | 0.646 | 0.681 | 0.902 | 0.998 | 0.781 |
Temporally integrated period mean