Mean State
Download Data |
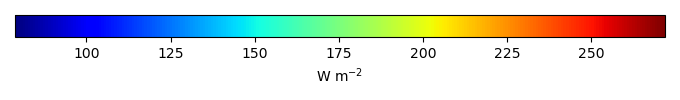
Period Mean (original grids) [W m-2] |
Model Period Mean (intersection) [W m-2] |
Benchmark Period Mean (intersection) [W m-2] |
Model Period Mean (complement) [W m-2] |
Benchmark Period Mean (complement) [W m-2] |
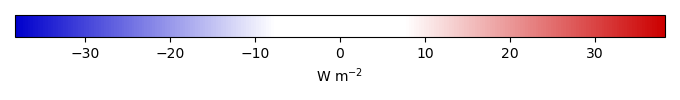
Bias [W m-2] |
RMSE [W m-2] |
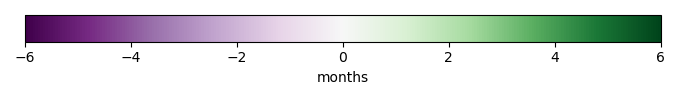
Phase Shift [months] |
Bias Score [1] |
RMSE Score [1] |
Seasonal Cycle Score [1] |
Spatial Distribution Score [1] |
Overall Score [1] |
|||
|---|---|---|---|---|---|---|---|---|---|---|---|---|---|---|---|---|
| Benchmark | [-] | 215. | ||||||||||||||
| h0 | [-] | 216. | 216. | 214. | 220. | 2.51 | 11.7 | 0.950 | 0.741 | 0.657 | 0.867 | 0.975 | 0.779 | |||
| h0a | [-] | 216. | 216. | 214. | 220. | 2.51 | 11.7 | 0.950 | 0.741 | 0.657 | 0.867 | 0.975 | 0.779 |
Download Data |
Period Mean (original grids) [W m-2] |
Model Period Mean (intersection) [W m-2] |
Benchmark Period Mean (intersection) [W m-2] |
Model Period Mean (complement) [W m-2] |
Benchmark Period Mean (complement) [W m-2] |
Bias [W m-2] |
RMSE [W m-2] |
Phase Shift [months] |
Bias Score [1] |
RMSE Score [1] |
Seasonal Cycle Score [1] |
Spatial Distribution Score [1] |
Overall Score [1] |
|||
|---|---|---|---|---|---|---|---|---|---|---|---|---|---|---|---|---|
| Benchmark | [-] | 242. | ||||||||||||||
| h0 | [-] | 243. | 243. | 242. | 227. | 1.04 | 11.5 | 0.611 | 0.752 | 0.696 | 0.943 | 0.954 | 0.808 | |||
| h0a | [-] | 243. | 243. | 242. | 227. | 1.04 | 11.5 | 0.611 | 0.752 | 0.696 | 0.943 | 0.954 | 0.808 |
Download Data |
Period Mean (original grids) [W m-2] |
Model Period Mean (intersection) [W m-2] |
Benchmark Period Mean (intersection) [W m-2] |
Model Period Mean (complement) [W m-2] |
Benchmark Period Mean (complement) [W m-2] |
Bias [W m-2] |
RMSE [W m-2] |
Phase Shift [months] |
Bias Score [1] |
RMSE Score [1] |
Seasonal Cycle Score [1] |
Spatial Distribution Score [1] |
Overall Score [1] |
|||
|---|---|---|---|---|---|---|---|---|---|---|---|---|---|---|---|---|
| Benchmark | [-] | 234. | ||||||||||||||
| h0 | [-] | 234. | 234. | 234. | 235. | -0.366 | 11.4 | 0.861 | 0.799 | 0.731 | 0.896 | 0.966 | 0.825 | |||
| h0a | [-] | 234. | 234. | 234. | 235. | -0.366 | 11.4 | 0.861 | 0.799 | 0.731 | 0.896 | 0.966 | 0.825 |
Download Data |
Period Mean (original grids) [W m-2] |
Model Period Mean (intersection) [W m-2] |
Benchmark Period Mean (intersection) [W m-2] |
Model Period Mean (complement) [W m-2] |
Benchmark Period Mean (complement) [W m-2] |
Bias [W m-2] |
RMSE [W m-2] |
Phase Shift [months] |
Bias Score [1] |
RMSE Score [1] |
Seasonal Cycle Score [1] |
Spatial Distribution Score [1] |
Overall Score [1] |
|||
|---|---|---|---|---|---|---|---|---|---|---|---|---|---|---|---|---|
| Benchmark | [-] | 109. | ||||||||||||||
| h0 | [-] | 112. | 112. | 109. | 104. | 2.37 | 20.3 | 0.801 | 0.960 | 0.800 | 0.945 | 0.997 | 0.900 | |||
| h0a | [-] | 112. | 112. | 109. | 104. | 2.37 | 20.3 | 0.801 | 0.960 | 0.800 | 0.945 | 0.997 | 0.900 |
Download Data |
Period Mean (original grids) [W m-2] |
Model Period Mean (intersection) [W m-2] |
Benchmark Period Mean (intersection) [W m-2] |
Model Period Mean (complement) [W m-2] |
Benchmark Period Mean (complement) [W m-2] |
Bias [W m-2] |
RMSE [W m-2] |
Phase Shift [months] |
Bias Score [1] |
RMSE Score [1] |
Seasonal Cycle Score [1] |
Spatial Distribution Score [1] |
Overall Score [1] |
|||
|---|---|---|---|---|---|---|---|---|---|---|---|---|---|---|---|---|
| Benchmark | [-] | 209. | ||||||||||||||
| h0 | [-] | 213. | 213. | 207. | 218. | 8.81 | 13.3 | 0.916 | 0.624 | 0.680 | 0.876 | 1.00 | 0.772 | |||
| h0a | [-] | 213. | 213. | 207. | 218. | 8.81 | 13.3 | 0.916 | 0.624 | 0.680 | 0.876 | 1.00 | 0.772 |
Download Data |
Period Mean (original grids) [W m-2] |
Model Period Mean (intersection) [W m-2] |
Benchmark Period Mean (intersection) [W m-2] |
Model Period Mean (complement) [W m-2] |
Benchmark Period Mean (complement) [W m-2] |
Bias [W m-2] |
RMSE [W m-2] |
Phase Shift [months] |
Bias Score [1] |
RMSE Score [1] |
Seasonal Cycle Score [1] |
Spatial Distribution Score [1] |
Overall Score [1] |
|||
|---|---|---|---|---|---|---|---|---|---|---|---|---|---|---|---|---|
| Benchmark | [-] | 125. | ||||||||||||||
| h0 | [-] | 127. | 127. | 125. | 131. | 1.98 | 10.3 | 0.268 | 0.952 | 0.888 | 0.979 | 0.972 | 0.936 | |||
| h0a | [-] | 127. | 127. | 125. | 131. | 1.98 | 10.3 | 0.268 | 0.952 | 0.888 | 0.979 | 0.972 | 0.936 |
Download Data |
Period Mean (original grids) [W m-2] |
Model Period Mean (intersection) [W m-2] |
Benchmark Period Mean (intersection) [W m-2] |
Model Period Mean (complement) [W m-2] |
Benchmark Period Mean (complement) [W m-2] |
Bias [W m-2] |
RMSE [W m-2] |
Phase Shift [months] |
Bias Score [1] |
RMSE Score [1] |
Seasonal Cycle Score [1] |
Spatial Distribution Score [1] |
Overall Score [1] |
|||
|---|---|---|---|---|---|---|---|---|---|---|---|---|---|---|---|---|
| Benchmark | [-] | 174. | ||||||||||||||
| h0 | [-] | 172. | 172. | 174. | 163. | -1.90 | 13.4 | 0.349 | 0.881 | 0.847 | 0.969 | 0.992 | 0.907 | |||
| h0a | [-] | 172. | 172. | 174. | 163. | -1.90 | 13.4 | 0.349 | 0.881 | 0.847 | 0.969 | 0.992 | 0.907 |
Download Data |
Period Mean (original grids) [W m-2] |
Model Period Mean (intersection) [W m-2] |
Benchmark Period Mean (intersection) [W m-2] |
Model Period Mean (complement) [W m-2] |
Benchmark Period Mean (complement) [W m-2] |
Bias [W m-2] |
RMSE [W m-2] |
Phase Shift [months] |
Bias Score [1] |
RMSE Score [1] |
Seasonal Cycle Score [1] |
Spatial Distribution Score [1] |
Overall Score [1] |
|||
|---|---|---|---|---|---|---|---|---|---|---|---|---|---|---|---|---|
| Benchmark | [-] | 209. | ||||||||||||||
| h0 | [-] | 212. | 212. | 208. | 218. | 5.23 | 15.3 | 0.392 | 0.770 | 0.746 | 0.968 | 0.939 | 0.834 | |||
| h0a | [-] | 212. | 212. | 208. | 218. | 5.23 | 15.3 | 0.392 | 0.770 | 0.746 | 0.968 | 0.939 | 0.834 |
Download Data |
Period Mean (original grids) [W m-2] |
Model Period Mean (intersection) [W m-2] |
Benchmark Period Mean (intersection) [W m-2] |
Model Period Mean (complement) [W m-2] |
Benchmark Period Mean (complement) [W m-2] |
Bias [W m-2] |
RMSE [W m-2] |
Phase Shift [months] |
Bias Score [1] |
RMSE Score [1] |
Seasonal Cycle Score [1] |
Spatial Distribution Score [1] |
Overall Score [1] |
|||
|---|---|---|---|---|---|---|---|---|---|---|---|---|---|---|---|---|
| Benchmark | [-] | 97.5 | ||||||||||||||
| h0 | [-] | 98.8 | 99.0 | 97.9 | 87.2 | 0.170 | 19.0 | 0.722 | 0.966 | 0.812 | 0.947 | 0.998 | 0.907 | |||
| h0a | [-] | 98.8 | 99.0 | 97.9 | 87.2 | 0.170 | 19.0 | 0.722 | 0.966 | 0.812 | 0.947 | 0.998 | 0.907 |
Download Data |
Period Mean (original grids) [W m-2] |
Model Period Mean (intersection) [W m-2] |
Benchmark Period Mean (intersection) [W m-2] |
Model Period Mean (complement) [W m-2] |
Benchmark Period Mean (complement) [W m-2] |
Bias [W m-2] |
RMSE [W m-2] |
Phase Shift [months] |
Bias Score [1] |
RMSE Score [1] |
Seasonal Cycle Score [1] |
Spatial Distribution Score [1] |
Overall Score [1] |
|||
|---|---|---|---|---|---|---|---|---|---|---|---|---|---|---|---|---|
| Benchmark | [-] | 236. | ||||||||||||||
| h0 | [-] | 230. | 230. | 237. | 215. | -9.00 | 13.2 | 0.398 | 0.837 | 0.891 | 0.972 | 0.999 | 0.918 | |||
| h0a | [-] | 230. | 230. | 237. | 215. | -9.00 | 13.2 | 0.398 | 0.837 | 0.891 | 0.972 | 0.999 | 0.918 |
Download Data |
Period Mean (original grids) [W m-2] |
Model Period Mean (intersection) [W m-2] |
Benchmark Period Mean (intersection) [W m-2] |
Model Period Mean (complement) [W m-2] |
Benchmark Period Mean (complement) [W m-2] |
Bias [W m-2] |
RMSE [W m-2] |
Phase Shift [months] |
Bias Score [1] |
RMSE Score [1] |
Seasonal Cycle Score [1] |
Spatial Distribution Score [1] |
Overall Score [1] |
|||
|---|---|---|---|---|---|---|---|---|---|---|---|---|---|---|---|---|
| Benchmark | [-] | 140. | ||||||||||||||
| h0 | [-] | 135. | 135. | 139. | 157. | -2.06 | 9.75 | 0.205 | 0.928 | 0.912 | 0.986 | 0.992 | 0.946 | |||
| h0a | [-] | 135. | 135. | 139. | 157. | -2.06 | 9.75 | 0.205 | 0.928 | 0.912 | 0.986 | 0.992 | 0.946 |
Download Data |
Period Mean (original grids) [W m-2] |
Model Period Mean (intersection) [W m-2] |
Benchmark Period Mean (intersection) [W m-2] |
Model Period Mean (complement) [W m-2] |
Benchmark Period Mean (complement) [W m-2] |
Bias [W m-2] |
RMSE [W m-2] |
Phase Shift [months] |
Bias Score [1] |
RMSE Score [1] |
Seasonal Cycle Score [1] |
Spatial Distribution Score [1] |
Overall Score [1] |
|||
|---|---|---|---|---|---|---|---|---|---|---|---|---|---|---|---|---|
| Benchmark | [-] | 186. | ||||||||||||||
| h0 | [-] | 184. | 184. | 186. | 190. | -2.49 | 14.7 | 0.457 | 0.851 | 0.817 | 0.954 | 0.998 | 0.887 | |||
| h0a | [-] | 184. | 184. | 186. | 190. | -2.49 | 14.7 | 0.457 | 0.851 | 0.817 | 0.954 | 0.998 | 0.887 |
Download Data |
Period Mean (original grids) [W m-2] |
Model Period Mean (intersection) [W m-2] |
Benchmark Period Mean (intersection) [W m-2] |
Model Period Mean (complement) [W m-2] |
Benchmark Period Mean (complement) [W m-2] |
Bias [W m-2] |
RMSE [W m-2] |
Phase Shift [months] |
Bias Score [1] |
RMSE Score [1] |
Seasonal Cycle Score [1] |
Spatial Distribution Score [1] |
Overall Score [1] |
|||
|---|---|---|---|---|---|---|---|---|---|---|---|---|---|---|---|---|
| Benchmark | [-] | 249. | ||||||||||||||
| h0 | [-] | 242. | 241. | 249. | 232. | -8.53 | 14.4 | 0.323 | 0.818 | 0.849 | 0.974 | 0.997 | 0.897 | |||
| h0a | [-] | 242. | 241. | 249. | 232. | -8.53 | 14.4 | 0.323 | 0.818 | 0.849 | 0.974 | 0.997 | 0.897 |
Download Data |
Period Mean (original grids) [W m-2] |
Model Period Mean (intersection) [W m-2] |
Benchmark Period Mean (intersection) [W m-2] |
Model Period Mean (complement) [W m-2] |
Benchmark Period Mean (complement) [W m-2] |
Bias [W m-2] |
RMSE [W m-2] |
Phase Shift [months] |
Bias Score [1] |
RMSE Score [1] |
Seasonal Cycle Score [1] |
Spatial Distribution Score [1] |
Overall Score [1] |
|||
|---|---|---|---|---|---|---|---|---|---|---|---|---|---|---|---|---|
| Benchmark | [-] | 112. | ||||||||||||||
| h0 | [-] | 114. | 114. | 112. | 112. | 0.553 | 23.2 | 0.553 | 0.949 | 0.786 | 0.957 | 0.987 | 0.893 | |||
| h0a | [-] | 114. | 114. | 112. | 112. | 0.553 | 23.2 | 0.553 | 0.949 | 0.786 | 0.957 | 0.987 | 0.893 |
Download Data |
Period Mean (original grids) [W m-2] |
Model Period Mean (intersection) [W m-2] |
Benchmark Period Mean (intersection) [W m-2] |
Model Period Mean (complement) [W m-2] |
Benchmark Period Mean (complement) [W m-2] |
Bias [W m-2] |
RMSE [W m-2] |
Phase Shift [months] |
Bias Score [1] |
RMSE Score [1] |
Seasonal Cycle Score [1] |
Spatial Distribution Score [1] |
Overall Score [1] |
|||
|---|---|---|---|---|---|---|---|---|---|---|---|---|---|---|---|---|
| Benchmark | [-] | 229. | ||||||||||||||
| h0 | [-] | 228. | 229. | 229. | 233. | 1.40 | 13.7 | 0.463 | 0.756 | 0.810 | 0.955 | 0.950 | 0.856 | |||
| h0a | [-] | 228. | 229. | 229. | 233. | 1.40 | 13.7 | 0.463 | 0.756 | 0.810 | 0.955 | 0.950 | 0.856 |
Download Data |
Period Mean (original grids) [W m-2] |
Model Period Mean (intersection) [W m-2] |
Benchmark Period Mean (intersection) [W m-2] |
Model Period Mean (complement) [W m-2] |
Benchmark Period Mean (complement) [W m-2] |
Bias [W m-2] |
RMSE [W m-2] |
Phase Shift [months] |
Bias Score [1] |
RMSE Score [1] |
Seasonal Cycle Score [1] |
Spatial Distribution Score [1] |
Overall Score [1] |
|||
|---|---|---|---|---|---|---|---|---|---|---|---|---|---|---|---|---|
| Benchmark | [-] | 177. | ||||||||||||||
| h0 | [-] | 171. | 171. | 176. | 199. | -2.96 | 8.17 | 0.373 | 0.929 | 0.904 | 0.975 | 0.998 | 0.942 | |||
| h0a | [-] | 171. | 171. | 176. | 199. | -2.96 | 8.17 | 0.373 | 0.929 | 0.904 | 0.975 | 0.998 | 0.942 |
Download Data |
Period Mean (original grids) [W m-2] |
Model Period Mean (intersection) [W m-2] |
Benchmark Period Mean (intersection) [W m-2] |
Model Period Mean (complement) [W m-2] |
Benchmark Period Mean (complement) [W m-2] |
Bias [W m-2] |
RMSE [W m-2] |
Phase Shift [months] |
Bias Score [1] |
RMSE Score [1] |
Seasonal Cycle Score [1] |
Spatial Distribution Score [1] |
Overall Score [1] |
|||
|---|---|---|---|---|---|---|---|---|---|---|---|---|---|---|---|---|
| Benchmark | [-] | 134. | ||||||||||||||
| h0 | [-] | 138. | 138. | 134. | 132. | 3.16 | 10.6 | 0.260 | 0.936 | 0.896 | 0.982 | 0.938 | 0.930 | |||
| h0a | [-] | 138. | 138. | 134. | 132. | 3.16 | 10.6 | 0.260 | 0.936 | 0.896 | 0.982 | 0.938 | 0.930 |
Download Data |
Period Mean (original grids) [W m-2] |
Model Period Mean (intersection) [W m-2] |
Benchmark Period Mean (intersection) [W m-2] |
Model Period Mean (complement) [W m-2] |
Benchmark Period Mean (complement) [W m-2] |
Bias [W m-2] |
RMSE [W m-2] |
Phase Shift [months] |
Bias Score [1] |
RMSE Score [1] |
Seasonal Cycle Score [1] |
Spatial Distribution Score [1] |
Overall Score [1] |
|||
|---|---|---|---|---|---|---|---|---|---|---|---|---|---|---|---|---|
| Benchmark | [-] | 202. | ||||||||||||||
| h0 | [-] | 195. | 195. | 202. | 178. | -7.32 | 11.4 | 0.145 | 0.894 | 0.915 | 0.990 | 0.968 | 0.936 | |||
| h0a | [-] | 195. | 195. | 202. | 178. | -7.32 | 11.4 | 0.145 | 0.894 | 0.915 | 0.990 | 0.968 | 0.936 |
Download Data |
Period Mean (original grids) [W m-2] |
Model Period Mean (intersection) [W m-2] |
Benchmark Period Mean (intersection) [W m-2] |
Model Period Mean (complement) [W m-2] |
Benchmark Period Mean (complement) [W m-2] |
Bias [W m-2] |
RMSE [W m-2] |
Phase Shift [months] |
Bias Score [1] |
RMSE Score [1] |
Seasonal Cycle Score [1] |
Spatial Distribution Score [1] |
Overall Score [1] |
|||
|---|---|---|---|---|---|---|---|---|---|---|---|---|---|---|---|---|
| Benchmark | [-] | 202. | ||||||||||||||
| h0 | [-] | 205. | 205. | 201. | 234. | 4.92 | 9.92 | 0.910 | 0.735 | 0.703 | 0.884 | 0.977 | 0.800 | |||
| h0a | [-] | 205. | 205. | 201. | 234. | 4.92 | 9.92 | 0.910 | 0.735 | 0.703 | 0.884 | 0.977 | 0.800 |
Download Data |
Period Mean (original grids) [W m-2] |
Model Period Mean (intersection) [W m-2] |
Benchmark Period Mean (intersection) [W m-2] |
Model Period Mean (complement) [W m-2] |
Benchmark Period Mean (complement) [W m-2] |
Bias [W m-2] |
RMSE [W m-2] |
Phase Shift [months] |
Bias Score [1] |
RMSE Score [1] |
Seasonal Cycle Score [1] |
Spatial Distribution Score [1] |
Overall Score [1] |
|||
|---|---|---|---|---|---|---|---|---|---|---|---|---|---|---|---|---|
| Benchmark | [-] | 215. | ||||||||||||||
| h0 | [-] | 212. | 212. | 215. | 220. | -2.35 | 12.4 | 0.837 | 0.873 | 0.772 | 0.903 | 0.987 | 0.861 | |||
| h0a | [-] | 212. | 212. | 215. | 220. | -2.35 | 12.4 | 0.837 | 0.873 | 0.772 | 0.903 | 0.987 | 0.861 |
Download Data |
Period Mean (original grids) [W m-2] |
Model Period Mean (intersection) [W m-2] |
Benchmark Period Mean (intersection) [W m-2] |
Model Period Mean (complement) [W m-2] |
Benchmark Period Mean (complement) [W m-2] |
Bias [W m-2] |
RMSE [W m-2] |
Phase Shift [months] |
Bias Score [1] |
RMSE Score [1] |
Seasonal Cycle Score [1] |
Spatial Distribution Score [1] |
Overall Score [1] |
|||
|---|---|---|---|---|---|---|---|---|---|---|---|---|---|---|---|---|
| Benchmark | [-] | 208. | ||||||||||||||
| h0 | [-] | 208. | 207. | 210. | 190. | -5.48 | 20.4 | 0.514 | 0.773 | 0.796 | 0.946 | 0.998 | 0.861 | |||
| h0a | [-] | 208. | 207. | 210. | 190. | -5.48 | 20.4 | 0.514 | 0.773 | 0.796 | 0.946 | 0.998 | 0.861 |
Temporally integrated period mean