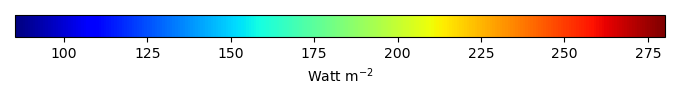
Mean State
Download Data |
Period Mean (original grids) [Watt m-2] |
Model Period Mean (intersection) [Watt m-2] |
Benchmark Period Mean (intersection) [Watt m-2] |
Model Period Mean (complement) [Watt m-2] |
Benchmark Period Mean (complement) [Watt m-2] |
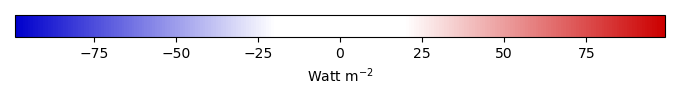
Bias [Watt m-2] |
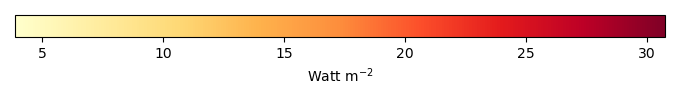
RMSE [Watt m-2] |
Phase Shift [months] |
Bias Score [1] |
RMSE Score [1] |
Seasonal Cycle Score [1] |
Spatial Distribution Score [1] |
Overall Score [1] |
|||
|---|---|---|---|---|---|---|---|---|---|---|---|---|---|---|---|---|
| Benchmark | [-] | 216. | ||||||||||||||
| h0 | [-] | 216. | 216. | 215. | 236. | 1.04 | 9.21 | 0.760 | 0.817 | 0.733 | 0.893 | 0.999 | 0.835 | |||
| h0a | [-] | 216. | 216. | 215. | 236. | 1.04 | 9.21 | 0.760 | 0.817 | 0.733 | 0.893 | 0.999 | 0.835 |
Download Data |
Period Mean (original grids) [Watt m-2] |
Model Period Mean (intersection) [Watt m-2] |
Benchmark Period Mean (intersection) [Watt m-2] |
Model Period Mean (complement) [Watt m-2] |
Benchmark Period Mean (complement) [Watt m-2] |
Bias [Watt m-2] |
RMSE [Watt m-2] |
Phase Shift [months] |
Bias Score [1] |
RMSE Score [1] |
Seasonal Cycle Score [1] |
Spatial Distribution Score [1] |
Overall Score [1] |
|||
|---|---|---|---|---|---|---|---|---|---|---|---|---|---|---|---|---|
| Benchmark | [-] | 240. | ||||||||||||||
| h0 | [-] | 241. | 242. | 240. | 234. | 2.13 | 10.5 | 0.389 | 0.851 | 0.727 | 0.970 | 1.00 | 0.855 | |||
| h0a | [-] | 241. | 242. | 240. | 234. | 2.13 | 10.5 | 0.389 | 0.851 | 0.727 | 0.970 | 1.00 | 0.855 |
Download Data |
Period Mean (original grids) [Watt m-2] |
Model Period Mean (intersection) [Watt m-2] |
Benchmark Period Mean (intersection) [Watt m-2] |
Model Period Mean (complement) [Watt m-2] |
Benchmark Period Mean (complement) [Watt m-2] |
Bias [Watt m-2] |
RMSE [Watt m-2] |
Phase Shift [months] |
Bias Score [1] |
RMSE Score [1] |
Seasonal Cycle Score [1] |
Spatial Distribution Score [1] |
Overall Score [1] |
|||
|---|---|---|---|---|---|---|---|---|---|---|---|---|---|---|---|---|
| Benchmark | [-] | 233. | ||||||||||||||
| h0 | [-] | 234. | 234. | 232. | 238. | 1.41 | 9.27 | 0.557 | 0.860 | 0.782 | 0.938 | 0.983 | 0.869 | |||
| h0a | [-] | 234. | 234. | 232. | 238. | 1.41 | 9.27 | 0.557 | 0.860 | 0.782 | 0.938 | 0.983 | 0.869 |
Download Data |
Period Mean (original grids) [Watt m-2] |
Model Period Mean (intersection) [Watt m-2] |
Benchmark Period Mean (intersection) [Watt m-2] |
Model Period Mean (complement) [Watt m-2] |
Benchmark Period Mean (complement) [Watt m-2] |
Bias [Watt m-2] |
RMSE [Watt m-2] |
Phase Shift [months] |
Bias Score [1] |
RMSE Score [1] |
Seasonal Cycle Score [1] |
Spatial Distribution Score [1] |
Overall Score [1] |
|||
|---|---|---|---|---|---|---|---|---|---|---|---|---|---|---|---|---|
| Benchmark | [-] | 109. | ||||||||||||||
| h0 | [-] | 112. | 112. | 109. | 112. | 2.44 | 11.5 | 0.161 | 0.930 | 0.879 | 0.989 | 0.879 | 0.911 | |||
| h0a | [-] | 112. | 112. | 109. | 112. | 2.44 | 11.5 | 0.161 | 0.930 | 0.879 | 0.989 | 0.879 | 0.911 |
Download Data |
Period Mean (original grids) [Watt m-2] |
Model Period Mean (intersection) [Watt m-2] |
Benchmark Period Mean (intersection) [Watt m-2] |
Model Period Mean (complement) [Watt m-2] |
Benchmark Period Mean (complement) [Watt m-2] |
Bias [Watt m-2] |
RMSE [Watt m-2] |
Phase Shift [months] |
Bias Score [1] |
RMSE Score [1] |
Seasonal Cycle Score [1] |
Spatial Distribution Score [1] |
Overall Score [1] |
|||
|---|---|---|---|---|---|---|---|---|---|---|---|---|---|---|---|---|
| Benchmark | [-] | 209. | ||||||||||||||
| h0 | [-] | 213. | 212. | 207. | 222. | 9.63 | 14.1 | 0.821 | 0.607 | 0.706 | 0.884 | 0.963 | 0.773 | |||
| h0a | [-] | 213. | 212. | 207. | 222. | 9.63 | 14.1 | 0.821 | 0.607 | 0.706 | 0.884 | 0.963 | 0.773 |
Download Data |
Period Mean (original grids) [Watt m-2] |
Model Period Mean (intersection) [Watt m-2] |
Benchmark Period Mean (intersection) [Watt m-2] |
Model Period Mean (complement) [Watt m-2] |
Benchmark Period Mean (complement) [Watt m-2] |
Bias [Watt m-2] |
RMSE [Watt m-2] |
Phase Shift [months] |
Bias Score [1] |
RMSE Score [1] |
Seasonal Cycle Score [1] |
Spatial Distribution Score [1] |
Overall Score [1] |
|||
|---|---|---|---|---|---|---|---|---|---|---|---|---|---|---|---|---|
| Benchmark | [-] | 124. | ||||||||||||||
| h0 | [-] | 126. | 126. | 124. | 135. | 2.19 | 7.13 | 0.394 | 0.962 | 0.919 | 0.973 | 0.994 | 0.954 | |||
| h0a | [-] | 126. | 126. | 124. | 135. | 2.19 | 7.13 | 0.394 | 0.962 | 0.919 | 0.973 | 0.994 | 0.954 |
Download Data |
Period Mean (original grids) [Watt m-2] |
Model Period Mean (intersection) [Watt m-2] |
Benchmark Period Mean (intersection) [Watt m-2] |
Model Period Mean (complement) [Watt m-2] |
Benchmark Period Mean (complement) [Watt m-2] |
Bias [Watt m-2] |
RMSE [Watt m-2] |
Phase Shift [months] |
Bias Score [1] |
RMSE Score [1] |
Seasonal Cycle Score [1] |
Spatial Distribution Score [1] |
Overall Score [1] |
|||
|---|---|---|---|---|---|---|---|---|---|---|---|---|---|---|---|---|
| Benchmark | [-] | 169. | ||||||||||||||
| h0 | [-] | 172. | 171. | 169. | 170. | 2.45 | 9.32 | 0.413 | 0.915 | 0.872 | 0.967 | 0.998 | 0.925 | |||
| h0a | [-] | 172. | 171. | 169. | 170. | 2.45 | 9.32 | 0.413 | 0.915 | 0.872 | 0.967 | 0.998 | 0.925 |
Download Data |
Period Mean (original grids) [Watt m-2] |
Model Period Mean (intersection) [Watt m-2] |
Benchmark Period Mean (intersection) [Watt m-2] |
Model Period Mean (complement) [Watt m-2] |
Benchmark Period Mean (complement) [Watt m-2] |
Bias [Watt m-2] |
RMSE [Watt m-2] |
Phase Shift [months] |
Bias Score [1] |
RMSE Score [1] |
Seasonal Cycle Score [1] |
Spatial Distribution Score [1] |
Overall Score [1] |
|||
|---|---|---|---|---|---|---|---|---|---|---|---|---|---|---|---|---|
| Benchmark | [-] | 210. | ||||||||||||||
| h0 | [-] | 212. | 211. | 209. | 223. | 3.63 | 13.2 | 0.369 | 0.826 | 0.769 | 0.975 | 0.981 | 0.864 | |||
| h0a | [-] | 212. | 211. | 209. | 223. | 3.63 | 13.2 | 0.369 | 0.826 | 0.769 | 0.975 | 0.981 | 0.864 |
Download Data |
Period Mean (original grids) [Watt m-2] |
Model Period Mean (intersection) [Watt m-2] |
Benchmark Period Mean (intersection) [Watt m-2] |
Model Period Mean (complement) [Watt m-2] |
Benchmark Period Mean (complement) [Watt m-2] |
Bias [Watt m-2] |
RMSE [Watt m-2] |
Phase Shift [months] |
Bias Score [1] |
RMSE Score [1] |
Seasonal Cycle Score [1] |
Spatial Distribution Score [1] |
Overall Score [1] |
|||
|---|---|---|---|---|---|---|---|---|---|---|---|---|---|---|---|---|
| Benchmark | [-] | 104. | ||||||||||||||
| h0 | [-] | 97.6 | 97.8 | 103. | 105. | -6.29 | 8.90 | 0.192 | 0.916 | 0.856 | 0.987 | 0.927 | 0.909 | |||
| h0a | [-] | 97.6 | 97.8 | 103. | 105. | -6.29 | 8.90 | 0.192 | 0.916 | 0.856 | 0.987 | 0.927 | 0.909 |
Download Data |
Period Mean (original grids) [Watt m-2] |
Model Period Mean (intersection) [Watt m-2] |
Benchmark Period Mean (intersection) [Watt m-2] |
Model Period Mean (complement) [Watt m-2] |
Benchmark Period Mean (complement) [Watt m-2] |
Bias [Watt m-2] |
RMSE [Watt m-2] |
Phase Shift [months] |
Bias Score [1] |
RMSE Score [1] |
Seasonal Cycle Score [1] |
Spatial Distribution Score [1] |
Overall Score [1] |
|||
|---|---|---|---|---|---|---|---|---|---|---|---|---|---|---|---|---|
| Benchmark | [-] | 225. | ||||||||||||||
| h0 | [-] | 230. | 230. | 225. | 218. | 3.32 | 9.31 | 0.415 | 0.909 | 0.862 | 0.970 | 1.00 | 0.920 | |||
| h0a | [-] | 230. | 230. | 225. | 218. | 3.32 | 9.31 | 0.415 | 0.909 | 0.862 | 0.970 | 1.00 | 0.920 |
Download Data |
Period Mean (original grids) [Watt m-2] |
Model Period Mean (intersection) [Watt m-2] |
Benchmark Period Mean (intersection) [Watt m-2] |
Model Period Mean (complement) [Watt m-2] |
Benchmark Period Mean (complement) [Watt m-2] |
Bias [Watt m-2] |
RMSE [Watt m-2] |
Phase Shift [months] |
Bias Score [1] |
RMSE Score [1] |
Seasonal Cycle Score [1] |
Spatial Distribution Score [1] |
Overall Score [1] |
|||
|---|---|---|---|---|---|---|---|---|---|---|---|---|---|---|---|---|
| Benchmark | [-] | 140. | ||||||||||||||
| h0 | [-] | 134. | 134. | 139. | 162. | -1.81 | 8.39 | 0.379 | 0.943 | 0.913 | 0.972 | 0.999 | 0.948 | |||
| h0a | [-] | 134. | 134. | 139. | 162. | -1.81 | 8.39 | 0.379 | 0.943 | 0.913 | 0.972 | 0.999 | 0.948 |
Download Data |
Period Mean (original grids) [Watt m-2] |
Model Period Mean (intersection) [Watt m-2] |
Benchmark Period Mean (intersection) [Watt m-2] |
Model Period Mean (complement) [Watt m-2] |
Benchmark Period Mean (complement) [Watt m-2] |
Bias [Watt m-2] |
RMSE [Watt m-2] |
Phase Shift [months] |
Bias Score [1] |
RMSE Score [1] |
Seasonal Cycle Score [1] |
Spatial Distribution Score [1] |
Overall Score [1] |
|||
|---|---|---|---|---|---|---|---|---|---|---|---|---|---|---|---|---|
| Benchmark | [-] | 186. | ||||||||||||||
| h0 | [-] | 183. | 183. | 186. | 195. | -2.66 | 9.88 | 0.414 | 0.874 | 0.827 | 0.959 | 0.988 | 0.895 | |||
| h0a | [-] | 183. | 183. | 186. | 195. | -2.66 | 9.88 | 0.414 | 0.874 | 0.827 | 0.959 | 0.988 | 0.895 |
Download Data |
Period Mean (original grids) [Watt m-2] |
Model Period Mean (intersection) [Watt m-2] |
Benchmark Period Mean (intersection) [Watt m-2] |
Model Period Mean (complement) [Watt m-2] |
Benchmark Period Mean (complement) [Watt m-2] |
Bias [Watt m-2] |
RMSE [Watt m-2] |
Phase Shift [months] |
Bias Score [1] |
RMSE Score [1] |
Seasonal Cycle Score [1] |
Spatial Distribution Score [1] |
Overall Score [1] |
|||
|---|---|---|---|---|---|---|---|---|---|---|---|---|---|---|---|---|
| Benchmark | [-] | 243. | ||||||||||||||
| h0 | [-] | 241. | 240. | 243. | 240. | -2.78 | 9.90 | 0.351 | 0.910 | 0.867 | 0.972 | 1.00 | 0.923 | |||
| h0a | [-] | 241. | 240. | 243. | 240. | -2.78 | 9.90 | 0.351 | 0.910 | 0.867 | 0.972 | 1.00 | 0.923 |
Download Data |
Period Mean (original grids) [Watt m-2] |
Model Period Mean (intersection) [Watt m-2] |
Benchmark Period Mean (intersection) [Watt m-2] |
Model Period Mean (complement) [Watt m-2] |
Benchmark Period Mean (complement) [Watt m-2] |
Bias [Watt m-2] |
RMSE [Watt m-2] |
Phase Shift [months] |
Bias Score [1] |
RMSE Score [1] |
Seasonal Cycle Score [1] |
Spatial Distribution Score [1] |
Overall Score [1] |
|||
|---|---|---|---|---|---|---|---|---|---|---|---|---|---|---|---|---|
| Benchmark | [-] | 111. | ||||||||||||||
| h0 | [-] | 113. | 113. | 111. | 115. | 0.703 | 11.2 | 0.175 | 0.921 | 0.872 | 0.988 | 0.855 | 0.901 | |||
| h0a | [-] | 113. | 113. | 111. | 115. | 0.703 | 11.2 | 0.175 | 0.921 | 0.872 | 0.988 | 0.855 | 0.901 |
Download Data |
Period Mean (original grids) [Watt m-2] |
Model Period Mean (intersection) [Watt m-2] |
Benchmark Period Mean (intersection) [Watt m-2] |
Model Period Mean (complement) [Watt m-2] |
Benchmark Period Mean (complement) [Watt m-2] |
Bias [Watt m-2] |
RMSE [Watt m-2] |
Phase Shift [months] |
Bias Score [1] |
RMSE Score [1] |
Seasonal Cycle Score [1] |
Spatial Distribution Score [1] |
Overall Score [1] |
|||
|---|---|---|---|---|---|---|---|---|---|---|---|---|---|---|---|---|
| Benchmark | [-] | 232. | ||||||||||||||
| h0 | [-] | 226. | 227. | 230. | 244. | -1.46 | 10.4 | 0.418 | 0.837 | 0.830 | 0.956 | 0.961 | 0.883 | |||
| h0a | [-] | 226. | 227. | 230. | 244. | -1.46 | 10.4 | 0.418 | 0.837 | 0.830 | 0.956 | 0.961 | 0.883 |
Download Data |
Period Mean (original grids) [Watt m-2] |
Model Period Mean (intersection) [Watt m-2] |
Benchmark Period Mean (intersection) [Watt m-2] |
Model Period Mean (complement) [Watt m-2] |
Benchmark Period Mean (complement) [Watt m-2] |
Bias [Watt m-2] |
RMSE [Watt m-2] |
Phase Shift [months] |
Bias Score [1] |
RMSE Score [1] |
Seasonal Cycle Score [1] |
Spatial Distribution Score [1] |
Overall Score [1] |
|||
|---|---|---|---|---|---|---|---|---|---|---|---|---|---|---|---|---|
| Benchmark | [-] | 176. | ||||||||||||||
| h0 | [-] | 170. | 170. | 175. | 206. | -2.51 | 6.80 | 0.308 | 0.941 | 0.915 | 0.978 | 0.999 | 0.950 | |||
| h0a | [-] | 170. | 170. | 175. | 206. | -2.51 | 6.80 | 0.308 | 0.941 | 0.915 | 0.978 | 0.999 | 0.950 |
Download Data |
Period Mean (original grids) [Watt m-2] |
Model Period Mean (intersection) [Watt m-2] |
Benchmark Period Mean (intersection) [Watt m-2] |
Model Period Mean (complement) [Watt m-2] |
Benchmark Period Mean (complement) [Watt m-2] |
Bias [Watt m-2] |
RMSE [Watt m-2] |
Phase Shift [months] |
Bias Score [1] |
RMSE Score [1] |
Seasonal Cycle Score [1] |
Spatial Distribution Score [1] |
Overall Score [1] |
|||
|---|---|---|---|---|---|---|---|---|---|---|---|---|---|---|---|---|
| Benchmark | [-] | 134. | ||||||||||||||
| h0 | [-] | 137. | 137. | 134. | 139. | 2.58 | 7.86 | 0.217 | 0.952 | 0.917 | 0.985 | 0.963 | 0.947 | |||
| h0a | [-] | 137. | 137. | 134. | 139. | 2.58 | 7.86 | 0.217 | 0.952 | 0.917 | 0.985 | 0.963 | 0.947 |
Download Data |
Period Mean (original grids) [Watt m-2] |
Model Period Mean (intersection) [Watt m-2] |
Benchmark Period Mean (intersection) [Watt m-2] |
Model Period Mean (complement) [Watt m-2] |
Benchmark Period Mean (complement) [Watt m-2] |
Bias [Watt m-2] |
RMSE [Watt m-2] |
Phase Shift [months] |
Bias Score [1] |
RMSE Score [1] |
Seasonal Cycle Score [1] |
Spatial Distribution Score [1] |
Overall Score [1] |
|||
|---|---|---|---|---|---|---|---|---|---|---|---|---|---|---|---|---|
| Benchmark | [-] | 195. | ||||||||||||||
| h0 | [-] | 193. | 194. | 195. | 181. | -1.41 | 7.01 | 0.147 | 0.953 | 0.928 | 0.990 | 0.995 | 0.959 | |||
| h0a | [-] | 193. | 194. | 195. | 181. | -1.41 | 7.01 | 0.147 | 0.953 | 0.928 | 0.990 | 0.995 | 0.959 |
Download Data |
Period Mean (original grids) [Watt m-2] |
Model Period Mean (intersection) [Watt m-2] |
Benchmark Period Mean (intersection) [Watt m-2] |
Model Period Mean (complement) [Watt m-2] |
Benchmark Period Mean (complement) [Watt m-2] |
Bias [Watt m-2] |
RMSE [Watt m-2] |
Phase Shift [months] |
Bias Score [1] |
RMSE Score [1] |
Seasonal Cycle Score [1] |
Spatial Distribution Score [1] |
Overall Score [1] |
|||
|---|---|---|---|---|---|---|---|---|---|---|---|---|---|---|---|---|
| Benchmark | [-] | 204. | ||||||||||||||
| h0 | [-] | 205. | 205. | 203. | 246. | 3.04 | 9.14 | 1.11 | 0.795 | 0.721 | 0.857 | 0.986 | 0.816 | |||
| h0a | [-] | 205. | 205. | 203. | 246. | 3.04 | 9.14 | 1.11 | 0.795 | 0.721 | 0.857 | 0.986 | 0.816 |
Download Data |
Period Mean (original grids) [Watt m-2] |
Model Period Mean (intersection) [Watt m-2] |
Benchmark Period Mean (intersection) [Watt m-2] |
Model Period Mean (complement) [Watt m-2] |
Benchmark Period Mean (complement) [Watt m-2] |
Bias [Watt m-2] |
RMSE [Watt m-2] |
Phase Shift [months] |
Bias Score [1] |
RMSE Score [1] |
Seasonal Cycle Score [1] |
Spatial Distribution Score [1] |
Overall Score [1] |
|||
|---|---|---|---|---|---|---|---|---|---|---|---|---|---|---|---|---|
| Benchmark | [-] | 214. | ||||||||||||||
| h0 | [-] | 213. | 213. | 214. | 221. | -0.503 | 12.8 | 0.981 | 0.844 | 0.761 | 0.867 | 0.969 | 0.840 | |||
| h0a | [-] | 213. | 213. | 214. | 221. | -0.503 | 12.8 | 0.981 | 0.844 | 0.761 | 0.867 | 0.969 | 0.840 |
Download Data |
Period Mean (original grids) [Watt m-2] |
Model Period Mean (intersection) [Watt m-2] |
Benchmark Period Mean (intersection) [Watt m-2] |
Model Period Mean (complement) [Watt m-2] |
Benchmark Period Mean (complement) [Watt m-2] |
Bias [Watt m-2] |
RMSE [Watt m-2] |
Phase Shift [months] |
Bias Score [1] |
RMSE Score [1] |
Seasonal Cycle Score [1] |
Spatial Distribution Score [1] |
Overall Score [1] |
|||
|---|---|---|---|---|---|---|---|---|---|---|---|---|---|---|---|---|
| Benchmark | [-] | 204. | ||||||||||||||
| h0 | [-] | 208. | 207. | 204. | 192. | 1.49 | 14.1 | 0.523 | 0.853 | 0.828 | 0.954 | 0.999 | 0.892 | |||
| h0a | [-] | 208. | 207. | 204. | 192. | 1.49 | 14.1 | 0.523 | 0.853 | 0.828 | 0.954 | 0.999 | 0.892 |
Temporally integrated period mean