Mean State
Download Data |
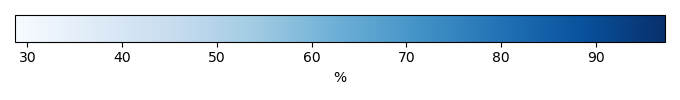
Period Mean (original grids) [%] |
Model Period Mean (intersection) [%] |
Benchmark Period Mean (intersection) [%] |
Model Period Mean (complement) [%] |
Benchmark Period Mean (complement) [%] |
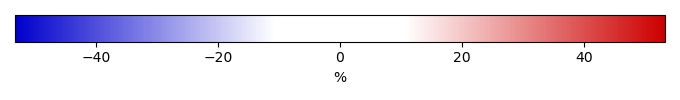
Bias [%] |
RMSE [%] |
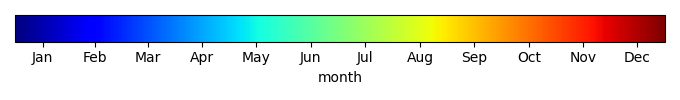
Phase Shift [months] |
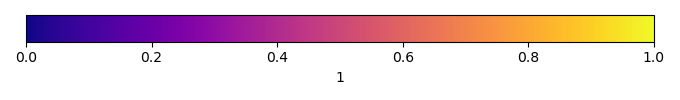
Bias Score [1] |
RMSE Score [1] |
Seasonal Cycle Score [1] |
Spatial Distribution Score [1] |
Overall Score [1] |
|||
|---|---|---|---|---|---|---|---|---|---|---|---|---|---|---|---|---|
| Benchmark | [-] | 74.8 | ||||||||||||||
| h0 | [-] | 70.3 | 70.5 | 74.0 | 92.8 | -2.68 | 11.0 | 2.19 | 0.314 | 0.293 | 0.661 | 0.784 | 0.469 | |||
| h0a | [-] | 70.3 | 70.5 | 74.0 | 92.8 | -2.68 | 11.0 | 2.19 | 0.314 | 0.293 | 0.661 | 0.784 | 0.469 |
Download Data |
Period Mean (original grids) [%] |
Model Period Mean (intersection) [%] |
Benchmark Period Mean (intersection) [%] |
Model Period Mean (complement) [%] |
Benchmark Period Mean (complement) [%] |
Bias [%] |
RMSE [%] |
Phase Shift [months] |
Bias Score [1] |
RMSE Score [1] |
Seasonal Cycle Score [1] |
Spatial Distribution Score [1] |
Overall Score [1] |
|||
|---|---|---|---|---|---|---|---|---|---|---|---|---|---|---|---|---|
| Benchmark | [-] | 53.3 | ||||||||||||||
| h0 | [-] | 51.2 | 50.6 | 53.0 | 92.1 | -2.03 | 8.32 | 0.397 | 0.746 | 0.676 | 0.959 | 0.996 | 0.811 | |||
| h0a | [-] | 51.2 | 50.6 | 53.0 | 92.1 | -2.03 | 8.32 | 0.397 | 0.746 | 0.676 | 0.959 | 0.996 | 0.811 |
Download Data |
Period Mean (original grids) [%] |
Model Period Mean (intersection) [%] |
Benchmark Period Mean (intersection) [%] |
Model Period Mean (complement) [%] |
Benchmark Period Mean (complement) [%] |
Bias [%] |
RMSE [%] |
Phase Shift [months] |
Bias Score [1] |
RMSE Score [1] |
Seasonal Cycle Score [1] |
Spatial Distribution Score [1] |
Overall Score [1] |
|||
|---|---|---|---|---|---|---|---|---|---|---|---|---|---|---|---|---|
| Benchmark | [-] | 68.1 | ||||||||||||||
| h0 | [-] | 62.0 | 62.0 | 67.1 | 92.4 | -3.75 | 10.3 | 1.17 | 0.422 | 0.484 | 0.847 | 0.967 | 0.641 | |||
| h0a | [-] | 62.0 | 62.0 | 67.1 | 92.4 | -3.75 | 10.3 | 1.17 | 0.422 | 0.484 | 0.847 | 0.967 | 0.641 |
Download Data |
Period Mean (original grids) [%] |
Model Period Mean (intersection) [%] |
Benchmark Period Mean (intersection) [%] |
Model Period Mean (complement) [%] |
Benchmark Period Mean (complement) [%] |
Bias [%] |
RMSE [%] |
Phase Shift [months] |
Bias Score [1] |
RMSE Score [1] |
Seasonal Cycle Score [1] |
Spatial Distribution Score [1] |
Overall Score [1] |
|||
|---|---|---|---|---|---|---|---|---|---|---|---|---|---|---|---|---|
| Benchmark | [-] | 74.4 | ||||||||||||||
| h0 | [-] | 88.2 | 88.1 | 72.9 | 93.3 | 15.7 | 23.0 | 2.82 | 0.392 | 0.393 | 0.539 | 0.209 | 0.385 | |||
| h0a | [-] | 88.2 | 88.1 | 72.9 | 93.3 | 15.7 | 23.0 | 2.82 | 0.392 | 0.393 | 0.539 | 0.209 | 0.385 |
Download Data |
Period Mean (original grids) [%] |
Model Period Mean (intersection) [%] |
Benchmark Period Mean (intersection) [%] |
Model Period Mean (complement) [%] |
Benchmark Period Mean (complement) [%] |
Bias [%] |
RMSE [%] |
Phase Shift [months] |
Bias Score [1] |
RMSE Score [1] |
Seasonal Cycle Score [1] |
Spatial Distribution Score [1] |
Overall Score [1] |
|||
|---|---|---|---|---|---|---|---|---|---|---|---|---|---|---|---|---|
| Benchmark | [-] | 86.5 | ||||||||||||||
| h0 | [-] | 83.2 | 83.2 | 85.1 | 93.4 | -2.51 | 7.05 | 2.60 | 0.268 | 0.368 | 0.584 | 0.470 | 0.412 | |||
| h0a | [-] | 83.2 | 83.2 | 85.1 | 93.4 | -2.51 | 7.05 | 2.60 | 0.268 | 0.368 | 0.584 | 0.470 | 0.412 |
Download Data |
Period Mean (original grids) [%] |
Model Period Mean (intersection) [%] |
Benchmark Period Mean (intersection) [%] |
Model Period Mean (complement) [%] |
Benchmark Period Mean (complement) [%] |
Bias [%] |
RMSE [%] |
Phase Shift [months] |
Bias Score [1] |
RMSE Score [1] |
Seasonal Cycle Score [1] |
Spatial Distribution Score [1] |
Overall Score [1] |
|||
|---|---|---|---|---|---|---|---|---|---|---|---|---|---|---|---|---|
| Benchmark | [-] | 73.8 | ||||||||||||||
| h0 | [-] | 82.9 | 82.9 | 73.7 | 92.8 | 9.28 | 16.5 | 2.17 | 0.557 | 0.409 | 0.673 | 0.391 | 0.488 | |||
| h0a | [-] | 82.9 | 82.9 | 73.7 | 92.8 | 9.28 | 16.5 | 2.17 | 0.557 | 0.409 | 0.673 | 0.391 | 0.488 |
Download Data |
Period Mean (original grids) [%] |
Model Period Mean (intersection) [%] |
Benchmark Period Mean (intersection) [%] |
Model Period Mean (complement) [%] |
Benchmark Period Mean (complement) [%] |
Bias [%] |
RMSE [%] |
Phase Shift [months] |
Bias Score [1] |
RMSE Score [1] |
Seasonal Cycle Score [1] |
Spatial Distribution Score [1] |
Overall Score [1] |
|||
|---|---|---|---|---|---|---|---|---|---|---|---|---|---|---|---|---|
| Benchmark | [-] | 57.0 | ||||||||||||||
| h0 | [-] | 65.4 | 65.6 | 56.4 | 90.1 | 9.90 | 20.5 | 1.59 | 0.459 | 0.449 | 0.758 | 0.811 | 0.585 | |||
| h0a | [-] | 65.4 | 65.6 | 56.4 | 90.1 | 9.90 | 20.5 | 1.59 | 0.459 | 0.449 | 0.758 | 0.811 | 0.585 |
Download Data |
Period Mean (original grids) [%] |
Model Period Mean (intersection) [%] |
Benchmark Period Mean (intersection) [%] |
Model Period Mean (complement) [%] |
Benchmark Period Mean (complement) [%] |
Bias [%] |
RMSE [%] |
Phase Shift [months] |
Bias Score [1] |
RMSE Score [1] |
Seasonal Cycle Score [1] |
Spatial Distribution Score [1] |
Overall Score [1] |
|||
|---|---|---|---|---|---|---|---|---|---|---|---|---|---|---|---|---|
| Benchmark | [-] | 66.6 | ||||||||||||||
| h0 | [-] | 60.1 | 59.8 | 65.0 | 93.0 | -2.57 | 13.0 | 1.33 | 0.444 | 0.482 | 0.806 | 0.984 | 0.639 | |||
| h0a | [-] | 60.1 | 59.8 | 65.0 | 93.0 | -2.57 | 13.0 | 1.33 | 0.444 | 0.482 | 0.806 | 0.984 | 0.639 |
Download Data |
Period Mean (original grids) [%] |
Model Period Mean (intersection) [%] |
Benchmark Period Mean (intersection) [%] |
Model Period Mean (complement) [%] |
Benchmark Period Mean (complement) [%] |
Bias [%] |
RMSE [%] |
Phase Shift [months] |
Bias Score [1] |
RMSE Score [1] |
Seasonal Cycle Score [1] |
Spatial Distribution Score [1] |
Overall Score [1] |
|||
|---|---|---|---|---|---|---|---|---|---|---|---|---|---|---|---|---|
| Benchmark | [-] | 78.5 | ||||||||||||||
| h0 | [-] | 89.6 | 89.5 | 77.9 | 93.5 | 12.0 | 17.2 | 3.64 | 0.474 | 0.463 | 0.365 | 0.331 | 0.419 | |||
| h0a | [-] | 89.6 | 89.5 | 77.9 | 93.5 | 12.0 | 17.2 | 3.64 | 0.474 | 0.463 | 0.365 | 0.331 | 0.419 |
Download Data |
Period Mean (original grids) [%] |
Model Period Mean (intersection) [%] |
Benchmark Period Mean (intersection) [%] |
Model Period Mean (complement) [%] |
Benchmark Period Mean (complement) [%] |
Bias [%] |
RMSE [%] |
Phase Shift [months] |
Bias Score [1] |
RMSE Score [1] |
Seasonal Cycle Score [1] |
Spatial Distribution Score [1] |
Overall Score [1] |
|||
|---|---|---|---|---|---|---|---|---|---|---|---|---|---|---|---|---|
| Benchmark | [-] | 54.6 | ||||||||||||||
| h0 | [-] | 51.0 | 51.0 | 52.5 | 89.4 | 1.43 | 8.21 | 0.782 | 0.531 | 0.596 | 0.908 | 0.986 | 0.723 | |||
| h0a | [-] | 51.0 | 51.0 | 52.5 | 89.4 | 1.43 | 8.21 | 0.782 | 0.531 | 0.596 | 0.908 | 0.986 | 0.723 |
Download Data |
Period Mean (original grids) [%] |
Model Period Mean (intersection) [%] |
Benchmark Period Mean (intersection) [%] |
Model Period Mean (complement) [%] |
Benchmark Period Mean (complement) [%] |
Bias [%] |
RMSE [%] |
Phase Shift [months] |
Bias Score [1] |
RMSE Score [1] |
Seasonal Cycle Score [1] |
Spatial Distribution Score [1] |
Overall Score [1] |
|||
|---|---|---|---|---|---|---|---|---|---|---|---|---|---|---|---|---|
| Benchmark | [-] | 78.0 | ||||||||||||||
| h0 | [-] | 80.0 | 80.0 | 77.1 | 91.4 | 2.67 | 9.30 | 0.881 | 0.528 | 0.524 | 0.897 | 0.933 | 0.681 | |||
| h0a | [-] | 80.0 | 80.0 | 77.1 | 91.4 | 2.67 | 9.30 | 0.881 | 0.528 | 0.524 | 0.897 | 0.933 | 0.681 |
Download Data |
Period Mean (original grids) [%] |
Model Period Mean (intersection) [%] |
Benchmark Period Mean (intersection) [%] |
Model Period Mean (complement) [%] |
Benchmark Period Mean (complement) [%] |
Bias [%] |
RMSE [%] |
Phase Shift [months] |
Bias Score [1] |
RMSE Score [1] |
Seasonal Cycle Score [1] |
Spatial Distribution Score [1] |
Overall Score [1] |
|||
|---|---|---|---|---|---|---|---|---|---|---|---|---|---|---|---|---|
| Benchmark | [-] | 69.1 | ||||||||||||||
| h0 | [-] | 69.7 | 69.6 | 68.1 | 92.2 | 2.59 | 12.3 | 1.62 | 0.434 | 0.462 | 0.762 | 0.985 | 0.621 | |||
| h0a | [-] | 69.7 | 69.6 | 68.1 | 92.2 | 2.59 | 12.3 | 1.62 | 0.434 | 0.462 | 0.762 | 0.985 | 0.621 |
Download Data |
Period Mean (original grids) [%] |
Model Period Mean (intersection) [%] |
Benchmark Period Mean (intersection) [%] |
Model Period Mean (complement) [%] |
Benchmark Period Mean (complement) [%] |
Bias [%] |
RMSE [%] |
Phase Shift [months] |
Bias Score [1] |
RMSE Score [1] |
Seasonal Cycle Score [1] |
Spatial Distribution Score [1] |
Overall Score [1] |
|||
|---|---|---|---|---|---|---|---|---|---|---|---|---|---|---|---|---|
| Benchmark | [-] | 44.7 | ||||||||||||||
| h0 | [-] | 40.0 | 40.1 | 43.1 | 90.2 | -1.22 | 12.0 | 0.929 | 0.445 | 0.456 | 0.865 | 0.909 | 0.626 | |||
| h0a | [-] | 40.0 | 40.1 | 43.1 | 90.2 | -1.22 | 12.0 | 0.929 | 0.445 | 0.456 | 0.865 | 0.909 | 0.626 |
Download Data |
Period Mean (original grids) [%] |
Model Period Mean (intersection) [%] |
Benchmark Period Mean (intersection) [%] |
Model Period Mean (complement) [%] |
Benchmark Period Mean (complement) [%] |
Bias [%] |
RMSE [%] |
Phase Shift [months] |
Bias Score [1] |
RMSE Score [1] |
Seasonal Cycle Score [1] |
Spatial Distribution Score [1] |
Overall Score [1] |
|||
|---|---|---|---|---|---|---|---|---|---|---|---|---|---|---|---|---|
| Benchmark | [-] | 84.8 | ||||||||||||||
| h0 | [-] | 88.9 | 88.9 | 84.3 | 93.8 | 5.27 | 13.3 | 2.69 | 0.573 | 0.355 | 0.567 | 0.493 | 0.469 | |||
| h0a | [-] | 88.9 | 88.9 | 84.3 | 93.8 | 5.27 | 13.3 | 2.69 | 0.573 | 0.355 | 0.567 | 0.493 | 0.469 |
Download Data |
Period Mean (original grids) [%] |
Model Period Mean (intersection) [%] |
Benchmark Period Mean (intersection) [%] |
Model Period Mean (complement) [%] |
Benchmark Period Mean (complement) [%] |
Bias [%] |
RMSE [%] |
Phase Shift [months] |
Bias Score [1] |
RMSE Score [1] |
Seasonal Cycle Score [1] |
Spatial Distribution Score [1] |
Overall Score [1] |
|||
|---|---|---|---|---|---|---|---|---|---|---|---|---|---|---|---|---|
| Benchmark | [-] | 72.3 | ||||||||||||||
| h0 | [-] | 66.5 | 66.6 | 69.0 | 92.2 | -0.241 | 9.93 | 1.66 | 0.376 | 0.499 | 0.754 | 0.911 | 0.608 | |||
| h0a | [-] | 66.5 | 66.6 | 69.0 | 92.2 | -0.241 | 9.93 | 1.66 | 0.376 | 0.499 | 0.754 | 0.911 | 0.608 |
Download Data |
Period Mean (original grids) [%] |
Model Period Mean (intersection) [%] |
Benchmark Period Mean (intersection) [%] |
Model Period Mean (complement) [%] |
Benchmark Period Mean (complement) [%] |
Bias [%] |
RMSE [%] |
Phase Shift [months] |
Bias Score [1] |
RMSE Score [1] |
Seasonal Cycle Score [1] |
Spatial Distribution Score [1] |
Overall Score [1] |
|||
|---|---|---|---|---|---|---|---|---|---|---|---|---|---|---|---|---|
| Benchmark | [-] | 72.4 | ||||||||||||||
| h0 | [-] | 76.8 | 76.9 | 71.5 | 91.9 | 5.34 | 9.42 | 2.04 | 0.404 | 0.462 | 0.682 | 0.968 | 0.596 | |||
| h0a | [-] | 76.8 | 76.9 | 71.5 | 91.9 | 5.34 | 9.42 | 2.04 | 0.404 | 0.462 | 0.682 | 0.968 | 0.596 |
Download Data |
Period Mean (original grids) [%] |
Model Period Mean (intersection) [%] |
Benchmark Period Mean (intersection) [%] |
Model Period Mean (complement) [%] |
Benchmark Period Mean (complement) [%] |
Bias [%] |
RMSE [%] |
Phase Shift [months] |
Bias Score [1] |
RMSE Score [1] |
Seasonal Cycle Score [1] |
Spatial Distribution Score [1] |
Overall Score [1] |
|||
|---|---|---|---|---|---|---|---|---|---|---|---|---|---|---|---|---|
| Benchmark | [-] | 80.2 | ||||||||||||||
| h0 | [-] | 82.1 | 82.1 | 79.9 | 91.8 | 2.30 | 8.43 | 0.982 | 0.718 | 0.523 | 0.895 | 0.856 | 0.703 | |||
| h0a | [-] | 82.1 | 82.1 | 79.9 | 91.8 | 2.30 | 8.43 | 0.982 | 0.718 | 0.523 | 0.895 | 0.856 | 0.703 |
Download Data |
Period Mean (original grids) [%] |
Model Period Mean (intersection) [%] |
Benchmark Period Mean (intersection) [%] |
Model Period Mean (complement) [%] |
Benchmark Period Mean (complement) [%] |
Bias [%] |
RMSE [%] |
Phase Shift [months] |
Bias Score [1] |
RMSE Score [1] |
Seasonal Cycle Score [1] |
Spatial Distribution Score [1] |
Overall Score [1] |
|||
|---|---|---|---|---|---|---|---|---|---|---|---|---|---|---|---|---|
| Benchmark | [-] | 56.2 | ||||||||||||||
| h0 | [-] | 63.4 | 63.4 | 55.6 | 90.7 | 8.05 | 13.0 | 1.15 | 0.481 | 0.487 | 0.854 | 0.996 | 0.661 | |||
| h0a | [-] | 63.4 | 63.4 | 55.6 | 90.7 | 8.05 | 13.0 | 1.15 | 0.481 | 0.487 | 0.854 | 0.996 | 0.661 |
Download Data |
Period Mean (original grids) [%] |
Model Period Mean (intersection) [%] |
Benchmark Period Mean (intersection) [%] |
Model Period Mean (complement) [%] |
Benchmark Period Mean (complement) [%] |
Bias [%] |
RMSE [%] |
Phase Shift [months] |
Bias Score [1] |
RMSE Score [1] |
Seasonal Cycle Score [1] |
Spatial Distribution Score [1] |
Overall Score [1] |
|||
|---|---|---|---|---|---|---|---|---|---|---|---|---|---|---|---|---|
| Benchmark | [-] | 82.1 | ||||||||||||||
| h0 | [-] | 77.8 | 77.8 | 81.9 | 93.6 | -3.95 | 10.4 | 1.74 | 0.276 | 0.288 | 0.755 | 0.825 | 0.486 | |||
| h0a | [-] | 77.8 | 77.8 | 81.9 | 93.6 | -3.95 | 10.4 | 1.74 | 0.276 | 0.288 | 0.755 | 0.825 | 0.486 |
Download Data |
Period Mean (original grids) [%] |
Model Period Mean (intersection) [%] |
Benchmark Period Mean (intersection) [%] |
Model Period Mean (complement) [%] |
Benchmark Period Mean (complement) [%] |
Bias [%] |
RMSE [%] |
Phase Shift [months] |
Bias Score [1] |
RMSE Score [1] |
Seasonal Cycle Score [1] |
Spatial Distribution Score [1] |
Overall Score [1] |
|||
|---|---|---|---|---|---|---|---|---|---|---|---|---|---|---|---|---|
| Benchmark | [-] | 72.7 | ||||||||||||||
| h0 | [-] | 71.7 | 71.6 | 72.0 | 93.1 | -0.0686 | 11.3 | 1.50 | 0.326 | 0.517 | 0.798 | 0.779 | 0.588 | |||
| h0a | [-] | 71.7 | 71.6 | 72.0 | 93.1 | -0.0686 | 11.3 | 1.50 | 0.326 | 0.517 | 0.798 | 0.779 | 0.588 |
Download Data |
Period Mean (original grids) [%] |
Model Period Mean (intersection) [%] |
Benchmark Period Mean (intersection) [%] |
Model Period Mean (complement) [%] |
Benchmark Period Mean (complement) [%] |
Bias [%] |
RMSE [%] |
Phase Shift [months] |
Bias Score [1] |
RMSE Score [1] |
Seasonal Cycle Score [1] |
Spatial Distribution Score [1] |
Overall Score [1] |
|||
|---|---|---|---|---|---|---|---|---|---|---|---|---|---|---|---|---|
| Benchmark | [-] | 62.6 | ||||||||||||||
| h0 | [-] | 64.6 | 64.7 | 60.2 | 92.8 | 5.70 | 17.0 | 1.31 | 0.261 | 0.512 | 0.823 | 0.957 | 0.613 | |||
| h0a | [-] | 64.6 | 64.7 | 60.2 | 92.8 | 5.70 | 17.0 | 1.31 | 0.261 | 0.512 | 0.823 | 0.957 | 0.613 |
Temporally integrated period mean