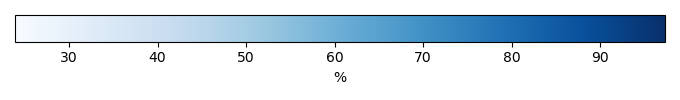
Mean State
Download Data |
Period Mean (original grids) [%] |
Model Period Mean (intersection) [%] |
Benchmark Period Mean (intersection) [%] |
Model Period Mean (complement) [%] |
Benchmark Period Mean (complement) [%] |
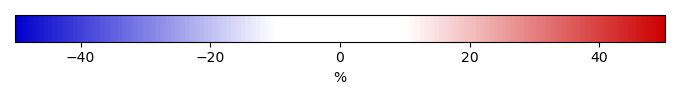
Bias [%] |
RMSE [%] |
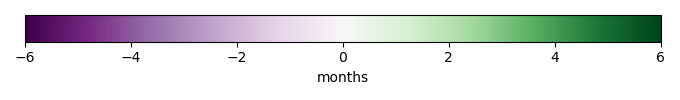
Phase Shift [months] |
Bias Score [1] |
RMSE Score [1] |
Seasonal Cycle Score [1] |
Spatial Distribution Score [1] |
Overall Score [1] |
|||
|---|---|---|---|---|---|---|---|---|---|---|---|---|---|---|---|---|
| Benchmark | [-] | 59.9 | ||||||||||||||
| h0 | [-] | 70.3 | 70.5 | 58.6 | 90.6 | 12.8 | 16.7 | 2.13 | 0.165 | 0.245 | 0.673 | 0.812 | 0.428 | |||
| h0a | [-] | 70.3 | 70.5 | 58.6 | 90.6 | 12.8 | 16.7 | 2.13 | 0.165 | 0.245 | 0.673 | 0.812 | 0.428 |
Download Data |
Period Mean (original grids) [%] |
Model Period Mean (intersection) [%] |
Benchmark Period Mean (intersection) [%] |
Model Period Mean (complement) [%] |
Benchmark Period Mean (complement) [%] |
Bias [%] |
RMSE [%] |
Phase Shift [months] |
Bias Score [1] |
RMSE Score [1] |
Seasonal Cycle Score [1] |
Spatial Distribution Score [1] |
Overall Score [1] |
|||
|---|---|---|---|---|---|---|---|---|---|---|---|---|---|---|---|---|
| Benchmark | [-] | 41.5 | ||||||||||||||
| h0 | [-] | 51.2 | 50.6 | 41.1 | 90.2 | 9.91 | 14.3 | 0.407 | 0.456 | 0.505 | 0.957 | 0.972 | 0.679 | |||
| h0a | [-] | 51.2 | 50.6 | 41.1 | 90.2 | 9.91 | 14.3 | 0.407 | 0.456 | 0.505 | 0.957 | 0.972 | 0.679 |
Download Data |
Period Mean (original grids) [%] |
Model Period Mean (intersection) [%] |
Benchmark Period Mean (intersection) [%] |
Model Period Mean (complement) [%] |
Benchmark Period Mean (complement) [%] |
Bias [%] |
RMSE [%] |
Phase Shift [months] |
Bias Score [1] |
RMSE Score [1] |
Seasonal Cycle Score [1] |
Spatial Distribution Score [1] |
Overall Score [1] |
|||
|---|---|---|---|---|---|---|---|---|---|---|---|---|---|---|---|---|
| Benchmark | [-] | 56.4 | ||||||||||||||
| h0 | [-] | 62.1 | 62.0 | 54.9 | 90.5 | 8.45 | 13.5 | 1.35 | 0.263 | 0.376 | 0.809 | 0.966 | 0.558 | |||
| h0a | [-] | 62.1 | 62.0 | 54.9 | 90.5 | 8.45 | 13.5 | 1.35 | 0.263 | 0.376 | 0.809 | 0.966 | 0.558 |
Download Data |
Period Mean (original grids) [%] |
Model Period Mean (intersection) [%] |
Benchmark Period Mean (intersection) [%] |
Model Period Mean (complement) [%] |
Benchmark Period Mean (complement) [%] |
Bias [%] |
RMSE [%] |
Phase Shift [months] |
Bias Score [1] |
RMSE Score [1] |
Seasonal Cycle Score [1] |
Spatial Distribution Score [1] |
Overall Score [1] |
|||
|---|---|---|---|---|---|---|---|---|---|---|---|---|---|---|---|---|
| Benchmark | [-] | 76.4 | ||||||||||||||
| h0 | [-] | 88.2 | 88.2 | 75.1 | 93.4 | 13.5 | 19.0 | 2.25 | 0.466 | 0.524 | 0.647 | 0.248 | 0.482 | |||
| h0a | [-] | 88.2 | 88.2 | 75.1 | 93.4 | 13.5 | 19.0 | 2.25 | 0.466 | 0.524 | 0.647 | 0.248 | 0.482 |
Download Data |
Period Mean (original grids) [%] |
Model Period Mean (intersection) [%] |
Benchmark Period Mean (intersection) [%] |
Model Period Mean (complement) [%] |
Benchmark Period Mean (complement) [%] |
Bias [%] |
RMSE [%] |
Phase Shift [months] |
Bias Score [1] |
RMSE Score [1] |
Seasonal Cycle Score [1] |
Spatial Distribution Score [1] |
Overall Score [1] |
|||
|---|---|---|---|---|---|---|---|---|---|---|---|---|---|---|---|---|
| Benchmark | [-] | 73.9 | ||||||||||||||
| h0 | [-] | 83.2 | 83.2 | 70.5 | 90.7 | 12.1 | 17.8 | 2.40 | 0.00255 | 0.328 | 0.625 | 0.181 | 0.293 | |||
| h0a | [-] | 83.2 | 83.2 | 70.5 | 90.7 | 12.1 | 17.8 | 2.40 | 0.00255 | 0.328 | 0.625 | 0.181 | 0.293 |
Download Data |
Period Mean (original grids) [%] |
Model Period Mean (intersection) [%] |
Benchmark Period Mean (intersection) [%] |
Model Period Mean (complement) [%] |
Benchmark Period Mean (complement) [%] |
Bias [%] |
RMSE [%] |
Phase Shift [months] |
Bias Score [1] |
RMSE Score [1] |
Seasonal Cycle Score [1] |
Spatial Distribution Score [1] |
Overall Score [1] |
|||
|---|---|---|---|---|---|---|---|---|---|---|---|---|---|---|---|---|
| Benchmark | [-] | 72.7 | ||||||||||||||
| h0 | [-] | 82.8 | 82.9 | 72.6 | 92.7 | 10.3 | 14.9 | 1.71 | 0.553 | 0.567 | 0.765 | 0.503 | 0.591 | |||
| h0a | [-] | 82.8 | 82.9 | 72.6 | 92.7 | 10.3 | 14.9 | 1.71 | 0.553 | 0.567 | 0.765 | 0.503 | 0.591 |
Download Data |
Period Mean (original grids) [%] |
Model Period Mean (intersection) [%] |
Benchmark Period Mean (intersection) [%] |
Model Period Mean (complement) [%] |
Benchmark Period Mean (complement) [%] |
Bias [%] |
RMSE [%] |
Phase Shift [months] |
Bias Score [1] |
RMSE Score [1] |
Seasonal Cycle Score [1] |
Spatial Distribution Score [1] |
Overall Score [1] |
|||
|---|---|---|---|---|---|---|---|---|---|---|---|---|---|---|---|---|
| Benchmark | [-] | 52.8 | ||||||||||||||
| h0 | [-] | 65.4 | 65.7 | 52.2 | 87.7 | 14.1 | 20.6 | 1.77 | 0.428 | 0.521 | 0.727 | 0.857 | 0.611 | |||
| h0a | [-] | 65.4 | 65.7 | 52.2 | 87.7 | 14.1 | 20.6 | 1.77 | 0.428 | 0.521 | 0.727 | 0.857 | 0.611 |
Download Data |
Period Mean (original grids) [%] |
Model Period Mean (intersection) [%] |
Benchmark Period Mean (intersection) [%] |
Model Period Mean (complement) [%] |
Benchmark Period Mean (complement) [%] |
Bias [%] |
RMSE [%] |
Phase Shift [months] |
Bias Score [1] |
RMSE Score [1] |
Seasonal Cycle Score [1] |
Spatial Distribution Score [1] |
Overall Score [1] |
|||
|---|---|---|---|---|---|---|---|---|---|---|---|---|---|---|---|---|
| Benchmark | [-] | 54.8 | ||||||||||||||
| h0 | [-] | 60.1 | 59.8 | 52.6 | 90.7 | 9.88 | 16.4 | 1.36 | 0.276 | 0.395 | 0.801 | 0.982 | 0.570 | |||
| h0a | [-] | 60.1 | 59.8 | 52.6 | 90.7 | 9.88 | 16.4 | 1.36 | 0.276 | 0.395 | 0.801 | 0.982 | 0.570 |
Download Data |
Period Mean (original grids) [%] |
Model Period Mean (intersection) [%] |
Benchmark Period Mean (intersection) [%] |
Model Period Mean (complement) [%] |
Benchmark Period Mean (complement) [%] |
Bias [%] |
RMSE [%] |
Phase Shift [months] |
Bias Score [1] |
RMSE Score [1] |
Seasonal Cycle Score [1] |
Spatial Distribution Score [1] |
Overall Score [1] |
|||
|---|---|---|---|---|---|---|---|---|---|---|---|---|---|---|---|---|
| Benchmark | [-] | 79.7 | ||||||||||||||
| h0 | [-] | 89.6 | 89.5 | 79.2 | 93.7 | 10.7 | 14.5 | 3.54 | 0.527 | 0.579 | 0.390 | 0.424 | 0.500 | |||
| h0a | [-] | 89.6 | 89.5 | 79.2 | 93.7 | 10.7 | 14.5 | 3.54 | 0.527 | 0.579 | 0.390 | 0.424 | 0.500 |
Download Data |
Period Mean (original grids) [%] |
Model Period Mean (intersection) [%] |
Benchmark Period Mean (intersection) [%] |
Model Period Mean (complement) [%] |
Benchmark Period Mean (complement) [%] |
Bias [%] |
RMSE [%] |
Phase Shift [months] |
Bias Score [1] |
RMSE Score [1] |
Seasonal Cycle Score [1] |
Spatial Distribution Score [1] |
Overall Score [1] |
|||
|---|---|---|---|---|---|---|---|---|---|---|---|---|---|---|---|---|
| Benchmark | [-] | 46.5 | ||||||||||||||
| h0 | [-] | 51.0 | 51.0 | 44.0 | 87.2 | 9.98 | 13.5 | 0.972 | 0.257 | 0.575 | 0.874 | 0.969 | 0.650 | |||
| h0a | [-] | 51.0 | 51.0 | 44.0 | 87.2 | 9.98 | 13.5 | 0.972 | 0.257 | 0.575 | 0.874 | 0.969 | 0.650 |
Download Data |
Period Mean (original grids) [%] |
Model Period Mean (intersection) [%] |
Benchmark Period Mean (intersection) [%] |
Model Period Mean (complement) [%] |
Benchmark Period Mean (complement) [%] |
Bias [%] |
RMSE [%] |
Phase Shift [months] |
Bias Score [1] |
RMSE Score [1] |
Seasonal Cycle Score [1] |
Spatial Distribution Score [1] |
Overall Score [1] |
|||
|---|---|---|---|---|---|---|---|---|---|---|---|---|---|---|---|---|
| Benchmark | [-] | 72.6 | ||||||||||||||
| h0 | [-] | 79.9 | 79.9 | 71.4 | 89.9 | 8.29 | 12.8 | 0.762 | 0.380 | 0.621 | 0.917 | 0.819 | 0.671 | |||
| h0a | [-] | 79.9 | 79.9 | 71.4 | 89.9 | 8.29 | 12.8 | 0.762 | 0.380 | 0.621 | 0.917 | 0.819 | 0.671 |
Download Data |
Period Mean (original grids) [%] |
Model Period Mean (intersection) [%] |
Benchmark Period Mean (intersection) [%] |
Model Period Mean (complement) [%] |
Benchmark Period Mean (complement) [%] |
Bias [%] |
RMSE [%] |
Phase Shift [months] |
Bias Score [1] |
RMSE Score [1] |
Seasonal Cycle Score [1] |
Spatial Distribution Score [1] |
Overall Score [1] |
|||
|---|---|---|---|---|---|---|---|---|---|---|---|---|---|---|---|---|
| Benchmark | [-] | 62.5 | ||||||||||||||
| h0 | [-] | 69.7 | 69.7 | 61.3 | 90.6 | 9.41 | 14.4 | 1.54 | 0.333 | 0.490 | 0.778 | 0.954 | 0.609 | |||
| h0a | [-] | 69.7 | 69.7 | 61.3 | 90.6 | 9.41 | 14.4 | 1.54 | 0.333 | 0.490 | 0.778 | 0.954 | 0.609 |
Download Data |
Period Mean (original grids) [%] |
Model Period Mean (intersection) [%] |
Benchmark Period Mean (intersection) [%] |
Model Period Mean (complement) [%] |
Benchmark Period Mean (complement) [%] |
Bias [%] |
RMSE [%] |
Phase Shift [months] |
Bias Score [1] |
RMSE Score [1] |
Seasonal Cycle Score [1] |
Spatial Distribution Score [1] |
Overall Score [1] |
|||
|---|---|---|---|---|---|---|---|---|---|---|---|---|---|---|---|---|
| Benchmark | [-] | 37.5 | ||||||||||||||
| h0 | [-] | 40.1 | 40.2 | 35.8 | 88.7 | 6.23 | 12.8 | 0.782 | 0.331 | 0.487 | 0.892 | 0.918 | 0.623 | |||
| h0a | [-] | 40.1 | 40.2 | 35.8 | 88.7 | 6.23 | 12.8 | 0.782 | 0.331 | 0.487 | 0.892 | 0.918 | 0.623 |
Download Data |
Period Mean (original grids) [%] |
Model Period Mean (intersection) [%] |
Benchmark Period Mean (intersection) [%] |
Model Period Mean (complement) [%] |
Benchmark Period Mean (complement) [%] |
Bias [%] |
RMSE [%] |
Phase Shift [months] |
Bias Score [1] |
RMSE Score [1] |
Seasonal Cycle Score [1] |
Spatial Distribution Score [1] |
Overall Score [1] |
|||
|---|---|---|---|---|---|---|---|---|---|---|---|---|---|---|---|---|
| Benchmark | [-] | 85.6 | ||||||||||||||
| h0 | [-] | 88.9 | 88.9 | 85.2 | 93.9 | 4.45 | 9.85 | 2.16 | 0.613 | 0.530 | 0.673 | 0.603 | 0.590 | |||
| h0a | [-] | 88.9 | 88.9 | 85.2 | 93.9 | 4.45 | 9.85 | 2.16 | 0.613 | 0.530 | 0.673 | 0.603 | 0.590 |
Download Data |
Period Mean (original grids) [%] |
Model Period Mean (intersection) [%] |
Benchmark Period Mean (intersection) [%] |
Model Period Mean (complement) [%] |
Benchmark Period Mean (complement) [%] |
Bias [%] |
RMSE [%] |
Phase Shift [months] |
Bias Score [1] |
RMSE Score [1] |
Seasonal Cycle Score [1] |
Spatial Distribution Score [1] |
Overall Score [1] |
|||
|---|---|---|---|---|---|---|---|---|---|---|---|---|---|---|---|---|
| Benchmark | [-] | 62.1 | ||||||||||||||
| h0 | [-] | 66.5 | 66.6 | 57.5 | 89.6 | 11.1 | 17.2 | 1.63 | 0.104 | 0.468 | 0.759 | 0.875 | 0.535 | |||
| h0a | [-] | 66.5 | 66.6 | 57.5 | 89.6 | 11.1 | 17.2 | 1.63 | 0.104 | 0.468 | 0.759 | 0.875 | 0.535 |
Download Data |
Period Mean (original grids) [%] |
Model Period Mean (intersection) [%] |
Benchmark Period Mean (intersection) [%] |
Model Period Mean (complement) [%] |
Benchmark Period Mean (complement) [%] |
Bias [%] |
RMSE [%] |
Phase Shift [months] |
Bias Score [1] |
RMSE Score [1] |
Seasonal Cycle Score [1] |
Spatial Distribution Score [1] |
Overall Score [1] |
|||
|---|---|---|---|---|---|---|---|---|---|---|---|---|---|---|---|---|
| Benchmark | [-] | 64.7 | ||||||||||||||
| h0 | [-] | 76.9 | 77.0 | 63.6 | 90.5 | 13.4 | 15.5 | 1.57 | 0.201 | 0.567 | 0.759 | 0.772 | 0.573 | |||
| h0a | [-] | 76.9 | 77.0 | 63.6 | 90.5 | 13.4 | 15.5 | 1.57 | 0.201 | 0.567 | 0.759 | 0.772 | 0.573 |
Download Data |
Period Mean (original grids) [%] |
Model Period Mean (intersection) [%] |
Benchmark Period Mean (intersection) [%] |
Model Period Mean (complement) [%] |
Benchmark Period Mean (complement) [%] |
Bias [%] |
RMSE [%] |
Phase Shift [months] |
Bias Score [1] |
RMSE Score [1] |
Seasonal Cycle Score [1] |
Spatial Distribution Score [1] |
Overall Score [1] |
|||
|---|---|---|---|---|---|---|---|---|---|---|---|---|---|---|---|---|
| Benchmark | [-] | 77.4 | ||||||||||||||
| h0 | [-] | 82.1 | 82.1 | 77.1 | 90.6 | 5.06 | 7.82 | 0.953 | 0.678 | 0.704 | 0.901 | 0.876 | 0.773 | |||
| h0a | [-] | 82.1 | 82.1 | 77.1 | 90.6 | 5.06 | 7.82 | 0.953 | 0.678 | 0.704 | 0.901 | 0.876 | 0.773 |
Download Data |
Period Mean (original grids) [%] |
Model Period Mean (intersection) [%] |
Benchmark Period Mean (intersection) [%] |
Model Period Mean (complement) [%] |
Benchmark Period Mean (complement) [%] |
Bias [%] |
RMSE [%] |
Phase Shift [months] |
Bias Score [1] |
RMSE Score [1] |
Seasonal Cycle Score [1] |
Spatial Distribution Score [1] |
Overall Score [1] |
|||
|---|---|---|---|---|---|---|---|---|---|---|---|---|---|---|---|---|
| Benchmark | [-] | 51.6 | ||||||||||||||
| h0 | [-] | 63.5 | 63.5 | 50.9 | 88.5 | 12.8 | 15.0 | 0.844 | 0.387 | 0.615 | 0.909 | 0.996 | 0.704 | |||
| h0a | [-] | 63.5 | 63.5 | 50.9 | 88.5 | 12.8 | 15.0 | 0.844 | 0.387 | 0.615 | 0.909 | 0.996 | 0.704 |
Download Data |
Period Mean (original grids) [%] |
Model Period Mean (intersection) [%] |
Benchmark Period Mean (intersection) [%] |
Model Period Mean (complement) [%] |
Benchmark Period Mean (complement) [%] |
Bias [%] |
RMSE [%] |
Phase Shift [months] |
Bias Score [1] |
RMSE Score [1] |
Seasonal Cycle Score [1] |
Spatial Distribution Score [1] |
Overall Score [1] |
|||
|---|---|---|---|---|---|---|---|---|---|---|---|---|---|---|---|---|
| Benchmark | [-] | 64.8 | ||||||||||||||
| h0 | [-] | 77.9 | 77.9 | 64.2 | 92.2 | 13.9 | 17.4 | 1.74 | 0.0962 | 0.236 | 0.757 | 0.937 | 0.452 | |||
| h0a | [-] | 77.9 | 77.9 | 64.2 | 92.2 | 13.9 | 17.4 | 1.74 | 0.0962 | 0.236 | 0.757 | 0.937 | 0.452 |
Download Data |
Period Mean (original grids) [%] |
Model Period Mean (intersection) [%] |
Benchmark Period Mean (intersection) [%] |
Model Period Mean (complement) [%] |
Benchmark Period Mean (complement) [%] |
Bias [%] |
RMSE [%] |
Phase Shift [months] |
Bias Score [1] |
RMSE Score [1] |
Seasonal Cycle Score [1] |
Spatial Distribution Score [1] |
Overall Score [1] |
|||
|---|---|---|---|---|---|---|---|---|---|---|---|---|---|---|---|---|
| Benchmark | [-] | 59.3 | ||||||||||||||
| h0 | [-] | 72.0 | 71.8 | 58.3 | 91.8 | 13.8 | 16.8 | 1.31 | 0.234 | 0.479 | 0.836 | 0.889 | 0.583 | |||
| h0a | [-] | 72.0 | 71.8 | 58.3 | 91.8 | 13.8 | 16.8 | 1.31 | 0.234 | 0.479 | 0.836 | 0.889 | 0.583 |
Download Data |
Period Mean (original grids) [%] |
Model Period Mean (intersection) [%] |
Benchmark Period Mean (intersection) [%] |
Model Period Mean (complement) [%] |
Benchmark Period Mean (complement) [%] |
Bias [%] |
RMSE [%] |
Phase Shift [months] |
Bias Score [1] |
RMSE Score [1] |
Seasonal Cycle Score [1] |
Spatial Distribution Score [1] |
Overall Score [1] |
|||
|---|---|---|---|---|---|---|---|---|---|---|---|---|---|---|---|---|
| Benchmark | [-] | 57.5 | ||||||||||||||
| h0 | [-] | 64.7 | 64.8 | 54.8 | 91.9 | 11.1 | 18.2 | 1.26 | 0.230 | 0.562 | 0.828 | 0.964 | 0.629 | |||
| h0a | [-] | 64.7 | 64.8 | 54.8 | 91.9 | 11.1 | 18.2 | 1.26 | 0.230 | 0.562 | 0.828 | 0.964 | 0.629 |
Temporally integrated period mean