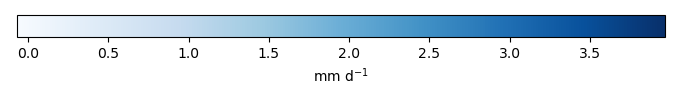
Mean State
Download Data |
Period Mean (original grids) [mm d-1] |
Model Period Mean (intersection) [mm d-1] |
Benchmark Period Mean (intersection) [mm d-1] |
Model Period Mean (complement) [mm d-1] |
Benchmark Period Mean (complement) [mm d-1] |
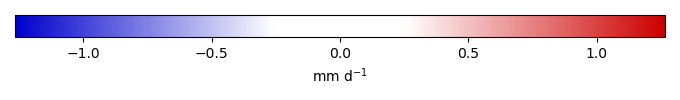
Bias [mm d-1] |
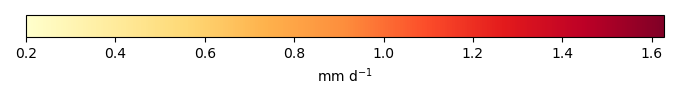
RMSE [mm d-1] |
Phase Shift [months] |
Bias Score [1] |
RMSE Score [1] |
Seasonal Cycle Score [1] |
Spatial Distribution Score [1] |
Overall Score [1] |
|||
|---|---|---|---|---|---|---|---|---|---|---|---|---|---|---|---|---|
| Benchmark | [-] | 2.48 | ||||||||||||||
| h0 | [-] | 2.48 | 2.52 | 2.48 | 1.72 | 0.262 | 0.0245 | 0.710 | 3.09 | 0.588 | 0.608 | 0.480 | 0.957 | 0.648 | ||
| h0a | [-] | 2.48 | 2.52 | 2.48 | 1.72 | 0.262 | 0.0245 | 0.710 | 3.09 | 0.588 | 0.608 | 0.480 | 0.957 | 0.648 |
Download Data |
Period Mean (original grids) [mm d-1] |
Model Period Mean (intersection) [mm d-1] |
Benchmark Period Mean (intersection) [mm d-1] |
Model Period Mean (complement) [mm d-1] |
Benchmark Period Mean (complement) [mm d-1] |
Bias [mm d-1] |
RMSE [mm d-1] |
Phase Shift [months] |
Bias Score [1] |
RMSE Score [1] |
Seasonal Cycle Score [1] |
Spatial Distribution Score [1] |
Overall Score [1] |
|||
|---|---|---|---|---|---|---|---|---|---|---|---|---|---|---|---|---|
| Benchmark | [-] | 1.21 | ||||||||||||||
| h0 | [-] | 1.66 | 1.67 | 1.21 | 0.751 | 2.75 | 0.458 | 1.06 | 1.15 | 0.318 | 0.377 | 0.851 | 0.798 | 0.544 | ||
| h0a | [-] | 1.66 | 1.67 | 1.21 | 0.751 | 2.75 | 0.458 | 1.06 | 1.15 | 0.318 | 0.377 | 0.851 | 0.798 | 0.544 |
Download Data |
Period Mean (original grids) [mm d-1] |
Model Period Mean (intersection) [mm d-1] |
Benchmark Period Mean (intersection) [mm d-1] |
Model Period Mean (complement) [mm d-1] |
Benchmark Period Mean (complement) [mm d-1] |
Bias [mm d-1] |
RMSE [mm d-1] |
Phase Shift [months] |
Bias Score [1] |
RMSE Score [1] |
Seasonal Cycle Score [1] |
Spatial Distribution Score [1] |
Overall Score [1] |
|||
|---|---|---|---|---|---|---|---|---|---|---|---|---|---|---|---|---|
| Benchmark | [-] | 1.66 | ||||||||||||||
| h0 | [-] | 1.57 | 1.56 | 1.66 | 1.65 | 2.12 | -0.0838 | 0.833 | 1.28 | 0.541 | 0.492 | 0.833 | 0.906 | 0.652 | ||
| h0a | [-] | 1.57 | 1.56 | 1.66 | 1.65 | 2.12 | -0.0838 | 0.833 | 1.28 | 0.541 | 0.492 | 0.833 | 0.906 | 0.652 |
Download Data |
Period Mean (original grids) [mm d-1] |
Model Period Mean (intersection) [mm d-1] |
Benchmark Period Mean (intersection) [mm d-1] |
Model Period Mean (complement) [mm d-1] |
Benchmark Period Mean (complement) [mm d-1] |
Bias [mm d-1] |
RMSE [mm d-1] |
Phase Shift [months] |
Bias Score [1] |
RMSE Score [1] |
Seasonal Cycle Score [1] |
Spatial Distribution Score [1] |
Overall Score [1] |
|||
|---|---|---|---|---|---|---|---|---|---|---|---|---|---|---|---|---|
| Benchmark | [-] | 0.854 | ||||||||||||||
| h0 | [-] | 0.398 | 0.401 | 0.854 | 0.357 | 0.929 | -0.453 | 0.620 | 0.321 | 0.0615 | 0.196 | 0.978 | 0.951 | 0.476 | ||
| h0a | [-] | 0.398 | 0.401 | 0.854 | 0.357 | 0.929 | -0.453 | 0.620 | 0.321 | 0.0615 | 0.196 | 0.978 | 0.951 | 0.476 |
Download Data |
Period Mean (original grids) [mm d-1] |
Model Period Mean (intersection) [mm d-1] |
Benchmark Period Mean (intersection) [mm d-1] |
Model Period Mean (complement) [mm d-1] |
Benchmark Period Mean (complement) [mm d-1] |
Bias [mm d-1] |
RMSE [mm d-1] |
Phase Shift [months] |
Bias Score [1] |
RMSE Score [1] |
Seasonal Cycle Score [1] |
Spatial Distribution Score [1] |
Overall Score [1] |
|||
|---|---|---|---|---|---|---|---|---|---|---|---|---|---|---|---|---|
| Benchmark | [-] | 3.76 | ||||||||||||||
| h0 | [-] | 3.44 | 3.44 | 3.76 | 3.45 | 4.01 | -0.310 | 0.488 | 2.80 | 0.525 | 0.780 | 0.548 | 0.982 | 0.723 | ||
| h0a | [-] | 3.44 | 3.44 | 3.76 | 3.45 | 4.01 | -0.310 | 0.488 | 2.80 | 0.525 | 0.780 | 0.548 | 0.982 | 0.723 |
Download Data |
Period Mean (original grids) [mm d-1] |
Model Period Mean (intersection) [mm d-1] |
Benchmark Period Mean (intersection) [mm d-1] |
Model Period Mean (complement) [mm d-1] |
Benchmark Period Mean (complement) [mm d-1] |
Bias [mm d-1] |
RMSE [mm d-1] |
Phase Shift [months] |
Bias Score [1] |
RMSE Score [1] |
Seasonal Cycle Score [1] |
Spatial Distribution Score [1] |
Overall Score [1] |
|||
|---|---|---|---|---|---|---|---|---|---|---|---|---|---|---|---|---|
| Benchmark | [-] | 1.12 | ||||||||||||||
| h0 | [-] | 0.815 | 0.812 | 1.11 | 0.805 | 1.33 | -0.304 | 0.487 | 0.332 | 0.201 | 0.391 | 0.977 | 0.876 | 0.567 | ||
| h0a | [-] | 0.815 | 0.812 | 1.11 | 0.805 | 1.33 | -0.304 | 0.487 | 0.332 | 0.201 | 0.391 | 0.977 | 0.876 | 0.567 |
Download Data |
Period Mean (original grids) [mm d-1] |
Model Period Mean (intersection) [mm d-1] |
Benchmark Period Mean (intersection) [mm d-1] |
Model Period Mean (complement) [mm d-1] |
Benchmark Period Mean (complement) [mm d-1] |
Bias [mm d-1] |
RMSE [mm d-1] |
Phase Shift [months] |
Bias Score [1] |
RMSE Score [1] |
Seasonal Cycle Score [1] |
Spatial Distribution Score [1] |
Overall Score [1] |
|||
|---|---|---|---|---|---|---|---|---|---|---|---|---|---|---|---|---|
| Benchmark | [-] | 1.17 | ||||||||||||||
| h0 | [-] | 0.941 | 1.02 | 1.17 | 0.576 | 2.42 | -0.132 | 0.655 | 1.45 | 0.535 | 0.363 | 0.791 | 0.893 | 0.589 | ||
| h0a | [-] | 0.941 | 1.02 | 1.17 | 0.576 | 2.42 | -0.132 | 0.655 | 1.45 | 0.535 | 0.363 | 0.791 | 0.893 | 0.589 |
Download Data |
Period Mean (original grids) [mm d-1] |
Model Period Mean (intersection) [mm d-1] |
Benchmark Period Mean (intersection) [mm d-1] |
Model Period Mean (complement) [mm d-1] |
Benchmark Period Mean (complement) [mm d-1] |
Bias [mm d-1] |
RMSE [mm d-1] |
Phase Shift [months] |
Bias Score [1] |
RMSE Score [1] |
Seasonal Cycle Score [1] |
Spatial Distribution Score [1] |
Overall Score [1] |
|||
|---|---|---|---|---|---|---|---|---|---|---|---|---|---|---|---|---|
| Benchmark | [-] | 2.11 | ||||||||||||||
| h0 | [-] | 1.87 | 1.92 | 2.10 | 1.45 | 3.41 | -0.122 | 0.720 | 1.64 | 0.552 | 0.580 | 0.764 | 0.925 | 0.680 | ||
| h0a | [-] | 1.87 | 1.92 | 2.10 | 1.45 | 3.41 | -0.122 | 0.720 | 1.64 | 0.552 | 0.580 | 0.764 | 0.925 | 0.680 |
Download Data |
Period Mean (original grids) [mm d-1] |
Model Period Mean (intersection) [mm d-1] |
Benchmark Period Mean (intersection) [mm d-1] |
Model Period Mean (complement) [mm d-1] |
Benchmark Period Mean (complement) [mm d-1] |
Bias [mm d-1] |
RMSE [mm d-1] |
Phase Shift [months] |
Bias Score [1] |
RMSE Score [1] |
Seasonal Cycle Score [1] |
Spatial Distribution Score [1] |
Overall Score [1] |
|||
|---|---|---|---|---|---|---|---|---|---|---|---|---|---|---|---|---|
| Benchmark | [-] | 0.786 | ||||||||||||||
| h0 | [-] | 0.511 | 0.540 | 0.786 | 0.249 | 0.867 | -0.250 | 0.535 | 0.398 | 0.243 | 0.147 | 0.973 | 0.892 | 0.480 | ||
| h0a | [-] | 0.511 | 0.540 | 0.786 | 0.249 | 0.867 | -0.250 | 0.535 | 0.398 | 0.243 | 0.147 | 0.973 | 0.892 | 0.480 |
Download Data |
Period Mean (original grids) [mm d-1] |
Model Period Mean (intersection) [mm d-1] |
Benchmark Period Mean (intersection) [mm d-1] |
Model Period Mean (complement) [mm d-1] |
Benchmark Period Mean (complement) [mm d-1] |
Bias [mm d-1] |
RMSE [mm d-1] |
Phase Shift [months] |
Bias Score [1] |
RMSE Score [1] |
Seasonal Cycle Score [1] |
Spatial Distribution Score [1] |
Overall Score [1] |
|||
|---|---|---|---|---|---|---|---|---|---|---|---|---|---|---|---|---|
| Benchmark | [-] | 0.785 | ||||||||||||||
| h0 | [-] | 1.10 | 1.06 | 0.783 | 1.87 | 1.85 | 0.328 | 0.560 | 2.07 | 0.535 | 0.660 | 0.686 | 0.948 | 0.698 | ||
| h0a | [-] | 1.10 | 1.06 | 0.783 | 1.87 | 1.85 | 0.328 | 0.560 | 2.07 | 0.535 | 0.660 | 0.686 | 0.948 | 0.698 |
Download Data |
Period Mean (original grids) [mm d-1] |
Model Period Mean (intersection) [mm d-1] |
Benchmark Period Mean (intersection) [mm d-1] |
Model Period Mean (complement) [mm d-1] |
Benchmark Period Mean (complement) [mm d-1] |
Bias [mm d-1] |
RMSE [mm d-1] |
Phase Shift [months] |
Bias Score [1] |
RMSE Score [1] |
Seasonal Cycle Score [1] |
Spatial Distribution Score [1] |
Overall Score [1] |
|||
|---|---|---|---|---|---|---|---|---|---|---|---|---|---|---|---|---|
| Benchmark | [-] | 1.32 | ||||||||||||||
| h0 | [-] | 1.12 | 1.13 | 1.32 | 1.08 | 1.41 | -0.195 | 0.533 | 0.653 | 0.406 | 0.537 | 0.954 | 0.954 | 0.677 | ||
| h0a | [-] | 1.12 | 1.13 | 1.32 | 1.08 | 1.41 | -0.195 | 0.533 | 0.653 | 0.406 | 0.537 | 0.954 | 0.954 | 0.677 |
Download Data |
Period Mean (original grids) [mm d-1] |
Model Period Mean (intersection) [mm d-1] |
Benchmark Period Mean (intersection) [mm d-1] |
Model Period Mean (complement) [mm d-1] |
Benchmark Period Mean (complement) [mm d-1] |
Bias [mm d-1] |
RMSE [mm d-1] |
Phase Shift [months] |
Bias Score [1] |
RMSE Score [1] |
Seasonal Cycle Score [1] |
Spatial Distribution Score [1] |
Overall Score [1] |
|||
|---|---|---|---|---|---|---|---|---|---|---|---|---|---|---|---|---|
| Benchmark | [-] | 1.56 | ||||||||||||||
| h0 | [-] | 1.16 | 1.47 | 1.56 | 0.318 | 2.46 | -0.0722 | 0.675 | 1.34 | 0.431 | 0.468 | 0.813 | 0.970 | 0.630 | ||
| h0a | [-] | 1.16 | 1.47 | 1.56 | 0.318 | 2.46 | -0.0722 | 0.675 | 1.34 | 0.431 | 0.468 | 0.813 | 0.970 | 0.630 |
Download Data |
Period Mean (original grids) [mm d-1] |
Model Period Mean (intersection) [mm d-1] |
Benchmark Period Mean (intersection) [mm d-1] |
Model Period Mean (complement) [mm d-1] |
Benchmark Period Mean (complement) [mm d-1] |
Bias [mm d-1] |
RMSE [mm d-1] |
Phase Shift [months] |
Bias Score [1] |
RMSE Score [1] |
Seasonal Cycle Score [1] |
Spatial Distribution Score [1] |
Overall Score [1] |
|||
|---|---|---|---|---|---|---|---|---|---|---|---|---|---|---|---|---|
| Benchmark | [-] | 0.604 | ||||||||||||||
| h0 | [-] | 0.325 | 0.841 | 0.603 | 0.201 | 0.816 | 0.247 | 0.731 | 1.94 | 0.522 | 0.386 | 0.709 | 0.944 | 0.589 | ||
| h0a | [-] | 0.325 | 0.841 | 0.603 | 0.201 | 0.816 | 0.247 | 0.731 | 1.94 | 0.522 | 0.386 | 0.709 | 0.944 | 0.589 |
Download Data |
Period Mean (original grids) [mm d-1] |
Model Period Mean (intersection) [mm d-1] |
Benchmark Period Mean (intersection) [mm d-1] |
Model Period Mean (complement) [mm d-1] |
Benchmark Period Mean (complement) [mm d-1] |
Bias [mm d-1] |
RMSE [mm d-1] |
Phase Shift [months] |
Bias Score [1] |
RMSE Score [1] |
Seasonal Cycle Score [1] |
Spatial Distribution Score [1] |
Overall Score [1] |
|||
|---|---|---|---|---|---|---|---|---|---|---|---|---|---|---|---|---|
| Benchmark | [-] | 0.875 | ||||||||||||||
| h0 | [-] | 0.528 | 0.615 | 0.875 | 0.275 | 1.05 | -0.264 | 0.559 | 0.561 | 0.253 | 0.186 | 0.962 | 0.907 | 0.499 | ||
| h0a | [-] | 0.528 | 0.615 | 0.875 | 0.275 | 1.05 | -0.264 | 0.559 | 0.561 | 0.253 | 0.186 | 0.962 | 0.907 | 0.499 |
Download Data |
Period Mean (original grids) [mm d-1] |
Model Period Mean (intersection) [mm d-1] |
Benchmark Period Mean (intersection) [mm d-1] |
Model Period Mean (complement) [mm d-1] |
Benchmark Period Mean (complement) [mm d-1] |
Bias [mm d-1] |
RMSE [mm d-1] |
Phase Shift [months] |
Bias Score [1] |
RMSE Score [1] |
Seasonal Cycle Score [1] |
Spatial Distribution Score [1] |
Overall Score [1] |
|||
|---|---|---|---|---|---|---|---|---|---|---|---|---|---|---|---|---|
| Benchmark | [-] | 2.13 | ||||||||||||||
| h0 | [-] | 2.07 | 2.02 | 2.13 | 2.48 | 3.11 | -0.0244 | 0.662 | 1.60 | 0.538 | 0.628 | 0.784 | 0.976 | 0.711 | ||
| h0a | [-] | 2.07 | 2.02 | 2.13 | 2.48 | 3.11 | -0.0244 | 0.662 | 1.60 | 0.538 | 0.628 | 0.784 | 0.976 | 0.711 |
Download Data |
Period Mean (original grids) [mm d-1] |
Model Period Mean (intersection) [mm d-1] |
Benchmark Period Mean (intersection) [mm d-1] |
Model Period Mean (complement) [mm d-1] |
Benchmark Period Mean (complement) [mm d-1] |
Bias [mm d-1] |
RMSE [mm d-1] |
Phase Shift [months] |
Bias Score [1] |
RMSE Score [1] |
Seasonal Cycle Score [1] |
Spatial Distribution Score [1] |
Overall Score [1] |
|||
|---|---|---|---|---|---|---|---|---|---|---|---|---|---|---|---|---|
| Benchmark | [-] | 1.88 | ||||||||||||||
| h0 | [-] | 1.77 | 1.78 | 1.88 | 1.78 | 2.22 | -0.0787 | 0.537 | 0.475 | 0.459 | 0.500 | 0.956 | 0.976 | 0.678 | ||
| h0a | [-] | 1.77 | 1.78 | 1.88 | 1.78 | 2.22 | -0.0787 | 0.537 | 0.475 | 0.459 | 0.500 | 0.956 | 0.976 | 0.678 |
Download Data |
Period Mean (original grids) [mm d-1] |
Model Period Mean (intersection) [mm d-1] |
Benchmark Period Mean (intersection) [mm d-1] |
Model Period Mean (complement) [mm d-1] |
Benchmark Period Mean (complement) [mm d-1] |
Bias [mm d-1] |
RMSE [mm d-1] |
Phase Shift [months] |
Bias Score [1] |
RMSE Score [1] |
Seasonal Cycle Score [1] |
Spatial Distribution Score [1] |
Overall Score [1] |
|||
|---|---|---|---|---|---|---|---|---|---|---|---|---|---|---|---|---|
| Benchmark | [-] | 1.13 | ||||||||||||||
| h0 | [-] | 1.03 | 1.03 | 1.13 | 1.08 | 1.46 | -0.101 | 0.499 | 0.156 | 0.528 | 0.334 | 0.989 | 0.990 | 0.635 | ||
| h0a | [-] | 1.03 | 1.03 | 1.13 | 1.08 | 1.46 | -0.101 | 0.499 | 0.156 | 0.528 | 0.334 | 0.989 | 0.990 | 0.635 |
Download Data |
Period Mean (original grids) [mm d-1] |
Model Period Mean (intersection) [mm d-1] |
Benchmark Period Mean (intersection) [mm d-1] |
Model Period Mean (complement) [mm d-1] |
Benchmark Period Mean (complement) [mm d-1] |
Bias [mm d-1] |
RMSE [mm d-1] |
Phase Shift [months] |
Bias Score [1] |
RMSE Score [1] |
Seasonal Cycle Score [1] |
Spatial Distribution Score [1] |
Overall Score [1] |
|||
|---|---|---|---|---|---|---|---|---|---|---|---|---|---|---|---|---|
| Benchmark | [-] | 0.788 | ||||||||||||||
| h0 | [-] | 0.864 | 0.877 | 0.787 | 1.02 | 1.95 | 0.0992 | 0.644 | 1.98 | 0.575 | 0.409 | 0.696 | 0.959 | 0.610 | ||
| h0a | [-] | 0.864 | 0.877 | 0.787 | 1.02 | 1.95 | 0.0992 | 0.644 | 1.98 | 0.575 | 0.409 | 0.696 | 0.959 | 0.610 |
Download Data |
Period Mean (original grids) [mm d-1] |
Model Period Mean (intersection) [mm d-1] |
Benchmark Period Mean (intersection) [mm d-1] |
Model Period Mean (complement) [mm d-1] |
Benchmark Period Mean (complement) [mm d-1] |
Bias [mm d-1] |
RMSE [mm d-1] |
Phase Shift [months] |
Bias Score [1] |
RMSE Score [1] |
Seasonal Cycle Score [1] |
Spatial Distribution Score [1] |
Overall Score [1] |
|||
|---|---|---|---|---|---|---|---|---|---|---|---|---|---|---|---|---|
| Benchmark | [-] | 3.62 | ||||||||||||||
| h0 | [-] | 3.15 | 3.16 | 3.62 | 3.01 | 3.91 | -0.467 | 0.742 | 2.04 | 0.377 | 0.685 | 0.699 | 0.900 | 0.669 | ||
| h0a | [-] | 3.15 | 3.16 | 3.62 | 3.01 | 3.91 | -0.467 | 0.742 | 2.04 | 0.377 | 0.685 | 0.699 | 0.900 | 0.669 |
Download Data |
Period Mean (original grids) [mm d-1] |
Model Period Mean (intersection) [mm d-1] |
Benchmark Period Mean (intersection) [mm d-1] |
Model Period Mean (complement) [mm d-1] |
Benchmark Period Mean (complement) [mm d-1] |
Bias [mm d-1] |
RMSE [mm d-1] |
Phase Shift [months] |
Bias Score [1] |
RMSE Score [1] |
Seasonal Cycle Score [1] |
Spatial Distribution Score [1] |
Overall Score [1] |
|||
|---|---|---|---|---|---|---|---|---|---|---|---|---|---|---|---|---|
| Benchmark | [-] | 1.97 | ||||||||||||||
| h0 | [-] | 2.20 | 2.19 | 1.97 | 2.31 | 1.89 | 0.219 | 0.959 | 1.36 | 0.291 | 0.551 | 0.832 | 0.916 | 0.628 | ||
| h0a | [-] | 2.20 | 2.19 | 1.97 | 2.31 | 1.89 | 0.219 | 0.959 | 1.36 | 0.291 | 0.551 | 0.832 | 0.916 | 0.628 |
Download Data |
Period Mean (original grids) [mm d-1] |
Model Period Mean (intersection) [mm d-1] |
Benchmark Period Mean (intersection) [mm d-1] |
Model Period Mean (complement) [mm d-1] |
Benchmark Period Mean (complement) [mm d-1] |
Bias [mm d-1] |
RMSE [mm d-1] |
Phase Shift [months] |
Bias Score [1] |
RMSE Score [1] |
Seasonal Cycle Score [1] |
Spatial Distribution Score [1] |
Overall Score [1] |
|||
|---|---|---|---|---|---|---|---|---|---|---|---|---|---|---|---|---|
| Benchmark | [-] | 1.18 | ||||||||||||||
| h0 | [-] | 0.953 | 1.06 | 1.18 | 0.496 | 0.995 | -0.110 | 0.619 | 1.78 | 0.469 | 0.522 | 0.734 | 0.944 | 0.638 | ||
| h0a | [-] | 0.953 | 1.06 | 1.18 | 0.496 | 0.995 | -0.110 | 0.619 | 1.78 | 0.469 | 0.522 | 0.734 | 0.944 | 0.638 |
Temporally integrated period mean