Mean State
Download Data |
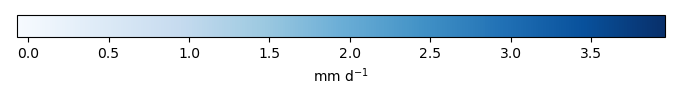
Period Mean (original grids) [mm d-1] |
Model Period Mean (intersection) [mm d-1] |
Benchmark Period Mean (intersection) [mm d-1] |
Model Period Mean (complement) [mm d-1] |
Benchmark Period Mean (complement) [mm d-1] |
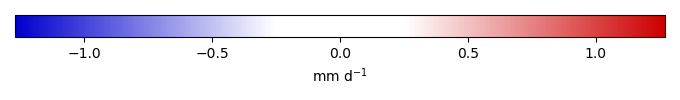
Bias [mm d-1] |
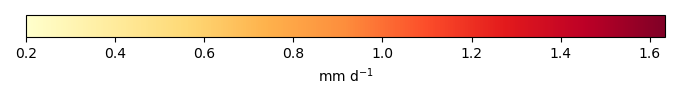
RMSE [mm d-1] |
Phase Shift [months] |
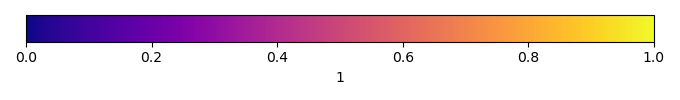
Bias Score [1] |
RMSE Score [1] |
Seasonal Cycle Score [1] |
Spatial Distribution Score [1] |
Overall Score [1] |
|||
|---|---|---|---|---|---|---|---|---|---|---|---|---|---|---|---|---|
| Benchmark | [-] | 2.49 | ||||||||||||||
| h0 | [-] | 2.48 | 2.51 | 2.49 | 1.72 | 0.263 | 0.0107 | 0.699 | 3.01 | 0.595 | 0.611 | 0.492 | 0.959 | 0.654 | ||
| h0a | [-] | 2.48 | 2.51 | 2.49 | 1.72 | 0.263 | 0.0107 | 0.699 | 3.01 | 0.595 | 0.611 | 0.492 | 0.959 | 0.654 |
Download Data |
Period Mean (original grids) [mm d-1] |
Model Period Mean (intersection) [mm d-1] |
Benchmark Period Mean (intersection) [mm d-1] |
Model Period Mean (complement) [mm d-1] |
Benchmark Period Mean (complement) [mm d-1] |
Bias [mm d-1] |
RMSE [mm d-1] |
Phase Shift [months] |
Bias Score [1] |
RMSE Score [1] |
Seasonal Cycle Score [1] |
Spatial Distribution Score [1] |
Overall Score [1] |
|||
|---|---|---|---|---|---|---|---|---|---|---|---|---|---|---|---|---|
| Benchmark | [-] | 1.21 | ||||||||||||||
| h0 | [-] | 1.66 | 1.66 | 1.21 | 0.742 | 2.75 | 0.459 | 1.06 | 1.14 | 0.317 | 0.378 | 0.852 | 0.797 | 0.544 | ||
| h0a | [-] | 1.66 | 1.66 | 1.21 | 0.742 | 2.75 | 0.459 | 1.06 | 1.14 | 0.317 | 0.378 | 0.852 | 0.797 | 0.544 |
Download Data |
Period Mean (original grids) [mm d-1] |
Model Period Mean (intersection) [mm d-1] |
Benchmark Period Mean (intersection) [mm d-1] |
Model Period Mean (complement) [mm d-1] |
Benchmark Period Mean (complement) [mm d-1] |
Bias [mm d-1] |
RMSE [mm d-1] |
Phase Shift [months] |
Bias Score [1] |
RMSE Score [1] |
Seasonal Cycle Score [1] |
Spatial Distribution Score [1] |
Overall Score [1] |
|||
|---|---|---|---|---|---|---|---|---|---|---|---|---|---|---|---|---|
| Benchmark | [-] | 1.67 | ||||||||||||||
| h0 | [-] | 1.57 | 1.56 | 1.67 | 1.65 | 2.12 | -0.0904 | 0.837 | 1.31 | 0.536 | 0.492 | 0.828 | 0.899 | 0.649 | ||
| h0a | [-] | 1.57 | 1.56 | 1.67 | 1.65 | 2.12 | -0.0904 | 0.837 | 1.31 | 0.536 | 0.492 | 0.828 | 0.899 | 0.649 |
Download Data |
Period Mean (original grids) [mm d-1] |
Model Period Mean (intersection) [mm d-1] |
Benchmark Period Mean (intersection) [mm d-1] |
Model Period Mean (complement) [mm d-1] |
Benchmark Period Mean (complement) [mm d-1] |
Bias [mm d-1] |
RMSE [mm d-1] |
Phase Shift [months] |
Bias Score [1] |
RMSE Score [1] |
Seasonal Cycle Score [1] |
Spatial Distribution Score [1] |
Overall Score [1] |
|||
|---|---|---|---|---|---|---|---|---|---|---|---|---|---|---|---|---|
| Benchmark | [-] | 0.851 | ||||||||||||||
| h0 | [-] | 0.399 | 0.402 | 0.851 | 0.359 | 0.925 | -0.449 | 0.615 | 0.319 | 0.0646 | 0.200 | 0.978 | 0.951 | 0.479 | ||
| h0a | [-] | 0.399 | 0.402 | 0.851 | 0.359 | 0.925 | -0.449 | 0.615 | 0.319 | 0.0646 | 0.200 | 0.978 | 0.951 | 0.479 |
Download Data |
Period Mean (original grids) [mm d-1] |
Model Period Mean (intersection) [mm d-1] |
Benchmark Period Mean (intersection) [mm d-1] |
Model Period Mean (complement) [mm d-1] |
Benchmark Period Mean (complement) [mm d-1] |
Bias [mm d-1] |
RMSE [mm d-1] |
Phase Shift [months] |
Bias Score [1] |
RMSE Score [1] |
Seasonal Cycle Score [1] |
Spatial Distribution Score [1] |
Overall Score [1] |
|||
|---|---|---|---|---|---|---|---|---|---|---|---|---|---|---|---|---|
| Benchmark | [-] | 3.76 | ||||||||||||||
| h0 | [-] | 3.44 | 3.44 | 3.75 | 3.45 | 4.01 | -0.307 | 0.488 | 2.87 | 0.528 | 0.778 | 0.530 | 0.982 | 0.719 | ||
| h0a | [-] | 3.44 | 3.44 | 3.75 | 3.45 | 4.01 | -0.307 | 0.488 | 2.87 | 0.528 | 0.778 | 0.530 | 0.982 | 0.719 |
Download Data |
Period Mean (original grids) [mm d-1] |
Model Period Mean (intersection) [mm d-1] |
Benchmark Period Mean (intersection) [mm d-1] |
Model Period Mean (complement) [mm d-1] |
Benchmark Period Mean (complement) [mm d-1] |
Bias [mm d-1] |
RMSE [mm d-1] |
Phase Shift [months] |
Bias Score [1] |
RMSE Score [1] |
Seasonal Cycle Score [1] |
Spatial Distribution Score [1] |
Overall Score [1] |
|||
|---|---|---|---|---|---|---|---|---|---|---|---|---|---|---|---|---|
| Benchmark | [-] | 1.12 | ||||||||||||||
| h0 | [-] | 0.816 | 0.813 | 1.12 | 0.805 | 1.33 | -0.304 | 0.488 | 0.344 | 0.202 | 0.389 | 0.976 | 0.869 | 0.565 | ||
| h0a | [-] | 0.816 | 0.813 | 1.12 | 0.805 | 1.33 | -0.304 | 0.488 | 0.344 | 0.202 | 0.389 | 0.976 | 0.869 | 0.565 |
Download Data |
Period Mean (original grids) [mm d-1] |
Model Period Mean (intersection) [mm d-1] |
Benchmark Period Mean (intersection) [mm d-1] |
Model Period Mean (complement) [mm d-1] |
Benchmark Period Mean (complement) [mm d-1] |
Bias [mm d-1] |
RMSE [mm d-1] |
Phase Shift [months] |
Bias Score [1] |
RMSE Score [1] |
Seasonal Cycle Score [1] |
Spatial Distribution Score [1] |
Overall Score [1] |
|||
|---|---|---|---|---|---|---|---|---|---|---|---|---|---|---|---|---|
| Benchmark | [-] | 1.17 | ||||||||||||||
| h0 | [-] | 0.940 | 1.02 | 1.17 | 0.576 | 2.42 | -0.134 | 0.655 | 1.45 | 0.534 | 0.364 | 0.792 | 0.893 | 0.589 | ||
| h0a | [-] | 0.940 | 1.02 | 1.17 | 0.576 | 2.42 | -0.134 | 0.655 | 1.45 | 0.534 | 0.364 | 0.792 | 0.893 | 0.589 |
Download Data |
Period Mean (original grids) [mm d-1] |
Model Period Mean (intersection) [mm d-1] |
Benchmark Period Mean (intersection) [mm d-1] |
Model Period Mean (complement) [mm d-1] |
Benchmark Period Mean (complement) [mm d-1] |
Bias [mm d-1] |
RMSE [mm d-1] |
Phase Shift [months] |
Bias Score [1] |
RMSE Score [1] |
Seasonal Cycle Score [1] |
Spatial Distribution Score [1] |
Overall Score [1] |
|||
|---|---|---|---|---|---|---|---|---|---|---|---|---|---|---|---|---|
| Benchmark | [-] | 2.11 | ||||||||||||||
| h0 | [-] | 1.87 | 1.92 | 2.11 | 1.45 | 3.41 | -0.128 | 0.720 | 1.61 | 0.555 | 0.579 | 0.772 | 0.927 | 0.682 | ||
| h0a | [-] | 1.87 | 1.92 | 2.11 | 1.45 | 3.41 | -0.128 | 0.720 | 1.61 | 0.555 | 0.579 | 0.772 | 0.927 | 0.682 |
Download Data |
Period Mean (original grids) [mm d-1] |
Model Period Mean (intersection) [mm d-1] |
Benchmark Period Mean (intersection) [mm d-1] |
Model Period Mean (complement) [mm d-1] |
Benchmark Period Mean (complement) [mm d-1] |
Bias [mm d-1] |
RMSE [mm d-1] |
Phase Shift [months] |
Bias Score [1] |
RMSE Score [1] |
Seasonal Cycle Score [1] |
Spatial Distribution Score [1] |
Overall Score [1] |
|||
|---|---|---|---|---|---|---|---|---|---|---|---|---|---|---|---|---|
| Benchmark | [-] | 0.785 | ||||||||||||||
| h0 | [-] | 0.518 | 0.548 | 0.785 | 0.252 | 0.862 | -0.242 | 0.531 | 0.390 | 0.259 | 0.148 | 0.974 | 0.892 | 0.484 | ||
| h0a | [-] | 0.518 | 0.548 | 0.785 | 0.252 | 0.862 | -0.242 | 0.531 | 0.390 | 0.259 | 0.148 | 0.974 | 0.892 | 0.484 |
Download Data |
Period Mean (original grids) [mm d-1] |
Model Period Mean (intersection) [mm d-1] |
Benchmark Period Mean (intersection) [mm d-1] |
Model Period Mean (complement) [mm d-1] |
Benchmark Period Mean (complement) [mm d-1] |
Bias [mm d-1] |
RMSE [mm d-1] |
Phase Shift [months] |
Bias Score [1] |
RMSE Score [1] |
Seasonal Cycle Score [1] |
Spatial Distribution Score [1] |
Overall Score [1] |
|||
|---|---|---|---|---|---|---|---|---|---|---|---|---|---|---|---|---|
| Benchmark | [-] | 0.787 | ||||||||||||||
| h0 | [-] | 1.09 | 1.05 | 0.785 | 1.86 | 1.85 | 0.320 | 0.548 | 2.09 | 0.543 | 0.667 | 0.688 | 0.950 | 0.703 | ||
| h0a | [-] | 1.09 | 1.05 | 0.785 | 1.86 | 1.85 | 0.320 | 0.548 | 2.09 | 0.543 | 0.667 | 0.688 | 0.950 | 0.703 |
Download Data |
Period Mean (original grids) [mm d-1] |
Model Period Mean (intersection) [mm d-1] |
Benchmark Period Mean (intersection) [mm d-1] |
Model Period Mean (complement) [mm d-1] |
Benchmark Period Mean (complement) [mm d-1] |
Bias [mm d-1] |
RMSE [mm d-1] |
Phase Shift [months] |
Bias Score [1] |
RMSE Score [1] |
Seasonal Cycle Score [1] |
Spatial Distribution Score [1] |
Overall Score [1] |
|||
|---|---|---|---|---|---|---|---|---|---|---|---|---|---|---|---|---|
| Benchmark | [-] | 1.32 | ||||||||||||||
| h0 | [-] | 1.12 | 1.13 | 1.32 | 1.08 | 1.41 | -0.193 | 0.535 | 0.655 | 0.407 | 0.534 | 0.954 | 0.954 | 0.676 | ||
| h0a | [-] | 1.12 | 1.13 | 1.32 | 1.08 | 1.41 | -0.193 | 0.535 | 0.655 | 0.407 | 0.534 | 0.954 | 0.954 | 0.676 |
Download Data |
Period Mean (original grids) [mm d-1] |
Model Period Mean (intersection) [mm d-1] |
Benchmark Period Mean (intersection) [mm d-1] |
Model Period Mean (complement) [mm d-1] |
Benchmark Period Mean (complement) [mm d-1] |
Bias [mm d-1] |
RMSE [mm d-1] |
Phase Shift [months] |
Bias Score [1] |
RMSE Score [1] |
Seasonal Cycle Score [1] |
Spatial Distribution Score [1] |
Overall Score [1] |
|||
|---|---|---|---|---|---|---|---|---|---|---|---|---|---|---|---|---|
| Benchmark | [-] | 1.56 | ||||||||||||||
| h0 | [-] | 1.16 | 1.47 | 1.56 | 0.318 | 2.46 | -0.0719 | 0.675 | 1.35 | 0.432 | 0.468 | 0.812 | 0.970 | 0.630 | ||
| h0a | [-] | 1.16 | 1.47 | 1.56 | 0.318 | 2.46 | -0.0719 | 0.675 | 1.35 | 0.432 | 0.468 | 0.812 | 0.970 | 0.630 |
Download Data |
Period Mean (original grids) [mm d-1] |
Model Period Mean (intersection) [mm d-1] |
Benchmark Period Mean (intersection) [mm d-1] |
Model Period Mean (complement) [mm d-1] |
Benchmark Period Mean (complement) [mm d-1] |
Bias [mm d-1] |
RMSE [mm d-1] |
Phase Shift [months] |
Bias Score [1] |
RMSE Score [1] |
Seasonal Cycle Score [1] |
Spatial Distribution Score [1] |
Overall Score [1] |
|||
|---|---|---|---|---|---|---|---|---|---|---|---|---|---|---|---|---|
| Benchmark | [-] | 0.603 | ||||||||||||||
| h0 | [-] | 0.324 | 0.839 | 0.602 | 0.200 | 0.816 | 0.245 | 0.728 | 1.94 | 0.522 | 0.388 | 0.710 | 0.943 | 0.590 | ||
| h0a | [-] | 0.324 | 0.839 | 0.602 | 0.200 | 0.816 | 0.245 | 0.728 | 1.94 | 0.522 | 0.388 | 0.710 | 0.943 | 0.590 |
Download Data |
Period Mean (original grids) [mm d-1] |
Model Period Mean (intersection) [mm d-1] |
Benchmark Period Mean (intersection) [mm d-1] |
Model Period Mean (complement) [mm d-1] |
Benchmark Period Mean (complement) [mm d-1] |
Bias [mm d-1] |
RMSE [mm d-1] |
Phase Shift [months] |
Bias Score [1] |
RMSE Score [1] |
Seasonal Cycle Score [1] |
Spatial Distribution Score [1] |
Overall Score [1] |
|||
|---|---|---|---|---|---|---|---|---|---|---|---|---|---|---|---|---|
| Benchmark | [-] | 0.876 | ||||||||||||||
| h0 | [-] | 0.528 | 0.615 | 0.875 | 0.276 | 1.05 | -0.265 | 0.558 | 0.574 | 0.251 | 0.187 | 0.961 | 0.906 | 0.499 | ||
| h0a | [-] | 0.528 | 0.615 | 0.875 | 0.276 | 1.05 | -0.265 | 0.558 | 0.574 | 0.251 | 0.187 | 0.961 | 0.906 | 0.499 |
Download Data |
Period Mean (original grids) [mm d-1] |
Model Period Mean (intersection) [mm d-1] |
Benchmark Period Mean (intersection) [mm d-1] |
Model Period Mean (complement) [mm d-1] |
Benchmark Period Mean (complement) [mm d-1] |
Bias [mm d-1] |
RMSE [mm d-1] |
Phase Shift [months] |
Bias Score [1] |
RMSE Score [1] |
Seasonal Cycle Score [1] |
Spatial Distribution Score [1] |
Overall Score [1] |
|||
|---|---|---|---|---|---|---|---|---|---|---|---|---|---|---|---|---|
| Benchmark | [-] | 2.12 | ||||||||||||||
| h0 | [-] | 2.07 | 2.02 | 2.12 | 2.48 | 3.11 | -0.0134 | 0.664 | 1.59 | 0.538 | 0.626 | 0.783 | 0.976 | 0.710 | ||
| h0a | [-] | 2.07 | 2.02 | 2.12 | 2.48 | 3.11 | -0.0134 | 0.664 | 1.59 | 0.538 | 0.626 | 0.783 | 0.976 | 0.710 |
Download Data |
Period Mean (original grids) [mm d-1] |
Model Period Mean (intersection) [mm d-1] |
Benchmark Period Mean (intersection) [mm d-1] |
Model Period Mean (complement) [mm d-1] |
Benchmark Period Mean (complement) [mm d-1] |
Bias [mm d-1] |
RMSE [mm d-1] |
Phase Shift [months] |
Bias Score [1] |
RMSE Score [1] |
Seasonal Cycle Score [1] |
Spatial Distribution Score [1] |
Overall Score [1] |
|||
|---|---|---|---|---|---|---|---|---|---|---|---|---|---|---|---|---|
| Benchmark | [-] | 1.88 | ||||||||||||||
| h0 | [-] | 1.77 | 1.78 | 1.88 | 1.79 | 2.22 | -0.0786 | 0.540 | 0.498 | 0.458 | 0.496 | 0.953 | 0.975 | 0.676 | ||
| h0a | [-] | 1.77 | 1.78 | 1.88 | 1.79 | 2.22 | -0.0786 | 0.540 | 0.498 | 0.458 | 0.496 | 0.953 | 0.975 | 0.676 |
Download Data |
Period Mean (original grids) [mm d-1] |
Model Period Mean (intersection) [mm d-1] |
Benchmark Period Mean (intersection) [mm d-1] |
Model Period Mean (complement) [mm d-1] |
Benchmark Period Mean (complement) [mm d-1] |
Bias [mm d-1] |
RMSE [mm d-1] |
Phase Shift [months] |
Bias Score [1] |
RMSE Score [1] |
Seasonal Cycle Score [1] |
Spatial Distribution Score [1] |
Overall Score [1] |
|||
|---|---|---|---|---|---|---|---|---|---|---|---|---|---|---|---|---|
| Benchmark | [-] | 1.14 | ||||||||||||||
| h0 | [-] | 1.03 | 1.03 | 1.14 | 1.08 | 1.45 | -0.102 | 0.499 | 0.153 | 0.527 | 0.334 | 0.989 | 0.990 | 0.635 | ||
| h0a | [-] | 1.03 | 1.03 | 1.14 | 1.08 | 1.45 | -0.102 | 0.499 | 0.153 | 0.527 | 0.334 | 0.989 | 0.990 | 0.635 |
Download Data |
Period Mean (original grids) [mm d-1] |
Model Period Mean (intersection) [mm d-1] |
Benchmark Period Mean (intersection) [mm d-1] |
Model Period Mean (complement) [mm d-1] |
Benchmark Period Mean (complement) [mm d-1] |
Bias [mm d-1] |
RMSE [mm d-1] |
Phase Shift [months] |
Bias Score [1] |
RMSE Score [1] |
Seasonal Cycle Score [1] |
Spatial Distribution Score [1] |
Overall Score [1] |
|||
|---|---|---|---|---|---|---|---|---|---|---|---|---|---|---|---|---|
| Benchmark | [-] | 0.787 | ||||||||||||||
| h0 | [-] | 0.863 | 0.876 | 0.786 | 1.02 | 1.95 | 0.0990 | 0.644 | 2.01 | 0.577 | 0.408 | 0.691 | 0.960 | 0.609 | ||
| h0a | [-] | 0.863 | 0.876 | 0.786 | 1.02 | 1.95 | 0.0990 | 0.644 | 2.01 | 0.577 | 0.408 | 0.691 | 0.960 | 0.609 |
Download Data |
Period Mean (original grids) [mm d-1] |
Model Period Mean (intersection) [mm d-1] |
Benchmark Period Mean (intersection) [mm d-1] |
Model Period Mean (complement) [mm d-1] |
Benchmark Period Mean (complement) [mm d-1] |
Bias [mm d-1] |
RMSE [mm d-1] |
Phase Shift [months] |
Bias Score [1] |
RMSE Score [1] |
Seasonal Cycle Score [1] |
Spatial Distribution Score [1] |
Overall Score [1] |
|||
|---|---|---|---|---|---|---|---|---|---|---|---|---|---|---|---|---|
| Benchmark | [-] | 3.61 | ||||||||||||||
| h0 | [-] | 3.16 | 3.16 | 3.61 | 3.01 | 3.92 | -0.458 | 0.741 | 2.07 | 0.382 | 0.681 | 0.692 | 0.895 | 0.666 | ||
| h0a | [-] | 3.16 | 3.16 | 3.61 | 3.01 | 3.92 | -0.458 | 0.741 | 2.07 | 0.382 | 0.681 | 0.692 | 0.895 | 0.666 |
Download Data |
Period Mean (original grids) [mm d-1] |
Model Period Mean (intersection) [mm d-1] |
Benchmark Period Mean (intersection) [mm d-1] |
Model Period Mean (complement) [mm d-1] |
Benchmark Period Mean (complement) [mm d-1] |
Bias [mm d-1] |
RMSE [mm d-1] |
Phase Shift [months] |
Bias Score [1] |
RMSE Score [1] |
Seasonal Cycle Score [1] |
Spatial Distribution Score [1] |
Overall Score [1] |
|||
|---|---|---|---|---|---|---|---|---|---|---|---|---|---|---|---|---|
| Benchmark | [-] | 1.96 | ||||||||||||||
| h0 | [-] | 2.20 | 2.19 | 1.96 | 2.30 | 1.88 | 0.233 | 0.979 | 1.40 | 0.279 | 0.547 | 0.826 | 0.920 | 0.624 | ||
| h0a | [-] | 2.20 | 2.19 | 1.96 | 2.30 | 1.88 | 0.233 | 0.979 | 1.40 | 0.279 | 0.547 | 0.826 | 0.920 | 0.624 |
Download Data |
Period Mean (original grids) [mm d-1] |
Model Period Mean (intersection) [mm d-1] |
Benchmark Period Mean (intersection) [mm d-1] |
Model Period Mean (complement) [mm d-1] |
Benchmark Period Mean (complement) [mm d-1] |
Bias [mm d-1] |
RMSE [mm d-1] |
Phase Shift [months] |
Bias Score [1] |
RMSE Score [1] |
Seasonal Cycle Score [1] |
Spatial Distribution Score [1] |
Overall Score [1] |
|||
|---|---|---|---|---|---|---|---|---|---|---|---|---|---|---|---|---|
| Benchmark | [-] | 1.17 | ||||||||||||||
| h0 | [-] | 0.961 | 1.07 | 1.17 | 0.500 | 0.995 | -0.0990 | 0.622 | 1.79 | 0.465 | 0.519 | 0.731 | 0.944 | 0.635 | ||
| h0a | [-] | 0.961 | 1.07 | 1.17 | 0.500 | 0.995 | -0.0990 | 0.622 | 1.79 | 0.465 | 0.519 | 0.731 | 0.944 | 0.635 |
Temporally integrated period mean